Coronado Airbnb Market Analysis 2026: Short Term Rental Data & Vacation Rental Statistics in California, United States
Is Airbnb profitable in Coronado in 2026? Explore comprehensive Airbnb analytics for Coronado, California, United States to uncover income potential. This 2026 STR market report for Coronado, based on AirROI data from February 2025 to January 2026, reveals key trends in the niche market of 133 active listings.
Whether you're considering an Airbnb investment in Coronado, optimizing your existing vacation rental, or exploring rental arbitrage opportunities, understanding the Coronado Airbnb data is crucial. Leveraging the low regulation environment is key to maximizing your short term rental income potential. Let's dive into the specifics.
Key Coronado Airbnb Performance Metrics Overview
Monthly Airbnb Revenue Variations & Income Potential in Coronado (2026)
Understanding the monthly revenue variations for Airbnb listings in Coronado is key to maximizing your short term rental income potential. Seasonality significantly impacts earnings. Our analysis, based on data from the past 12 months, shows that the peak revenue month for STRs in Coronado is typically July, while January often presents the lowest earnings, highlighting opportunities for strategic pricing adjustments during shoulder and low seasons. Explore the typical Airbnb income in Coronado across different performance tiers:
- Best-in-class properties (Top 10%) achieve $14,835+ monthly, often utilizing dynamic pricing and superior guest experiences.
- Strong performing properties (Top 25%) earn $7,625 or more, indicating effective management and desirable locations/amenities.
- Typical properties (Median) generate around $4,324 per month, representing the average market performance.
- Entry-level properties (Bottom 25%) see earnings around $1,829, often with potential for optimization.
Average Monthly Airbnb Earnings Trend in Coronado
Coronado Airbnb Occupancy Rate Trends (2026)
Maximize your bookings by understanding the Coronado STR occupancy trends. Seasonal demand shifts significantly influence how often properties are booked. Typically, Julysees the highest demand (peak season occupancy), while January experiences the lowest (low season). Effective strategies, like adjusting minimum stays or offering promotions, can boost occupancy during slower periods. Here's how different property tiers perform in Coronado:
- Best-in-class properties (Top 10%) achieve 85%+ occupancy, indicating high desirability and potentially optimized availability.
- Strong performing properties (Top 25%) maintain 68% or higher occupancy, suggesting good market fit and guest satisfaction.
- Typical properties (Median) have an occupancy rate around 42%.
- Entry-level properties (Bottom 25%) average 16% occupancy, potentially facing higher vacancy.
Average Monthly Occupancy Rate Trend in Coronado
Average Daily Rate (ADR) Airbnb Trends in Coronado (2026)
Effective short term rental pricing strategy in Coronado involves understanding monthly ADR fluctuations. The Average Daily Rate (ADR) for Airbnb in Coronado typically peaks in July and dips lowest during February. Leveraging Airbnb dynamic pricing tools or strategies based on this seasonality can significantly boost revenue. Here's a look at the typical nightly rates achieved:
- Best-in-class properties (Top 10%) command rates of $894+ per night, often due to premium features or locations.
- Strong performing properties (Top 25%) achieve nightly rates of $509 or more.
- Typical properties (Median) charge around $317 per night.
- Entry-level properties (Bottom 25%) earn around $220 per night.
Average Daily Rate (ADR) Trend by Month in Coronado
Get Live Coronado Market Intelligence 👇

Explore Real-time Analytics
Airbnb Seasonality Analysis & Trends in Coronado (2026)
Peak Season (July, August, March)
- Revenue averages $7,848 per month
- Occupancy rates average 52.4%
- Daily rates average $458
Shoulder Season
- Revenue averages $6,423 per month
- Occupancy maintains around 42.3%
- Daily rates hold near $444
Low Season (January, February, December)
- Revenue drops to average $4,973 per month
- Occupancy decreases to average 39.0%
- Daily rates adjust to average $426
Seasonality Insights for Coronado
- The Airbnb seasonality in Coronado shows highly seasonal trends requiring careful strategy. While the sections above show seasonal averages, it's also insightful to look at the extremes:
- During the high season, the absolute peak month showcases Coronado's highest earning potential, with monthly revenues capable of climbing to $9,439, occupancy reaching a high of 55.8%, and ADRs peaking at $480.
- Conversely, the slowest single month of the year, typically falling within the low season, marks the market's lowest point. In this month, revenue might dip to $4,107, occupancy could drop to 30.5%, and ADRs may adjust down to $422.
- Understanding both the seasonal averages and these monthly peaks and troughs in revenue, occupancy, and ADR is crucial for maximizing your Airbnb profit potential in Coronado.
Seasonal Strategies for Maximizing Profit
- Peak Season: Maximize revenue through premium pricing and potentially longer minimum stays. Ensure high availability.
- Low Season: Offer competitive pricing, special promotions (e.g., extended stay discounts), and flexible cancellation policies. Target off-season travelers like remote workers or budget-conscious guests.
- Shoulder Seasons: Implement dynamic pricing that balances peak and low rates. Target weekend travelers or specific events. Offer slightly more flexible terms than peak season.
- Regularly analyze your own performance against these Coronado seasonality benchmarks and adjust your pricing and availability strategy accordingly.
Best Areas for Airbnb Investment in Coronado (2026)
Exploring the top neighborhoods for short-term rentals in Coronado? This section highlights key areas, outlining why they are attractive for hosts and guests, along with notable local attractions. Consider these locations based on your target guest profile and investment strategy.
| Neighborhood / Area | Why Host Here? (Target Guests & Appeal) | Key Attractions & Landmarks |
|---|---|---|
| Coronado Beach | Renowned for its stunning sandy shores and picturesque ocean views. Perfect for families and vacationers seeking a beach getaway with water activities and relaxation. | Coronado Central Beach, Hotel del Coronado, Coronado Shores, The Coronado Ferry Landing, Silver Strand State Beach |
| Orange Avenue | The main street of Coronado filled with shops, restaurants, and cafes. A bustling area that attracts both locals and tourists looking for dining and entertainment options. | Coronado Village Theatre, Crown City Inn, Coronado Brewing Company, Peohe's, The Village, Lamb's Players Theatre |
| Glorietta Bay | A tranquil residential area with waterfront views, ideal for guests looking for a peaceful retreat close to the beach and parks. | Glorietta Bay Park, Coronado Yacht Club, The Ferry Landing Marketplace, Sunset Park, Coronado Dog Park |
| Silver Strand Beach | A beautiful beach area known for its mild weather and scenic views. Great for outdoor enthusiasts, surfers, and beach lovers. | Silver Strand State Beach, Coronado Cays, Kayaking, Beach Volleyball, Fishing |
| Coronado Golf Course | A golfer's paradise with breathtaking views of the San Diego skyline and the bay. Attractive for guests who enjoy golf and outdoor activities. | Coronado Municipal Golf Course, Tennis Courts, Golf Pro Shop, Dining at the 19th Hole, Scenic Views of San Diego |
| The Coronado Historical District | A charming area with historical significance featuring Victorian-style architecture. Ideal for travelers interested in culture and history. | The Coronado Museum of History and Art, Historic Hotel del Coronado, The Coronado Library, The Catholic Church of Our Lady of the Rosary |
| Coronado Island | Known for its exclusive neighborhoods and stunning ocean views. Attracts high-end travelers and those looking for luxury accommodations. | Cays Water Sports, Coronado Tennis Center, The Spa at the Del, Coronado Beach Clubs |
| San Diego Bay | Offers stunning views and access to various water activities. A prime location that draws tourists looking for adventure and relaxation by the water. | The San Diego Bay Walk, Ferry to San Diego, Biking and Walking Trails, Pristine Beaches |
Understanding Airbnb License Requirements & STR Laws in Coronado (2026)
While Coronado, California, United States currently shows low STR regulations, specific Airbnb license requirements might still exist or change. Always verify the latest short term rental regulations and Airbnb license requirements directly with local government authorities for Coronado to ensure full compliance before hosting.
(Source: AirROI data, 2026, finding no licensed listings among those analyzed)
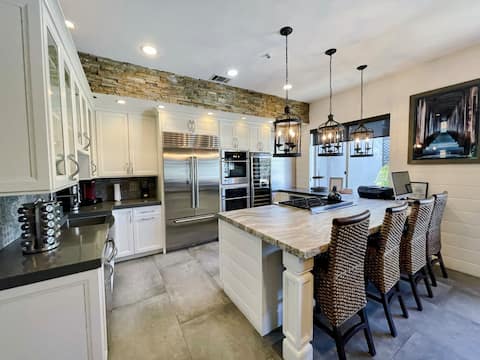
Top Performing Airbnb Properties in Coronado (2026)
Benchmark your potential! Explore examples of top-performing Airbnb properties in Coronadobased on Trailing Twelve Month (TTM) revenue. Analyze their characteristics, revenue, occupancy rate, and ADR to understand what drives success in this market.

Coronado Crown 1 | 3BR Heart of Village w/ Hot Tub
Entire Place • 3 bedrooms

Coronado Crown Villas | 6BR Village Gem w/ Hot Tub
Entire Place • 6 bedrooms
Steps Away to Coronado Beach, Restaurants, Rooftop
Entire Place • 4 bedrooms

The Glass Haus Coronado UltraModern Luxury Retreat
Entire Place • 5 bedrooms

B5377 Coronado Crown Villa 2.
Entire Place • 3 bedrooms

Beachfront Island Home, giant Gated-Yard, AC + BBQ
Entire Place • 3 bedrooms
Note: Performance varies based on location, size, amenities, seasonality, and management quality. Data reflects the past 12 months.
Top Performing Airbnb Hosts in Coronado (2026)
Learn from the best! This table showcases top-performing Airbnb hosts in Coronado based on the number of properties managed and estimated total revenue over the past year. Analyze their scale and performance metrics.
| Host Name | Properties | Grossing Revenue | Stay Reviews | Avg Rating |
|---|---|---|---|---|
| Bluewater Vacation Homes | 3 | $860,265 | 70 | 4.98/5.0 |
| Alan | 9 | $790,959 | 705 | 4.83/5.0 |
| Amanda | 2 | $426,663 | 143 | 4.85/5.0 |
| Christy | 1 | $238,018 | 30 | 4.87/5.0 |
| RoomPicks | 8 | $233,870 | 27 | 4.50/5.0 |
| Coronado Beach Resort | 3 | $230,640 | 729 | 4.77/5.0 |
| Mari Katherine | 4 | $201,797 | 44 | 4.92/5.0 |
| Michelle | 1 | $160,486 | 85 | 5.00/5.0 |
| Karlyn | 1 | $159,619 | 6 | 5.00/5.0 |
| Amy | 2 | $157,602 | 15 | 5.00/5.0 |
Analyzing the strategies of top hosts, such as their property selection, pricing, and guest communication, can offer valuable lessons for optimizing your own Airbnb operations in Coronado.
Dive Deeper: Advanced Coronado STR Market Data (2026)
Ready to unlock more insights? AirROI provides access to advanced metrics and comprehensive Airbnb data for Coronado. Explore detailed analytics beyond this report to refine your investment strategy, optimize pricing, and maximize your vacation rental profits.
Explore Advanced MetricsCoronado Short-Term Rental Market Composition (2026): Property & Room Types
Room Type Distribution
Property Type Distribution
Market Composition Insights for Coronado
- The Coronado Airbnb market composition is heavily skewed towards Entire Home/Apt listings, which make up 85.7% of the 133 active rentals. This indicates strong guest preference for privacy and space.
- Looking at the property type distribution in Coronado, Apartment/Condo properties are the most common (45.1%), reflecting the local real estate landscape.
- Houses represent a significant 39.8% portion, catering likely to families or larger groups.
- The presence of 14.3% Hotel/Boutique listings indicates integration with traditional hospitality.
- Smaller segments like others (combined 0.8%) offer potential for unique stay experiences.
Coronado Airbnb Room Capacity Analysis (2026): Bedroom Distribution
Distribution of Listings by Number of Bedrooms
Room Capacity Insights for Coronado
- The dominant room capacity in Coronado is 1 bedroom listings, making up 36.1% of the market. This suggests a strong demand for properties suitable for couples or solo travelers.
- Together, 1 bedroom and 2 bedrooms properties represent 60.9% of the active Airbnb listings in Coronado, indicating a high concentration in these sizes.
- A significant 31.5% of listings offer 3+ bedrooms, catering to larger groups and families seeking more space in Coronado.
Coronado Vacation Rental Guest Capacity Trends (2026)
Distribution of Listings by Guest Capacity
Guest Capacity Insights for Coronado
- The most common guest capacity trend in Coronado vacation rentals is listings accommodating 4 guests (33.1%). This suggests the primary traveler segment is likely small families or groups.
- Properties designed for 4 guests and 8+ guests dominate the Coronado STR market, accounting for 51.1% of listings.
- 38.3% of properties accommodate 6+ guests, serving the market segment for larger families or group travel in Coronado.
- On average, properties in Coronado are equipped to host 4.6 guests.
Coronado Airbnb Booking Patterns (2026): Available vs. Booked Days
Available Days Distribution
Booked Days Distribution
Booking Pattern Insights for Coronado
- The most common availability pattern in Coronado falls within the 271-366 days range, representing 60.2% of listings. This suggests many properties have significant open periods on their calendars.
- Approximately 81.3% of listings show high availability (181+ days open annually), indicating potential for increased bookings or specific owner usage patterns.
- For booked days, the 31-90 days range is most frequent in Coronado (31.6%), reflecting common guest stay durations or potential owner blocking patterns.
- A notable 18.8% of properties secure long booking periods (181+ days booked per year), highlighting successful long-term rental strategies or significant owner usage.
Coronado Airbnb Minimum Stay Requirements Analysis
Distribution of Listings by Minimum Night Requirement
1 Night
18 listings
13.5% of total
2 Nights
2 listings
1.5% of total
4-6 Nights
5 listings
3.8% of total
7-29 Nights
87 listings
65.4% of total
30+ Nights
21 listings
15.8% of total
Key Insights
- The most prevalent minimum stay requirement in Coronado is 7-29 Nights, adopted by 65.4% of listings. This highlights the market's preference for shorter, flexible bookings.
- Very short stays (1-2 nights) are less common (15.0%), suggesting hosts prefer slightly longer bookings to optimize turnover.
- A significant segment (15.8%) caters to monthly stays (30+ nights) in Coronado, pointing to opportunities in the extended-stay market.
Recommendations
- Align with the market by considering a 7-29 Nights minimum stay, as 65.4% of Coronado hosts use this setting.
- If feasible, allowing 1-night stays, especially midweek or during low season, could capture last-minute bookings, as only 13.5% currently do.
- Explore offering discounts for stays of 30+ nights to attract the 15.8% of the market seeking extended stays.
- Adjust minimum nights based on seasonality – potentially shorter during low season and longer during peak demand periods in Coronado.
Coronado Airbnb Cancellation Policy Trends Analysis (2026)
Super Strict 60 Days
1 listings
0.8% of total
Flexible
7 listings
5.3% of total
Moderate
15 listings
11.5% of total
Firm
63 listings
48.1% of total
Strict
45 listings
34.4% of total
Cancellation Policy Insights for Coronado
- The prevailing Airbnb cancellation policy trend in Coronado is Firm, used by 48.1% of listings.
- A majority (82.5%) of hosts in Coronado utilize Firm or Strict policies, indicating a market where hosts prioritize booking security.
Recommendations for Hosts
- Consider adopting a Firm policy to align with the 48.1% market standard in Coronado.
- With 34.4% using Strict terms, this is a viable option in Coronado, particularly for high-value properties or during peak demand periods.
- Regularly review your cancellation policy against competitors and market demand shifts in Coronado.
Coronado STR Booking Lead Time Analysis (2026)
Average Booking Lead Time by Month
Booking Lead Time Insights for Coronado
- The overall average booking lead time for vacation rentals in Coronado is 67 days.
- Guests book furthest in advance for stays during July (average 104 days), likely coinciding with peak travel demand or local events.
- The shortest booking windows occur for stays in April (average 43 days), indicating more last-minute travel plans during this time.
- Seasonally, Summer (83 days avg.) sees the longest lead times, while Spring (47 days avg.) has the shortest, reflecting typical travel planning cycles.
Recommendations for Hosts
- Use the overall average lead time (67 days) as a baseline for your pricing and availability strategy in Coronado.
- For July stays, consider implementing length-of-stay discounts or slightly higher rates for bookings made less than 104 days out to capitalize on advance planning.
- Target marketing efforts for the Summer season well in advance (at least 83 days) to capture early planners.
- Monitor your own booking lead times against these Coronado averages to identify opportunities for dynamic pricing adjustments.
Popular & Essential Airbnb Amenities in Coronado (2026)
Amenity Prevalence
Amenity Insights for Coronado
- Essential amenities in Coronado that guests expect include: Wifi, Smoke alarm, TV. Lacking these (any) could significantly impact bookings.
- Popular amenities like Heating, Coffee maker, Carbon monoxide alarm are common but not universal. Offering these can provide a competitive edge.
Recommendations for Hosts
- Ensure your listing includes all essential amenities for Coronado: Wifi, Smoke alarm, TV.
- Prioritize adding missing essentials: Smoke alarm, TV.
- Consider adding popular differentiators like Heating or Coffee maker to increase appeal.
- Highlight unique or less common amenities you offer (e.g., hot tub, dedicated workspace, EV charger) in your listing description and photos.
- Regularly check competitor amenities in Coronado to stay competitive.
Coronado Airbnb Guest Demographics & Profile Analysis (2026)
Guest Profile Summary for Coronado
- The typical guest profile for Airbnb in Coronado consists of primarily domestic travelers (94%), often arriving from nearby Phoenix, typically belonging to the Post-2000s (Gen Z/Alpha) group (50%), primarily speaking English or Spanish.
- Domestic travelers account for 93.9% of guests.
- Key international markets include United States (93.9%) and Mexico (1%).
- Top languages spoken are English (73.8%) followed by Spanish (9.4%).
- A significant demographic segment is the Post-2000s (Gen Z/Alpha) group, representing 50% of guests.
Recommendations for Hosts
- Target domestic marketing efforts towards travelers from Phoenix and San Diego.
- Tailor amenities and listing descriptions to appeal to the dominant Post-2000s (Gen Z/Alpha) demographic (e.g., highlight fast WiFi, smart home features, local guides).
- Highlight unique local experiences or amenities relevant to the primary guest profile.
- Consider seasonal promotions aligned with peak travel times for key origin markets.
Nearby Short-Term Rental Market Comparison
How does the Coronado Airbnb market stack up against its neighbors? Compare key performance metrics like average monthly revenue, ADR, and occupancy rates in surrounding areas to understand the broader regional STR landscape.
| Market | Active Properties | Monthly Revenue | Daily Rate | Avg. Occupancy |
|---|---|---|---|---|
| Newport Beach | 1,273 | $8,950 | $744.06 | 47% |
| Rancho San Diego | 25 | $8,649 | $568.72 | 48% |
| Thousand Palms | 33 | $8,119 | $725.48 | 36% |
| Manhattan Beach | 267 | $7,875 | $585.30 | 53% |
| Lakeside | 33 | $7,537 | $604.33 | 44% |
| GlenOak Hills | 41 | $7,394 | $648.65 | 41% |
| Bermuda Dunes | 143 | $7,324 | $664.90 | 39% |
| Mount Helix | 33 | $7,163 | $594.94 | 50% |
| Del Mar | 128 | $7,011 | $671.56 | 45% |
| Avalon | 249 | $6,705 | $696.60 | 38% |