Chula Vista Airbnb Market Analysis 2026: Short Term Rental Data & Vacation Rental Statistics in California, United States
Is Airbnb profitable in Chula Vista in 2026? Explore comprehensive Airbnb analytics for Chula Vista, California, United States to uncover income potential. This 2026 STR market report for Chula Vista, based on AirROI data from February 2025 to January 2026, reveals key trends in the market of 232 active listings.
Whether you're considering an Airbnb investment in Chula Vista, optimizing your existing vacation rental, or exploring rental arbitrage opportunities, understanding the Chula Vista Airbnb data is crucial. Navigating the high regulation landscape is key to maximizing your short term rental income potential. Let's dive into the specifics.
Key Chula Vista Airbnb Performance Metrics Overview
Monthly Airbnb Revenue Variations & Income Potential in Chula Vista (2026)
Understanding the monthly revenue variations for Airbnb listings in Chula Vista is key to maximizing your short term rental income potential. Seasonality significantly impacts earnings. Our analysis, based on data from the past 12 months, shows that the peak revenue month for STRs in Chula Vista is typically July, while January often presents the lowest earnings, highlighting opportunities for strategic pricing adjustments during shoulder and low seasons. Explore the typical Airbnb income in Chula Vista across different performance tiers:
- Best-in-class properties (Top 10%) achieve $8,399+ monthly, often utilizing dynamic pricing and superior guest experiences.
- Strong performing properties (Top 25%) earn $5,462 or more, indicating effective management and desirable locations/amenities.
- Typical properties (Median) generate around $2,747 per month, representing the average market performance.
- Entry-level properties (Bottom 25%) see earnings around $1,388, often with potential for optimization.
Average Monthly Airbnb Earnings Trend in Chula Vista
Chula Vista Airbnb Occupancy Rate Trends (2026)
Maximize your bookings by understanding the Chula Vista STR occupancy trends. Seasonal demand shifts significantly influence how often properties are booked. Typically, Julysees the highest demand (peak season occupancy), while January experiences the lowest (low season). Effective strategies, like adjusting minimum stays or offering promotions, can boost occupancy during slower periods. Here's how different property tiers perform in Chula Vista:
- Best-in-class properties (Top 10%) achieve 85%+ occupancy, indicating high desirability and potentially optimized availability.
- Strong performing properties (Top 25%) maintain 73% or higher occupancy, suggesting good market fit and guest satisfaction.
- Typical properties (Median) have an occupancy rate around 55%.
- Entry-level properties (Bottom 25%) average 30% occupancy, potentially facing higher vacancy.
Average Monthly Occupancy Rate Trend in Chula Vista
Average Daily Rate (ADR) Airbnb Trends in Chula Vista (2026)
Effective short term rental pricing strategy in Chula Vista involves understanding monthly ADR fluctuations. The Average Daily Rate (ADR) for Airbnb in Chula Vista typically peaks in July and dips lowest during January. Leveraging Airbnb dynamic pricing tools or strategies based on this seasonality can significantly boost revenue. Here's a look at the typical nightly rates achieved:
- Best-in-class properties (Top 10%) command rates of $458+ per night, often due to premium features or locations.
- Strong performing properties (Top 25%) achieve nightly rates of $294 or more.
- Typical properties (Median) charge around $162 per night.
- Entry-level properties (Bottom 25%) earn around $92 per night.
Average Daily Rate (ADR) Trend by Month in Chula Vista
Get Live Chula Vista Market Intelligence 👇

Explore Real-time Analytics
Airbnb Seasonality Analysis & Trends in Chula Vista (2026)
Peak Season (July, June, August)
- Revenue averages $5,032 per month
- Occupancy rates average 60.0%
- Daily rates average $258
Shoulder Season
- Revenue averages $3,665 per month
- Occupancy maintains around 50.4%
- Daily rates hold near $240
Low Season (January, February, September)
- Revenue drops to average $2,982 per month
- Occupancy decreases to average 46.6%
- Daily rates adjust to average $226
Seasonality Insights for Chula Vista
- The Airbnb seasonality in Chula Vista shows highly seasonal trends requiring careful strategy. While the sections above show seasonal averages, it's also insightful to look at the extremes:
- During the high season, the absolute peak month showcases Chula Vista's highest earning potential, with monthly revenues capable of climbing to $5,936, occupancy reaching a high of 66.3%, and ADRs peaking at $263.
- Conversely, the slowest single month of the year, typically falling within the low season, marks the market's lowest point. In this month, revenue might dip to $2,811, occupancy could drop to 43.3%, and ADRs may adjust down to $222.
- Understanding both the seasonal averages and these monthly peaks and troughs in revenue, occupancy, and ADR is crucial for maximizing your Airbnb profit potential in Chula Vista.
Seasonal Strategies for Maximizing Profit
- Peak Season: Maximize revenue through premium pricing and potentially longer minimum stays. Ensure high availability.
- Low Season: Offer competitive pricing, special promotions (e.g., extended stay discounts), and flexible cancellation policies. Target off-season travelers like remote workers or budget-conscious guests.
- Shoulder Seasons: Implement dynamic pricing that balances peak and low rates. Target weekend travelers or specific events. Offer slightly more flexible terms than peak season.
- Regularly analyze your own performance against these Chula Vista seasonality benchmarks and adjust your pricing and availability strategy accordingly.
Best Areas for Airbnb Investment in Chula Vista (2026)
Exploring the top neighborhoods for short-term rentals in Chula Vista? This section highlights key areas, outlining why they are attractive for hosts and guests, along with notable local attractions. Consider these locations based on your target guest profile and investment strategy.
| Neighborhood / Area | Why Host Here? (Target Guests & Appeal) | Key Attractions & Landmarks |
|---|---|---|
| Eastlake | Family-friendly suburban community with good schools and parks. Appeals to families and travelers seeking a quiet, residential atmosphere with local amenities. | Eastlake Park, Otay Lakes County Park, Chula Vista Nature Center, Eastlake Village Marketplace, Salt Creek Community Park |
| Bonita | Quaint neighborhood known for its natural beauty and outdoor activities, perfect for visitors who enjoy hiking and a more relaxed environment. | Sweetwater Summit Regional Park, Otay Valley Regional Park, Bonita Golf Club, Bonita Museum and Cultural Center, Nature preserves |
| San Diego Bayfront | Proximity to the bay and stunning waterfront views. A hotspot for tourists looking for outdoor activities, dining, and entertainment. | Chula Vista Marina, Aquatic Center, Bayfront Park, Harbor View Park, The Steel Mill Bistro |
| Chula Vista Downtown | Vibrant downtown area with shops, restaurants, and community events. Attractive for visitors wanting to immerse in local culture. | Third Avenue Village, Chula Vista Public Library, Chula Vista Center, Civic Center Plaza, Local live music venues |
| Otay Ranch | Developed area with modern amenities and shopping, appealing to visitors who want a suburban feel with convenience. | Otay Ranch Town Center, Nearby freeway access, Family-friendly parks, Shopping and dining options |
| Southwest Chula Vista | Close to the border and the beach, with access to unique local experiences and attractions. | Silver Strand State Beach, Chula Vista Wildlife Refuge, Fishing pier, Local taco shops, Coronado Island accessibility |
| Mount San Miguel | Scenic views and outdoor activities, appealing to nature lovers and those looking for an active lifestyle. | Mount San Miguel Park, Nearby hiking trails, Great views of San Diego, Community sports facilities |
| West Chula Vista | Diverse neighborhood with cultural attractions and easy access to San Diego, attracting a variety of travelers. | North Island Credit Union Amphitheatre, Chula Vista Community Park, Local arts and culture spots, Restaurants with diverse cuisines |
Understanding Airbnb License Requirements & STR Laws in Chula Vista (2026)
Yes, Chula Vista, California, United States enforces high STR regulations. Obtaining a license and ensuring compliance is almost certainly required according to current 2026 STR laws. Always verify the latest short term rental regulations and Airbnb license requirements directly with local government authorities for Chula Vista to ensure full compliance before hosting.
(Source: AirROI data, 2026, based on 77% licensed listings)
Top Performing Airbnb Properties in Chula Vista (2026)
Benchmark your potential! Explore examples of top-performing Airbnb properties in Chula Vistabased on Trailing Twelve Month (TTM) revenue. Analyze their characteristics, revenue, occupancy rate, and ADR to understand what drives success in this market.
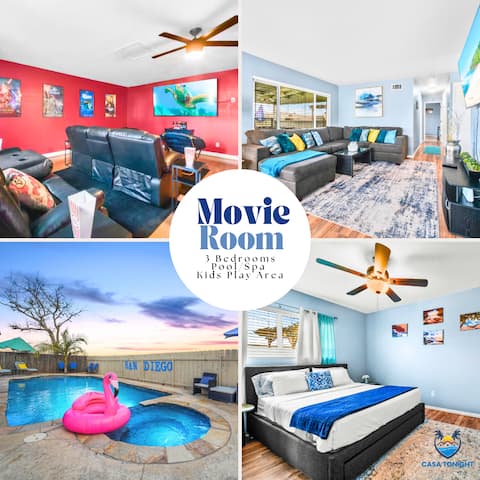
Family Retreat w/ Theater, Pool & Outdoor Dining
Entire Place • 3 bedrooms
Traveler's Dream:Outdoor Bar, Cabana, Arcade, Pool
Entire Place • 3 bedrooms
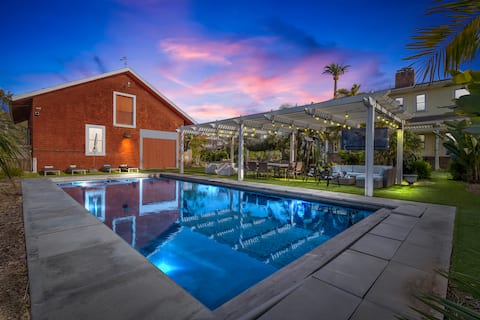
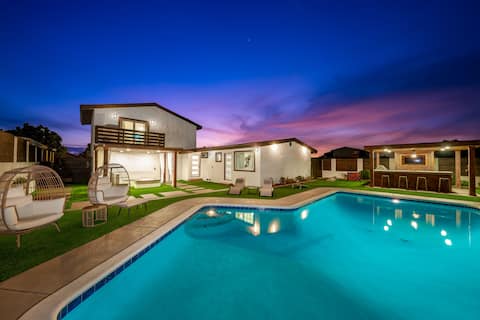
Historic Estate • Pool, Spa & Private Grounds
Entire Place • 7 bedrooms

Jacuzzi/Outdoor Bar/ 1 Mile to Gaylord Resorts
Entire Place • 5 bedrooms

Villa Amarone-San Diego-View, HotTub, Pet friendly
Entire Place • 4 bedrooms
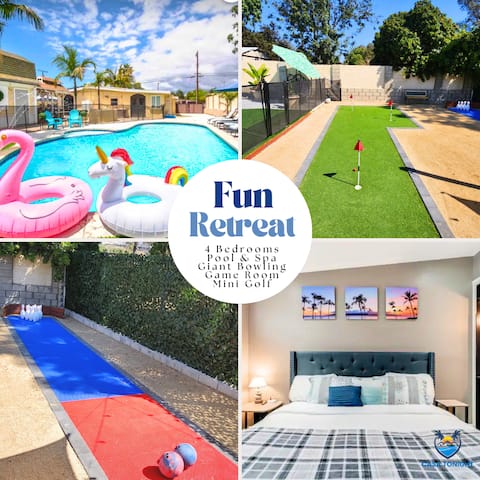
Luxury 4BR Home w/ Pool, Mini Golf & Movie Theater
Entire Place • 4 bedrooms
Note: Performance varies based on location, size, amenities, seasonality, and management quality. Data reflects the past 12 months.
Top Performing Airbnb Hosts in Chula Vista (2026)
Learn from the best! This table showcases top-performing Airbnb hosts in Chula Vista based on the number of properties managed and estimated total revenue over the past year. Analyze their scale and performance metrics.
| Host Name | Properties | Grossing Revenue | Stay Reviews | Avg Rating |
|---|---|---|---|---|
| Nicole | 4 | $368,959 | 451 | 4.78/5.0 |
| Jesus | 4 | $308,486 | 1073 | 4.87/5.0 |
| Evolve | 9 | $246,560 | 237 | 4.69/5.0 |
| Robert | 2 | $170,214 | 296 | 4.91/5.0 |
| Melissa | 1 | $157,363 | 83 | 4.95/5.0 |
| Global Reliable Rentals | 3 | $153,940 | 420 | 4.84/5.0 |
| David | 1 | $152,914 | 11 | 5.00/5.0 |
| Van | 3 | $151,780 | 450 | 4.87/5.0 |
| Villa Vino Stays | 1 | $137,906 | 95 | 4.94/5.0 |
| Zesty Estates | 1 | $115,113 | 184 | 4.80/5.0 |
Analyzing the strategies of top hosts, such as their property selection, pricing, and guest communication, can offer valuable lessons for optimizing your own Airbnb operations in Chula Vista.
Dive Deeper: Advanced Chula Vista STR Market Data (2026)
Ready to unlock more insights? AirROI provides access to advanced metrics and comprehensive Airbnb data for Chula Vista. Explore detailed analytics beyond this report to refine your investment strategy, optimize pricing, and maximize your vacation rental profits.
Explore Advanced MetricsChula Vista Short-Term Rental Market Composition (2026): Property & Room Types
Room Type Distribution
Property Type Distribution
Market Composition Insights for Chula Vista
- The Chula Vista Airbnb market composition is heavily skewed towards Entire Home/Apt listings, which make up 75.4% of the 232 active rentals. This indicates strong guest preference for privacy and space.
- Looking at the property type distribution in Chula Vista, House properties are the most common (69%), reflecting the local real estate landscape.
- Houses represent a significant 69% portion, catering likely to families or larger groups.
- The presence of 8.6% Hotel/Boutique listings indicates integration with traditional hospitality.
- Smaller segments like outdoor/unique (combined 2.2%) offer potential for unique stay experiences.
Chula Vista Airbnb Room Capacity Analysis (2026): Bedroom Distribution
Distribution of Listings by Number of Bedrooms
Room Capacity Insights for Chula Vista
- The dominant room capacity in Chula Vista is 3 bedrooms listings, making up 21.6% of the market. This suggests a strong demand for properties suitable for families or small groups.
- Together, 3 bedrooms and 1 bedroom properties represent 42.7% of the active Airbnb listings in Chula Vista, indicating a high concentration in these sizes.
- A significant 39.7% of listings offer 3+ bedrooms, catering to larger groups and families seeking more space in Chula Vista.
Chula Vista Vacation Rental Guest Capacity Trends (2026)
Distribution of Listings by Guest Capacity
Guest Capacity Insights for Chula Vista
- The most common guest capacity trend in Chula Vista vacation rentals is listings accommodating 8+ guests (30.6%). This suggests the primary traveler segment is likely larger groups.
- Properties designed for 8+ guests and 6 guests dominate the Chula Vista STR market, accounting for 47.8% of listings.
- 48.7% of properties accommodate 6+ guests, serving the market segment for larger families or group travel in Chula Vista.
- On average, properties in Chula Vista are equipped to host 4.5 guests.
Chula Vista Airbnb Booking Patterns (2026): Available vs. Booked Days
Available Days Distribution
Booked Days Distribution
Booking Pattern Insights for Chula Vista
- The most common availability pattern in Chula Vista falls within the 181-270 days range, representing 34.9% of listings. This suggests many properties have significant open periods on their calendars.
- Approximately 66.4% of listings show high availability (181+ days open annually), indicating potential for increased bookings or specific owner usage patterns.
- For booked days, the 91-180 days range is most frequent in Chula Vista (36.2%), reflecting common guest stay durations or potential owner blocking patterns.
- A notable 34.1% of properties secure long booking periods (181+ days booked per year), highlighting successful long-term rental strategies or significant owner usage.
Chula Vista Airbnb Minimum Stay Requirements Analysis
Distribution of Listings by Minimum Night Requirement
1 Night
36 listings
15.5% of total
2 Nights
37 listings
15.9% of total
3 Nights
6 listings
2.6% of total
4-6 Nights
17 listings
7.3% of total
7-29 Nights
26 listings
11.2% of total
30+ Nights
110 listings
47.4% of total
Key Insights
- The most prevalent minimum stay requirement in Chula Vista is 30+ Nights, adopted by 47.4% of listings. This highlights the market's preference for longer commitments.
- A significant segment (47.4%) caters to monthly stays (30+ nights) in Chula Vista, pointing to opportunities in the extended-stay market.
Recommendations
- Align with the market by considering a 30+ Nights minimum stay, as 47.4% of Chula Vista hosts use this setting.
- If feasible, allowing 1-night stays, especially midweek or during low season, could capture last-minute bookings, as only 15.5% currently do.
- Explore offering discounts for stays of 30+ nights to attract the 47.4% of the market seeking extended stays.
- Adjust minimum nights based on seasonality – potentially shorter during low season and longer during peak demand periods in Chula Vista.
Chula Vista Airbnb Cancellation Policy Trends Analysis (2026)
Limited
4 listings
1.7% of total
Flexible
49 listings
21.1% of total
Moderate
51 listings
22% of total
Firm
79 listings
34.1% of total
Strict
49 listings
21.1% of total
Cancellation Policy Insights for Chula Vista
- The prevailing Airbnb cancellation policy trend in Chula Vista is Firm, used by 34.1% of listings.
- A majority (55.2%) of hosts in Chula Vista utilize Firm or Strict policies, indicating a market where hosts prioritize booking security.
Recommendations for Hosts
- Consider adopting a Firm policy to align with the 34.1% market standard in Chula Vista.
- Regularly review your cancellation policy against competitors and market demand shifts in Chula Vista.
Chula Vista STR Booking Lead Time Analysis (2026)
Average Booking Lead Time by Month
Booking Lead Time Insights for Chula Vista
- The overall average booking lead time for vacation rentals in Chula Vista is 34 days.
- Guests book furthest in advance for stays during July (average 47 days), likely coinciding with peak travel demand or local events.
- The shortest booking windows occur for stays in February (average 25 days), indicating more last-minute travel plans during this time.
- Seasonally, Summer (42 days avg.) sees the longest lead times, while Spring (29 days avg.) has the shortest, reflecting typical travel planning cycles.
Recommendations for Hosts
- Use the overall average lead time (34 days) as a baseline for your pricing and availability strategy in Chula Vista.
- For July stays, consider implementing length-of-stay discounts or slightly higher rates for bookings made less than 47 days out to capitalize on advance planning.
- Target marketing efforts for the Summer season well in advance (at least 42 days) to capture early planners.
- Monitor your own booking lead times against these Chula Vista averages to identify opportunities for dynamic pricing adjustments.
Popular & Essential Airbnb Amenities in Chula Vista (2026)
Amenity Prevalence
Amenity Insights for Chula Vista
- Essential amenities in Chula Vista that guests expect include: Wifi, Smoke alarm, TV, Carbon monoxide alarm. Lacking these (any) could significantly impact bookings.
- Popular amenities like Hot water, Heating, Hangers are common but not universal. Offering these can provide a competitive edge.
Recommendations for Hosts
- Ensure your listing includes all essential amenities for Chula Vista: Wifi, Smoke alarm, TV, Carbon monoxide alarm.
- Prioritize adding missing essentials: Wifi, Smoke alarm, TV, Carbon monoxide alarm.
- Consider adding popular differentiators like Hot water or Heating to increase appeal.
- Highlight unique or less common amenities you offer (e.g., hot tub, dedicated workspace, EV charger) in your listing description and photos.
- Regularly check competitor amenities in Chula Vista to stay competitive.
Chula Vista Airbnb Guest Demographics & Profile Analysis (2026)
Guest Profile Summary for Chula Vista
- The typical guest profile for Airbnb in Chula Vista consists of primarily domestic travelers (88%), often arriving from nearby San Diego, typically belonging to the Post-2000s (Gen Z/Alpha) group (50%), primarily speaking English or Spanish.
- Domestic travelers account for 88.4% of guests.
- Key international markets include United States (88.4%) and Mexico (5.6%).
- Top languages spoken are English (58.7%) followed by Spanish (26.2%).
- A significant demographic segment is the Post-2000s (Gen Z/Alpha) group, representing 50% of guests.
Recommendations for Hosts
- Target domestic marketing efforts towards travelers from San Diego and Los Angeles.
- Tailor amenities and listing descriptions to appeal to the dominant Post-2000s (Gen Z/Alpha) demographic (e.g., highlight fast WiFi, smart home features, local guides).
- Highlight unique local experiences or amenities relevant to the primary guest profile.
- Consider seasonal promotions aligned with peak travel times for key origin markets.
Nearby Short-Term Rental Market Comparison
How does the Chula Vista Airbnb market stack up against its neighbors? Compare key performance metrics like average monthly revenue, ADR, and occupancy rates in surrounding areas to understand the broader regional STR landscape.
| Market | Active Properties | Monthly Revenue | Daily Rate | Avg. Occupancy |
|---|---|---|---|---|
| Newport Beach | 1,273 | $8,950 | $744.06 | 47% |
| Rancho San Diego | 25 | $8,649 | $568.72 | 48% |
| Thousand Palms | 33 | $8,119 | $725.48 | 36% |
| Manhattan Beach | 267 | $7,875 | $585.30 | 53% |
| Lakeside | 33 | $7,537 | $604.33 | 44% |
| GlenOak Hills | 41 | $7,394 | $648.65 | 41% |
| Bermuda Dunes | 143 | $7,324 | $664.90 | 39% |
| Mount Helix | 33 | $7,163 | $594.94 | 50% |
| Del Mar | 128 | $7,011 | $671.56 | 45% |
| Avalon | 249 | $6,705 | $696.60 | 38% |