Bakersfield Airbnb Market Analysis 2026: Short Term Rental Data & Vacation Rental Statistics in California, United States
Is Airbnb profitable in Bakersfield in 2026? Explore comprehensive Airbnb analytics for Bakersfield, California, United States to uncover income potential. This 2026 STR market report for Bakersfield, based on AirROI data from February 2025 to January 2026, reveals key trends in the market of 565 active listings.
Whether you're considering an Airbnb investment in Bakersfield, optimizing your existing vacation rental, or exploring rental arbitrage opportunities, understanding the Bakersfield Airbnb data is crucial. Leveraging the low regulation environment is key to maximizing your short term rental income potential. Let's dive into the specifics.
Key Bakersfield Airbnb Performance Metrics Overview
Monthly Airbnb Revenue Variations & Income Potential in Bakersfield (2026)
Understanding the monthly revenue variations for Airbnb listings in Bakersfield is key to maximizing your short term rental income potential. Seasonality significantly impacts earnings. Our analysis, based on data from the past 12 months, shows that the peak revenue month for STRs in Bakersfield is typically June, while January often presents the lowest earnings, highlighting opportunities for strategic pricing adjustments during shoulder and low seasons. Explore the typical Airbnb income in Bakersfield across different performance tiers:
- Best-in-class properties (Top 10%) achieve $5,359+ monthly, often utilizing dynamic pricing and superior guest experiences.
- Strong performing properties (Top 25%) earn $3,418 or more, indicating effective management and desirable locations/amenities.
- Typical properties (Median) generate around $1,892 per month, representing the average market performance.
- Entry-level properties (Bottom 25%) see earnings around $910, often with potential for optimization.
Average Monthly Airbnb Earnings Trend in Bakersfield
Bakersfield Airbnb Occupancy Rate Trends (2026)
Maximize your bookings by understanding the Bakersfield STR occupancy trends. Seasonal demand shifts significantly influence how often properties are booked. Typically, Februarysees the highest demand (peak season occupancy), while January experiences the lowest (low season). Effective strategies, like adjusting minimum stays or offering promotions, can boost occupancy during slower periods. Here's how different property tiers perform in Bakersfield:
- Best-in-class properties (Top 10%) achieve 82%+ occupancy, indicating high desirability and potentially optimized availability.
- Strong performing properties (Top 25%) maintain 66% or higher occupancy, suggesting good market fit and guest satisfaction.
- Typical properties (Median) have an occupancy rate around 46%.
- Entry-level properties (Bottom 25%) average 24% occupancy, potentially facing higher vacancy.
Average Monthly Occupancy Rate Trend in Bakersfield
Average Daily Rate (ADR) Airbnb Trends in Bakersfield (2026)
Effective short term rental pricing strategy in Bakersfield involves understanding monthly ADR fluctuations. The Average Daily Rate (ADR) for Airbnb in Bakersfield typically peaks in June and dips lowest during February. Leveraging Airbnb dynamic pricing tools or strategies based on this seasonality can significantly boost revenue. Here's a look at the typical nightly rates achieved:
- Best-in-class properties (Top 10%) command rates of $287+ per night, often due to premium features or locations.
- Strong performing properties (Top 25%) achieve nightly rates of $210 or more.
- Typical properties (Median) charge around $130 per night.
- Entry-level properties (Bottom 25%) earn around $79 per night.
Average Daily Rate (ADR) Trend by Month in Bakersfield
Get Live Bakersfield Market Intelligence 👇

Explore Real-time Analytics
Airbnb Seasonality Analysis & Trends in Bakersfield (2026)
Peak Season (June, July, May)
- Revenue averages $2,820 per month
- Occupancy rates average 47.9%
- Daily rates average $165
Shoulder Season
- Revenue averages $2,574 per month
- Occupancy maintains around 46.0%
- Daily rates hold near $162
Low Season (January, February, December)
- Revenue drops to average $2,003 per month
- Occupancy decreases to average 42.9%
- Daily rates adjust to average $157
Seasonality Insights for Bakersfield
- The Airbnb seasonality in Bakersfield shows moderate seasonality with distinct peak and low periods. While the sections above show seasonal averages, it's also insightful to look at the extremes:
- During the high season, the absolute peak month showcases Bakersfield's highest earning potential, with monthly revenues capable of climbing to $2,859, occupancy reaching a high of 51.8%, and ADRs peaking at $167.
- Conversely, the slowest single month of the year, typically falling within the low season, marks the market's lowest point. In this month, revenue might dip to $1,665, occupancy could drop to 35.0%, and ADRs may adjust down to $145.
- Understanding both the seasonal averages and these monthly peaks and troughs in revenue, occupancy, and ADR is crucial for maximizing your Airbnb profit potential in Bakersfield.
Seasonal Strategies for Maximizing Profit
- Peak Season: Maximize revenue through premium pricing and potentially longer minimum stays. Ensure high availability.
- Low Season: Offer competitive pricing, special promotions (e.g., extended stay discounts), and flexible cancellation policies. Target off-season travelers like remote workers or budget-conscious guests.
- Shoulder Seasons: Implement dynamic pricing that balances peak and low rates. Target weekend travelers or specific events. Offer slightly more flexible terms than peak season.
- Regularly analyze your own performance against these Bakersfield seasonality benchmarks and adjust your pricing and availability strategy accordingly.
Best Areas for Airbnb Investment in Bakersfield (2026)
Exploring the top neighborhoods for short-term rentals in Bakersfield? This section highlights key areas, outlining why they are attractive for hosts and guests, along with notable local attractions. Consider these locations based on your target guest profile and investment strategy.
| Neighborhood / Area | Why Host Here? (Target Guests & Appeal) | Key Attractions & Landmarks |
|---|---|---|
| Downtown Bakersfield | The urban center of Bakersfield with a vibrant arts scene, dining, and nightlife. It's a key area for visitors seeking convenience and access to events and attractions. | Fox Theater, Bakersfield Museum of Art, Rabobank Arena, Bakersfield Condors Hockey, Bakersfield Symphony Orchestra |
| Riverwalk | A picturesque area along the Kern River with beautiful parks, trails, and shopping. Ideal for families and outdoor enthusiasts. | Kern River Parkway Trail, Riverwalk Park, The Village at Riverwalk, Kern County Museum, The Marketplace |
| Seven Oaks | An upscale residential neighborhood offering a tranquil atmosphere with luxury homes and access to top-notch amenities. Attracts travelers looking for comfort and leisure. | Seven Oaks Country Club, The Oaks Mall, Coffee shops and restaurants, Parks and recreational areas |
| Northwest Bakersfield | A growing residential and commercial area with many attractions for families and leisure seekers. Suitable for longer stays and local experiences. | Kern Canyon, Northwest Promenade, Local Parks, Shopping Centers |
| East Bakersfield | A mix of local charm and cultural sites, perfect for those interested in the history and culture of Bakersfield. | Buena Vista Museum of Natural History, Hart Park, Local Restaurants, Cultural shops |
| Stockdale Estates | An affluent community that provides a quiet environment and is suitable for travelers looking for a peaceful retreat close to amenities. | Shopping Centers, Parks, Dining Options |
| West Bakersfield | A vibrant area with a mix of commercial and residential zones where travelers can find various dining, shopping, and entertainment options. | Local Dining, Entertainment Venues, Parks |
| College Heights | In proximity to California State University, Bakersfield, this area attracts students and their families, providing convenient housing options. | University Events, Parks, Local Cafes |
Understanding Airbnb License Requirements & STR Laws in Bakersfield (2026)
While Bakersfield, California, United States currently shows low STR regulations, specific Airbnb license requirements might still exist or change. Always verify the latest short term rental regulations and Airbnb license requirements directly with local government authorities for Bakersfield to ensure full compliance before hosting.
(Source: AirROI data, 2026, based on 0% licensed listings)
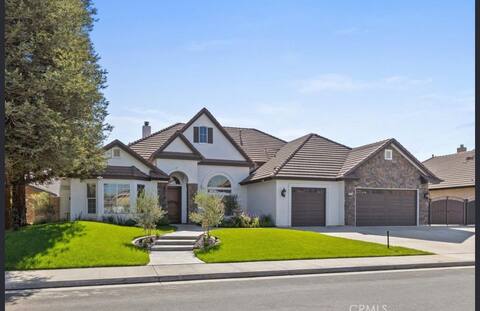
Top Performing Airbnb Properties in Bakersfield (2026)
Benchmark your potential! Explore examples of top-performing Airbnb properties in Bakersfieldbased on Trailing Twelve Month (TTM) revenue. Analyze their characteristics, revenue, occupancy rate, and ADR to understand what drives success in this market.
Dream House, With Pool
Entire Place • 4 bedrooms

550 Mbps • Ideal for Work & Business
Entire Place • 3 bedrooms

Ultimate 5BR Bakersfield Stay: Pool/Hot Tub & More
Entire Place • 5 bedrooms
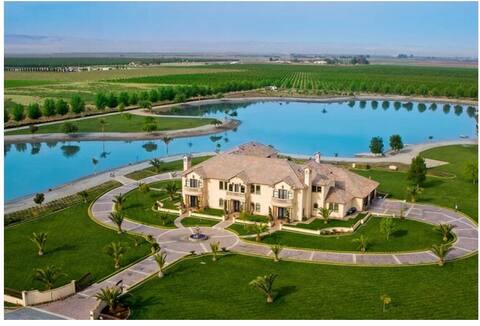
Vista Del Lago: Lake, Pool, Spa and more!
Entire Place • 5 bedrooms

Exquisite Retreat: Luxury Home
Entire Place • 5 bedrooms

500 Mbps • Quiet Cul-de-Sac • Top Neighborhood
Entire Place • 3 bedrooms
Note: Performance varies based on location, size, amenities, seasonality, and management quality. Data reflects the past 12 months.
Top Performing Airbnb Hosts in Bakersfield (2026)
Learn from the best! This table showcases top-performing Airbnb hosts in Bakersfield based on the number of properties managed and estimated total revenue over the past year. Analyze their scale and performance metrics.
| Host Name | Properties | Grossing Revenue | Stay Reviews | Avg Rating |
|---|---|---|---|---|
| Jonathan | 6 | $485,242 | 477 | 4.91/5.0 |
| Laura | 8 | $274,037 | 342 | 4.90/5.0 |
| Aaron | 4 | $264,070 | 456 | 4.85/5.0 |
| K S | 7 | $242,726 | 129 | 4.94/5.0 |
| Eiji | 14 | $208,876 | 421 | 4.88/5.0 |
| Nasirat | 8 | $170,121 | 169 | 4.97/5.0 |
| Evolve | 7 | $160,981 | 95 | 4.82/5.0 |
| Wilson | 2 | $147,725 | 143 | 4.82/5.0 |
| Nader | 3 | $135,690 | 334 | 4.98/5.0 |
| Victor | 2 | $133,009 | 154 | 4.95/5.0 |
Analyzing the strategies of top hosts, such as their property selection, pricing, and guest communication, can offer valuable lessons for optimizing your own Airbnb operations in Bakersfield.
Dive Deeper: Advanced Bakersfield STR Market Data (2026)
Ready to unlock more insights? AirROI provides access to advanced metrics and comprehensive Airbnb data for Bakersfield. Explore detailed analytics beyond this report to refine your investment strategy, optimize pricing, and maximize your vacation rental profits.
Explore Advanced MetricsBakersfield Short-Term Rental Market Composition (2026): Property & Room Types
Room Type Distribution
Property Type Distribution
Market Composition Insights for Bakersfield
- The Bakersfield Airbnb market composition is heavily skewed towards Entire Home/Apt listings, which make up 79.8% of the 565 active rentals. This indicates strong guest preference for privacy and space.
- Looking at the property type distribution in Bakersfield, House properties are the most common (72.2%), reflecting the local real estate landscape.
- Houses represent a significant 72.2% portion, catering likely to families or larger groups.
- The presence of 8.3% Hotel/Boutique listings indicates integration with traditional hospitality.
- Smaller segments like others, outdoor/unique, unique stays (combined 5.5%) offer potential for unique stay experiences.
Bakersfield Airbnb Room Capacity Analysis (2026): Bedroom Distribution
Distribution of Listings by Number of Bedrooms
Room Capacity Insights for Bakersfield
- The dominant room capacity in Bakersfield is 3 bedrooms listings, making up 21.1% of the market. This suggests a strong demand for properties suitable for families or small groups.
- Together, 3 bedrooms and 4 bedrooms properties represent 39.9% of the active Airbnb listings in Bakersfield, indicating a high concentration in these sizes.
- A significant 44.7% of listings offer 3+ bedrooms, catering to larger groups and families seeking more space in Bakersfield.
Bakersfield Vacation Rental Guest Capacity Trends (2026)
Distribution of Listings by Guest Capacity
Guest Capacity Insights for Bakersfield
- The most common guest capacity trend in Bakersfield vacation rentals is listings accommodating 8+ guests (27.4%). This suggests the primary traveler segment is likely larger groups.
- Properties designed for 8+ guests and 6 guests dominate the Bakersfield STR market, accounting for 43.5% of listings.
- 47.2% of properties accommodate 6+ guests, serving the market segment for larger families or group travel in Bakersfield.
- On average, properties in Bakersfield are equipped to host 4.5 guests.
Bakersfield Airbnb Booking Patterns (2026): Available vs. Booked Days
Available Days Distribution
Booked Days Distribution
Booking Pattern Insights for Bakersfield
- The most common availability pattern in Bakersfield falls within the 271-366 days range, representing 43.5% of listings. This suggests many properties have significant open periods on their calendars.
- Approximately 75.2% of listings show high availability (181+ days open annually), indicating potential for increased bookings or specific owner usage patterns.
- For booked days, the 91-180 days range is most frequent in Bakersfield (31.3%), reflecting common guest stay durations or potential owner blocking patterns.
- A notable 26.7% of properties secure long booking periods (181+ days booked per year), highlighting successful long-term rental strategies or significant owner usage.
Bakersfield Airbnb Minimum Stay Requirements Analysis
Distribution of Listings by Minimum Night Requirement
1 Night
197 listings
34.9% of total
2 Nights
125 listings
22.1% of total
3 Nights
40 listings
7.1% of total
4-6 Nights
30 listings
5.3% of total
7-29 Nights
80 listings
14.2% of total
30+ Nights
93 listings
16.5% of total
Key Insights
- The most prevalent minimum stay requirement in Bakersfield is 1 Night, adopted by 34.9% of listings. This highlights the market's preference for shorter, flexible bookings.
- A significant segment (16.5%) caters to monthly stays (30+ nights) in Bakersfield, pointing to opportunities in the extended-stay market.
Recommendations
- Align with the market by considering a 1 Night minimum stay, as 34.9% of Bakersfield hosts use this setting.
- Explore offering discounts for stays of 30+ nights to attract the 16.5% of the market seeking extended stays.
- Adjust minimum nights based on seasonality – potentially shorter during low season and longer during peak demand periods in Bakersfield.
Bakersfield Airbnb Cancellation Policy Trends Analysis (2026)
Super Strict 30 Days
1 listings
0.2% of total
Super Strict 60 Days
3 listings
0.5% of total
Limited
7 listings
1.2% of total
Flexible
175 listings
31% of total
Moderate
142 listings
25.2% of total
Firm
155 listings
27.5% of total
Strict
81 listings
14.4% of total
Cancellation Policy Insights for Bakersfield
- The prevailing Airbnb cancellation policy trend in Bakersfield is Flexible, used by 31% of listings.
- There's a relatively balanced mix between guest-friendly (56.2%) and stricter (41.9%) policies, offering choices for different guest needs.
Recommendations for Hosts
- Consider adopting a Flexible policy to align with the 31% market standard in Bakersfield.
- Using a Strict policy might deter some guests, as only 14.4% of listings use it. Evaluate if potential revenue protection outweighs possible lower booking rates.
- Regularly review your cancellation policy against competitors and market demand shifts in Bakersfield.
Bakersfield STR Booking Lead Time Analysis (2026)
Average Booking Lead Time by Month
Booking Lead Time Insights for Bakersfield
- The overall average booking lead time for vacation rentals in Bakersfield is 22 days.
- Guests book furthest in advance for stays during July (average 31 days), likely coinciding with peak travel demand or local events.
- The shortest booking windows occur for stays in March (average 16 days), indicating more last-minute travel plans during this time.
- Seasonally, Summer (26 days avg.) sees the longest lead times, while Winter (20 days avg.) has the shortest, reflecting typical travel planning cycles.
Recommendations for Hosts
- Use the overall average lead time (22 days) as a baseline for your pricing and availability strategy in Bakersfield.
- Target marketing efforts for the Summer season well in advance (at least 26 days) to capture early planners.
- Monitor your own booking lead times against these Bakersfield averages to identify opportunities for dynamic pricing adjustments.
Popular & Essential Airbnb Amenities in Bakersfield (2026)
Amenity Prevalence
Amenity Insights for Bakersfield
- Essential amenities in Bakersfield that guests expect include: Wifi, Air conditioning, Smoke alarm, TV, Carbon monoxide alarm. Lacking these (any) could significantly impact bookings.
- Popular amenities like Heating, Hot water, Free parking on premises are common but not universal. Offering these can provide a competitive edge.
Recommendations for Hosts
- Ensure your listing includes all essential amenities for Bakersfield: Wifi, Air conditioning, Smoke alarm, TV, Carbon monoxide alarm.
- Prioritize adding missing essentials: Wifi, Air conditioning, Smoke alarm, TV, Carbon monoxide alarm.
- Consider adding popular differentiators like Heating or Hot water to increase appeal.
- Highlight unique or less common amenities you offer (e.g., hot tub, dedicated workspace, EV charger) in your listing description and photos.
- Regularly check competitor amenities in Bakersfield to stay competitive.
Bakersfield Airbnb Guest Demographics & Profile Analysis (2026)
Guest Profile Summary for Bakersfield
- The typical guest profile for Airbnb in Bakersfield consists of primarily domestic travelers (93%), often arriving from nearby Los Angeles, typically belonging to the Post-2000s (Gen Z/Alpha) group (50%), primarily speaking English or Spanish.
- Domestic travelers account for 93.4% of guests.
- Key international markets include United States (93.4%) and United Kingdom (0.9%).
- Top languages spoken are English (62.2%) followed by Spanish (23.3%).
- A significant demographic segment is the Post-2000s (Gen Z/Alpha) group, representing 50% of guests.
Recommendations for Hosts
- Target domestic marketing efforts towards travelers from Los Angeles and Bakersfield.
- Tailor amenities and listing descriptions to appeal to the dominant Post-2000s (Gen Z/Alpha) demographic (e.g., highlight fast WiFi, smart home features, local guides).
- Highlight unique local experiences or amenities relevant to the primary guest profile.
- Consider seasonal promotions aligned with peak travel times for key origin markets.
Nearby Short-Term Rental Market Comparison
How does the Bakersfield Airbnb market stack up against its neighbors? Compare key performance metrics like average monthly revenue, ADR, and occupancy rates in surrounding areas to understand the broader regional STR landscape.
| Market | Active Properties | Monthly Revenue | Daily Rate | Avg. Occupancy |
|---|---|---|---|---|
| Montecito | 127 | $10,744 | $950.35 | 51% |
| Malibu | 251 | $8,293 | $1263.89 | 35% |
| Los Olivos | 30 | $7,240 | $705.20 | 43% |
| Santa Ynez | 119 | $6,967 | $589.34 | 42% |
| Toro Canyon | 33 | $6,935 | $717.58 | 42% |
| Avila Beach | 94 | $6,770 | $582.34 | 41% |
| Summerland | 88 | $6,323 | $494.72 | 49% |
| Unincorporated Santa Monica Mountains | 119 | $6,008 | $699.60 | 38% |
| Santa Paula | 17 | $5,685 | $502.58 | 47% |
| Buellton | 24 | $5,667 | $476.40 | 40% |