Lake Hamilton Township Airbnb Market Analysis 2025: Short Term Rental Data & Vacation Rental Statistics in Arkansas, United States
Is Airbnb profitable in Lake Hamilton Township in 2025? Explore comprehensive Airbnb analytics for Lake Hamilton Township, Arkansas, United States to uncover income potential. This 2025 STR market report for Lake Hamilton Township, based on AirROI data from April 2024 to March 2025, reveals key trends in the niche market of 19 active listings.
Whether you're considering an Airbnb investment in Lake Hamilton Township, optimizing your existing vacation rental, or exploring rental arbitrage opportunities, understanding the Lake Hamilton Township Airbnb data is crucial. Leveraging the low regulation environment is key to maximizing your short term rental income potential. Let's dive into the specifics.
Key Lake Hamilton Township Airbnb Performance Metrics Overview
Monthly Airbnb Revenue Variations & Income Potential in Lake Hamilton Township (2025)
Understanding the monthly revenue variations for Airbnb listings in Lake Hamilton Township is key to maximizing your short term rental income potential. Seasonality significantly impacts earnings. Our analysis, based on data from the past 12 months, shows that the peak revenue month for STRs in Lake Hamilton Township is typically July, while February often presents the lowest earnings, highlighting opportunities for strategic pricing adjustments during shoulder and low seasons. Explore the typical Airbnb income in Lake Hamilton Township across different performance tiers:
- Best-in-class properties (Top 10%) achieve $5,581+ monthly, often utilizing dynamic pricing and superior guest experiences.
- Strong performing properties (Top 25%) earn $2,867 or more, indicating effective management and desirable locations/amenities.
- Typical properties (Median) generate around $1,587 per month, representing the average market performance.
- Entry-level properties (Bottom 25%) see earnings around $971, often with potential for optimization.
Average Monthly Airbnb Earnings Trend in Lake Hamilton Township
Lake Hamilton Township Airbnb Occupancy Rate Trends (2025)
Maximize your bookings by understanding the Lake Hamilton Township STR occupancy trends. Seasonal demand shifts significantly influence how often properties are booked. Typically, Julysees the highest demand (peak season occupancy), while January experiences the lowest (low season). Effective strategies, like adjusting minimum stays or offering promotions, can boost occupancy during slower periods. Here's how different property tiers perform in Lake Hamilton Township:
- Best-in-class properties (Top 10%) achieve 65%+ occupancy, indicating high desirability and potentially optimized availability.
- Strong performing properties (Top 25%) maintain 54% or higher occupancy, suggesting good market fit and guest satisfaction.
- Typical properties (Median) have an occupancy rate around 37%.
- Entry-level properties (Bottom 25%) average 23% occupancy, potentially facing higher vacancy.
Average Monthly Occupancy Rate Trend in Lake Hamilton Township
Average Daily Rate (ADR) Airbnb Trends in Lake Hamilton Township (2025)
Effective short term rental pricing strategy in Lake Hamilton Township involves understanding monthly ADR fluctuations. The Average Daily Rate (ADR) for Airbnb in Lake Hamilton Township typically peaks in June and dips lowest during February. Leveraging Airbnb dynamic pricing tools or strategies based on this seasonality can significantly boost revenue. Here's a look at the typical nightly rates achieved:
- Best-in-class properties (Top 10%) command rates of $409+ per night, often due to premium features or locations.
- Strong performing properties (Top 25%) achieve nightly rates of $219 or more.
- Typical properties (Median) charge around $166 per night.
- Entry-level properties (Bottom 25%) earn around $102 per night.
Average Daily Rate (ADR) Trend by Month in Lake Hamilton Township
Get Live Lake Hamilton Township Market Intelligence 👇

Explore Real-time Analytics
Airbnb Seasonality Analysis & Trends in Lake Hamilton Township (2025)
Peak Season (July, June, August)
- Revenue averages $3,979 per month
- Occupancy rates average 52.0%
- Daily rates average $222
Shoulder Season
- Revenue averages $2,290 per month
- Occupancy maintains around 38.8%
- Daily rates hold near $207
Low Season (January, February, November)
- Revenue drops to average $1,293 per month
- Occupancy decreases to average 25.8%
- Daily rates adjust to average $197
Seasonality Insights for Lake Hamilton Township
- The Airbnb seasonality in Lake Hamilton Township shows highly seasonal trends requiring careful strategy. While the sections above show seasonal averages, it's also insightful to look at the extremes:
- During the high season, the absolute peak month showcases Lake Hamilton Township's highest earning potential, with monthly revenues capable of climbing to $4,735, occupancy reaching a high of 62.0%, and ADRs peaking at $229.
- Conversely, the slowest single month of the year, typically falling within the low season, marks the market's lowest point. In this month, revenue might dip to $1,059, occupancy could drop to 20.2%, and ADRs may adjust down to $190.
- Understanding both the seasonal averages and these monthly peaks and troughs in revenue, occupancy, and ADR is crucial for maximizing your Airbnb profit potential in Lake Hamilton Township.
Seasonal Strategies for Maximizing Profit
- Peak Season: Maximize revenue through premium pricing and potentially longer minimum stays. Ensure high availability.
- Low Season: Offer competitive pricing, special promotions (e.g., extended stay discounts), and flexible cancellation policies. Target off-season travelers like remote workers or budget-conscious guests.
- Shoulder Seasons: Implement dynamic pricing that balances peak and low rates. Target weekend travelers or specific events. Offer slightly more flexible terms than peak season.
- Regularly analyze your own performance against these Lake Hamilton Township seasonality benchmarks and adjust your pricing and availability strategy accordingly.
Best Areas for Airbnb Investment in Lake Hamilton Township (2025)
Exploring the top neighborhoods for short-term rentals in Lake Hamilton Township? This section highlights key areas, outlining why they are attractive for hosts and guests, along with notable local attractions. Consider these locations based on your target guest profile and investment strategy.
| Neighborhood / Area | Why Host Here? (Target Guests & Appeal) | Key Attractions & Landmarks |
|---|---|---|
| Lakefront Area | Scenic views of Lake Hamilton with direct access to water activities. A popular spot for families and vacationers looking to relax by the lake. | Lake Hamilton, St. Joseph's Chapel, Garvan Woodland Gardens, Hot Springs State Park, Lake Catherine State Park |
| Downtown Hot Springs | Vibrant area with historic bathhouses, restaurants, and shops. Attracts visitors looking for a mix of relaxation and entertainment. | Bathhouse Row, Hot Springs National Park, Gangster Museum of America, Fordyce Bathhouse, Historic downtown shops |
| Hot Springs Village | A private community with various amenities, including lakes, golf courses, and outdoor activities. Attractive to retirees and families seeking a peaceful getaway. | Lake Estrella, Ponce De Leon Center, Various golf courses, Nature trails, Community events |
| Piney Point | Quiet residential area with proximity to Lake Hamilton and boat access. Ideal for travelers seeking a serene retreat close to nature. | Lake Hamilton, Piney Point boat ramp, Nature walks, Fishing spots |
| Mount Ida | Gateway to the Ouachita National Forest and a hub for outdoor enthusiasts. Ideal for adventure seekers and nature lovers. | Ouachita National Forest, Wine Country, Cossatot River, Crater of Diamonds State Park, Lake Greeson |
| Cedar Glades | A serene area with hiking opportunities and access to Hot Springs. Great for travelers looking for outdoor activities and tranquility. | Cedar Glades Park, Hot Springs hiking trails, Nature viewing, Wildlife |
| Malvern | Small town charm with diverse attractions nearby. Provides a quieter alternative for visitors wanting to explore the area around Hot Springs. | Malvern Brickfest, Malvern Water Park, Local dining, Art galleries |
| Jessieville | Scenic rural area ideal for those who appreciate peace and nature. Attracts families and individuals looking for a rustic getaway. | Lake Ouachita, Ouachita National Forest hiking trails, Camping spots, Wildlife watching |
Understanding Airbnb License Requirements & STR Laws in Lake Hamilton Township (2025)
While Lake Hamilton Township, Arkansas, United States currently shows low STR regulations, specific Airbnb license requirements might still exist or change. Always verify the latest short term rental regulations and Airbnb license requirements directly with local government authorities for Lake Hamilton Township to ensure full compliance before hosting.
(Source: AirROI data, 2025, finding no licensed listings among those analyzed)
Top Performing Airbnb Properties in Lake Hamilton Township (2025)
Benchmark your potential! Explore examples of top-performing Airbnb properties in Lake Hamilton Townshipbased on Trailing Twelve Month (TTM) revenue. Analyze their characteristics, revenue, occupancy rate, and ADR to understand what drives success in this market.
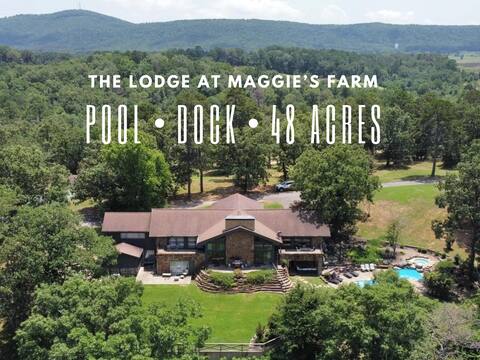
Lake Hamilton,Private 48 Acres,Pool,Sleeps23 or 39
Entire Place • 6 bedrooms

Cloud Nine-Breathtaking views of Hot Springs area
Entire Place • 3 bedrooms

Hideaway Cove, Lakefront retreat on Lake Hamilton
Entire Place • 5 bedrooms
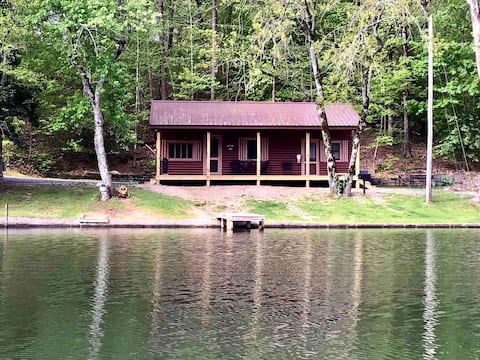
SMITH LAKEFRONT CABIN PETS WELCOME(small fee)
Entire Place • 2 bedrooms
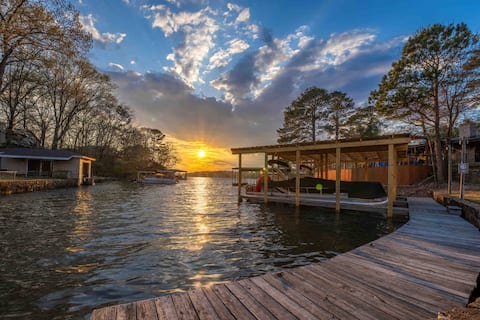
Lake FRONT, Private Dock Access & Kayaks!
Entire Place • 3 bedrooms

Holiday fun awaits Hot Springs
Entire Place • 1 bedroom
Note: Performance varies based on location, size, amenities, seasonality, and management quality. Data reflects the past 12 months.
Top Performing Airbnb Hosts in Lake Hamilton Township (2025)
Learn from the best! This table showcases top-performing Airbnb hosts in Lake Hamilton Township based on the number of properties managed and estimated total revenue over the past year. Analyze their scale and performance metrics.
| Host Name | Properties | Grossing Revenue | Stay Reviews | Avg Rating |
|---|---|---|---|---|
| Leslie | 1 | $125,740 | 40 | 4.80/5.0 |
| Marcia | 1 | $52,851 | 460 | 4.93/5.0 |
| Aimee | 1 | $46,251 | 89 | 4.97/5.0 |
| Sharon | 1 | $38,482 | 208 | 4.88/5.0 |
| Derek | 2 | $26,850 | 882 | 4.92/5.0 |
| Adelyn | 1 | $25,670 | 55 | 4.93/5.0 |
| Hollie | 1 | $25,221 | 169 | 4.99/5.0 |
| Julia | 1 | $24,935 | 65 | 4.89/5.0 |
| Evolve | 1 | $23,892 | 40 | 4.78/5.0 |
| Rose | 3 | $21,609 | 228 | 4.93/5.0 |
Analyzing the strategies of top hosts, such as their property selection, pricing, and guest communication, can offer valuable lessons for optimizing your own Airbnb operations in Lake Hamilton Township.
Dive Deeper: Advanced Lake Hamilton Township STR Market Data (2025)
Ready to unlock more insights? AirROI provides access to advanced metrics and comprehensive Airbnb data for Lake Hamilton Township. Explore detailed analytics beyond this report to refine your investment strategy, optimize pricing, and maximize your vacation rental profits.
Explore Advanced MetricsLake Hamilton Township Short-Term Rental Market Composition (2025): Property & Room Types
Room Type Distribution
Property Type Distribution
Market Composition Insights for Lake Hamilton Township
- The Lake Hamilton Township Airbnb market composition is heavily skewed towards Entire Home/Apt listings, which make up 84.2% of the 19 active rentals. This indicates strong guest preference for privacy and space.
- Looking at the property type distribution in Lake Hamilton Township, House properties are the most common (47.4%), reflecting the local real estate landscape.
- Houses represent a significant 47.4% portion, catering likely to families or larger groups.
- The presence of 15.8% Hotel/Boutique listings indicates integration with traditional hospitality.
Lake Hamilton Township Airbnb Room Capacity Analysis (2025): Bedroom Distribution
Distribution of Listings by Number of Bedrooms
Room Capacity Insights for Lake Hamilton Township
- The dominant room capacity in Lake Hamilton Township is 3 bedrooms listings, making up 26.3% of the market. This suggests a strong demand for properties suitable for families or small groups.
- Together, 3 bedrooms and 2 bedrooms properties represent 47.4% of the active Airbnb listings in Lake Hamilton Township, indicating a high concentration in these sizes.
- A significant 42.1% of listings offer 3+ bedrooms, catering to larger groups and families seeking more space in Lake Hamilton Township.
Lake Hamilton Township Vacation Rental Guest Capacity Trends (2025)
Distribution of Listings by Guest Capacity
Guest Capacity Insights for Lake Hamilton Township
- The most common guest capacity trend in Lake Hamilton Township vacation rentals is listings accommodating 8+ guests (36.8%). This suggests the primary traveler segment is likely larger groups.
- Properties designed for 8+ guests and 3 guests dominate the Lake Hamilton Township STR market, accounting for 47.3% of listings.
- 52.6% of properties accommodate 6+ guests, serving the market segment for larger families or group travel in Lake Hamilton Township.
- On average, properties in Lake Hamilton Township are equipped to host 5.2 guests.
Lake Hamilton Township Airbnb Booking Patterns (2025): Available vs. Booked Days
Available Days Distribution
Booked Days Distribution
Booking Pattern Insights for Lake Hamilton Township
- The most common availability pattern in Lake Hamilton Township falls within the 181-270 days range, representing 52.6% of listings. This suggests many properties have significant open periods on their calendars.
- Approximately 84.2% of listings show high availability (181+ days open annually), indicating potential for increased bookings or specific owner usage patterns.
- For booked days, the 91-180 days range is most frequent in Lake Hamilton Township (57.9%), reflecting common guest stay durations or potential owner blocking patterns.
- A notable 15.8% of properties secure long booking periods (181+ days booked per year), highlighting successful long-term rental strategies or significant owner usage.
Lake Hamilton Township Airbnb Minimum Stay Requirements Analysis
Distribution of Listings by Minimum Night Requirement
1 Night
6 listings
33.3% of total
2 Nights
10 listings
55.6% of total
3 Nights
2 listings
11.1% of total
Key Insights
- The most prevalent minimum stay requirement in Lake Hamilton Township is 2 Nights, adopted by 55.6% of listings. This highlights the market's preference for shorter, flexible bookings.
- A strong majority (88.9%) of the Lake Hamilton Township Airbnb data shows acceptance of very short stays (1-2 nights), indicating a dynamic, high-turnover market.
Recommendations
- Align with the market by considering a 2 Nights minimum stay, as 55.6% of Lake Hamilton Township hosts use this setting.
- Adjust minimum nights based on seasonality – potentially shorter during low season and longer during peak demand periods in Lake Hamilton Township.
Lake Hamilton Township Airbnb Cancellation Policy Trends Analysis (2025)
Flexible
2 listings
10.5% of total
Moderate
5 listings
26.3% of total
Firm
1 listings
5.3% of total
Strict
11 listings
57.9% of total
Cancellation Policy Insights for Lake Hamilton Township
- The prevailing Airbnb cancellation policy trend in Lake Hamilton Township is Strict, used by 57.9% of listings.
- A majority (63.2%) of hosts in Lake Hamilton Township utilize Firm or Strict policies, indicating a market where hosts prioritize booking security.
Recommendations for Hosts
- Consider adopting a Strict policy to align with the 57.9% market standard in Lake Hamilton Township.
- With 57.9% using Strict terms, this is a viable option in Lake Hamilton Township, particularly for high-value properties or during peak demand periods.
- Regularly review your cancellation policy against competitors and market demand shifts in Lake Hamilton Township.
Lake Hamilton Township STR Booking Lead Time Analysis (2025)
Average Booking Lead Time by Month
Booking Lead Time Insights for Lake Hamilton Township
- The overall average booking lead time for vacation rentals in Lake Hamilton Township is 46 days.
- Guests book furthest in advance for stays during April (average 75 days), likely coinciding with peak travel demand or local events.
- The shortest booking windows occur for stays in January (average 19 days), indicating more last-minute travel plans during this time.
- Seasonally, Summer (57 days avg.) sees the longest lead times, while Winter (20 days avg.) has the shortest, reflecting typical travel planning cycles.
Recommendations for Hosts
- Use the overall average lead time (46 days) as a baseline for your pricing and availability strategy in Lake Hamilton Township.
- For April stays, consider implementing length-of-stay discounts or slightly higher rates for bookings made less than 75 days out to capitalize on advance planning.
- Target marketing efforts for the Summer season well in advance (at least 57 days) to capture early planners.
- Monitor your own booking lead times against these Lake Hamilton Township averages to identify opportunities for dynamic pricing adjustments.
Popular & Essential Airbnb Amenities in Lake Hamilton Township (2025)
Amenity Prevalence
Amenity Insights for Lake Hamilton Township
- Essential amenities in Lake Hamilton Township that guests expect include: Hot water, Air conditioning, TV, Smoke alarm. Lacking these (any) could significantly impact bookings.
- Popular amenities like Essentials, Free parking on premises, Heating are common but not universal. Offering these can provide a competitive edge.
- Warning: Wifi is not universally provided but is considered essential globally. Ensure reliable Wifi is offered.
Recommendations for Hosts
- Ensure your listing includes all essential amenities for Lake Hamilton Township: Hot water, Air conditioning, TV, Smoke alarm.
- Consider adding popular differentiators like Essentials or Free parking on premises to increase appeal.
- Highlight unique or less common amenities you offer (e.g., hot tub, dedicated workspace, EV charger) in your listing description and photos.
- Regularly check competitor amenities in Lake Hamilton Township to stay competitive.
Lake Hamilton Township Airbnb Guest Demographics & Profile Analysis (2025)
Guest Profile Summary for Lake Hamilton Township
- The typical guest profile for Airbnb in Lake Hamilton Township consists of primarily domestic travelers (98%), often arriving from nearby Dallas, typically belonging to the Post-2000s (Gen Z/Alpha) group (50%), primarily speaking English or Spanish.
- Domestic travelers account for 98.2% of guests.
- Key international markets include United States (98.2%) and United Kingdom (0.7%).
- Top languages spoken are English (83.6%) followed by Spanish (8.6%).
- A significant demographic segment is the Post-2000s (Gen Z/Alpha) group, representing 50% of guests.
Recommendations for Hosts
- Target domestic marketing efforts towards travelers from Dallas and Little Rock.
- Tailor amenities and listing descriptions to appeal to the dominant Post-2000s (Gen Z/Alpha) demographic (e.g., highlight fast WiFi, smart home features, local guides).
- Highlight unique local experiences or amenities relevant to the primary guest profile.
- Consider seasonal promotions aligned with peak travel times for key origin markets.
Nearby Short-Term Rental Market Comparison
How does the Lake Hamilton Township Airbnb market stack up against its neighbors? Compare key performance metrics like average monthly revenue, ADR, and occupancy rates in surrounding areas to understand the broader regional STR landscape.
| Market | Active Properties | Monthly Revenue | Daily Rate | Avg. Occupancy |
|---|---|---|---|---|
| Rockwell | 13 | $7,835 | $530.82 | 39% |
| McCurtain County | 78 | $5,102 | $445.84 | 39% |
| Broken Bow | 2,448 | $4,754 | $386.94 | 39% |
| Hochatown | 14 | $4,436 | $383.19 | 38% |
| Fountain Lake | 10 | $3,367 | $236.15 | 52% |
| Piney | 16 | $3,194 | $304.73 | 34% |
| Amity | 20 | $2,983 | $423.65 | 36% |
| broken bow | 13 | $2,898 | $467.10 | 23% |
| Pearcy | 14 | $2,877 | $187.10 | 49% |
| Lake Hamilton | 77 | $2,850 | $284.36 | 34% |