Bull Shoals Airbnb Market Analysis 2025: Short Term Rental Data & Vacation Rental Statistics in Arkansas, United States
Is Airbnb profitable in Bull Shoals in 2025? Explore comprehensive Airbnb analytics for Bull Shoals, Arkansas, United States to uncover income potential. This 2025 STR market report for Bull Shoals, based on AirROI data from April 2024 to March 2025, reveals key trends in the niche market of 19 active listings.
Whether you're considering an Airbnb investment in Bull Shoals, optimizing your existing vacation rental, or exploring rental arbitrage opportunities, understanding the Bull Shoals Airbnb data is crucial. Leveraging the low regulation environment is key to maximizing your short term rental income potential. Let's dive into the specifics.
Key Bull Shoals Airbnb Performance Metrics Overview
Monthly Airbnb Revenue Variations & Income Potential in Bull Shoals (2025)
Understanding the monthly revenue variations for Airbnb listings in Bull Shoals is key to maximizing your short term rental income potential. Seasonality significantly impacts earnings. Our analysis, based on data from the past 12 months, shows that the peak revenue month for STRs in Bull Shoals is typically June, while February often presents the lowest earnings, highlighting opportunities for strategic pricing adjustments during shoulder and low seasons. Explore the typical Airbnb income in Bull Shoals across different performance tiers:
- Best-in-class properties (Top 10%) achieve $3,443+ monthly, often utilizing dynamic pricing and superior guest experiences.
- Strong performing properties (Top 25%) earn $2,266 or more, indicating effective management and desirable locations/amenities.
- Typical properties (Median) generate around $1,433 per month, representing the average market performance.
- Entry-level properties (Bottom 25%) see earnings around $693, often with potential for optimization.
Average Monthly Airbnb Earnings Trend in Bull Shoals
Bull Shoals Airbnb Occupancy Rate Trends (2025)
Maximize your bookings by understanding the Bull Shoals STR occupancy trends. Seasonal demand shifts significantly influence how often properties are booked. Typically, Julysees the highest demand (peak season occupancy), while March experiences the lowest (low season). Effective strategies, like adjusting minimum stays or offering promotions, can boost occupancy during slower periods. Here's how different property tiers perform in Bull Shoals:
- Best-in-class properties (Top 10%) achieve 57%+ occupancy, indicating high desirability and potentially optimized availability.
- Strong performing properties (Top 25%) maintain 43% or higher occupancy, suggesting good market fit and guest satisfaction.
- Typical properties (Median) have an occupancy rate around 28%.
- Entry-level properties (Bottom 25%) average 16% occupancy, potentially facing higher vacancy.
Average Monthly Occupancy Rate Trend in Bull Shoals
Average Daily Rate (ADR) Airbnb Trends in Bull Shoals (2025)
Effective short term rental pricing strategy in Bull Shoals involves understanding monthly ADR fluctuations. The Average Daily Rate (ADR) for Airbnb in Bull Shoals typically peaks in April and dips lowest during November. Leveraging Airbnb dynamic pricing tools or strategies based on this seasonality can significantly boost revenue. Here's a look at the typical nightly rates achieved:
- Best-in-class properties (Top 10%) command rates of $246+ per night, often due to premium features or locations.
- Strong performing properties (Top 25%) achieve nightly rates of $193 or more.
- Typical properties (Median) charge around $136 per night.
- Entry-level properties (Bottom 25%) earn around $102 per night.
Average Daily Rate (ADR) Trend by Month in Bull Shoals
Get Live Bull Shoals Market Intelligence 👇

Explore Real-time Analytics
Airbnb Seasonality Analysis & Trends in Bull Shoals (2025)
Peak Season (June, July, April)
- Revenue averages $2,743 per month
- Occupancy rates average 45.0%
- Daily rates average $157
Shoulder Season
- Revenue averages $1,554 per month
- Occupancy maintains around 28.5%
- Daily rates hold near $150
Low Season (February, March, November)
- Revenue drops to average $876 per month
- Occupancy decreases to average 22.0%
- Daily rates adjust to average $149
Seasonality Insights for Bull Shoals
- The Airbnb seasonality in Bull Shoals shows highly seasonal trends requiring careful strategy. While the sections above show seasonal averages, it's also insightful to look at the extremes:
- During the high season, the absolute peak month showcases Bull Shoals's highest earning potential, with monthly revenues capable of climbing to $3,036, occupancy reaching a high of 55.2%, and ADRs peaking at $162.
- Conversely, the slowest single month of the year, typically falling within the low season, marks the market's lowest point. In this month, revenue might dip to $787, occupancy could drop to 20.6%, and ADRs may adjust down to $145.
- Understanding both the seasonal averages and these monthly peaks and troughs in revenue, occupancy, and ADR is crucial for maximizing your Airbnb profit potential in Bull Shoals.
Seasonal Strategies for Maximizing Profit
- Peak Season: Maximize revenue through premium pricing and potentially longer minimum stays. Ensure high availability.
- Low Season: Offer competitive pricing, special promotions (e.g., extended stay discounts), and flexible cancellation policies. Target off-season travelers like remote workers or budget-conscious guests.
- Shoulder Seasons: Implement dynamic pricing that balances peak and low rates. Target weekend travelers or specific events. Offer slightly more flexible terms than peak season.
- Regularly analyze your own performance against these Bull Shoals seasonality benchmarks and adjust your pricing and availability strategy accordingly.
Best Areas for Airbnb Investment in Bull Shoals (2025)
Exploring the top neighborhoods for short-term rentals in Bull Shoals? This section highlights key areas, outlining why they are attractive for hosts and guests, along with notable local attractions. Consider these locations based on your target guest profile and investment strategy.
| Neighborhood / Area | Why Host Here? (Target Guests & Appeal) | Key Attractions & Landmarks |
|---|---|---|
| Bull Shoals Lake | A beautiful lake surrounded by natural scenery, ideal for outdoor activities such as boating, fishing, and swimming. It attracts nature lovers and families looking for a relaxing getaway. | Bull Shoals Dam, Bull Shoals State Park, Lakeview Marina, North Fork River, Ozark Fish and Wildlife Conservation Area |
| Downtown Bull Shoals | The charming downtown area offers local shops, restaurants, and access to community events. It appeals to visitors wanting to experience the local culture and hospitality. | Bull Shoals Theater of the Arts, Bull Shoals History Museum, local eateries, seasonal festivals |
| The White River | Known for world-class trout fishing and scenic views, the White River attracts anglers and nature enthusiasts year-round. Ideal for those seeking a fishing lodge experience. | White River Access, Trophy Trout Fishing, Kayaking and Canoeing, Scenic Float Trips |
| Ozark National Forest | A vast area of wilderness that offers hiking, camping, and stunning vistas of the Ozark mountains. Ideal for adventure seekers and those wanting to disconnect in nature. | Multiple hiking trails, Scenic overlooks, Wildlife watching, Camping spots |
| Mountain Home | Nearby Mountain Home offers more urban amenities while still being close to Bull Shoals. It's popular for visitors looking for convenience and access to larger town services. | Shopping Malls, Restaurants, Museums, Trout Fishing Parks |
| Cotter | A quaint town located on the White River known for its excellent fishing opportunities and its scenic beauty. Great for travelers looking for a quiet retreat. | Cotter Bridge, Fishing Spots, Outdoor Recreation Areas |
| Gassville | A nearby small town that provides a homey feel and local charm. It is attractive to visitors exploring the surrounding areas and nature. | Local parks, historic sites, community events |
| Norfork Lake | Another stunning lake that offers various recreational activities similar to Bull Shoals Lake, attracting families and outdoor enthusiasts who enjoy water-related activities. | Norfork Dam, Norfork Recreation Area, Boating and fishing spots |
Understanding Airbnb License Requirements & STR Laws in Bull Shoals (2025)
While Bull Shoals, Arkansas, United States currently shows low STR regulations, specific Airbnb license requirements might still exist or change. Always verify the latest short term rental regulations and Airbnb license requirements directly with local government authorities for Bull Shoals to ensure full compliance before hosting.
(Source: AirROI data, 2025, finding no licensed listings among those analyzed)
Top Performing Airbnb Properties in Bull Shoals (2025)
Benchmark your potential! Explore examples of top-performing Airbnb properties in Bull Shoalsbased on Trailing Twelve Month (TTM) revenue. Analyze their characteristics, revenue, occupancy rate, and ADR to understand what drives success in this market.
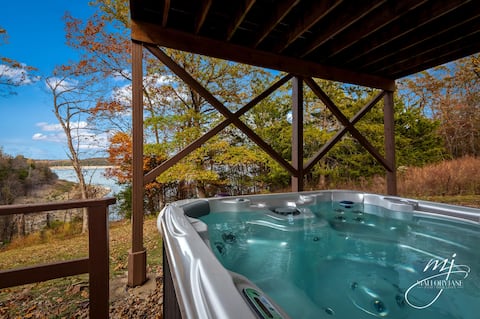
Lakefront Hot Tub~Kayaks~Firepit~Nature Lovers
Entire Place • 4 bedrooms
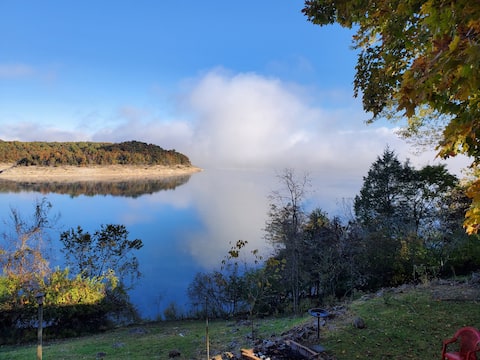
Life is short, make it sweet by the lake
Entire Place • 3 bedrooms

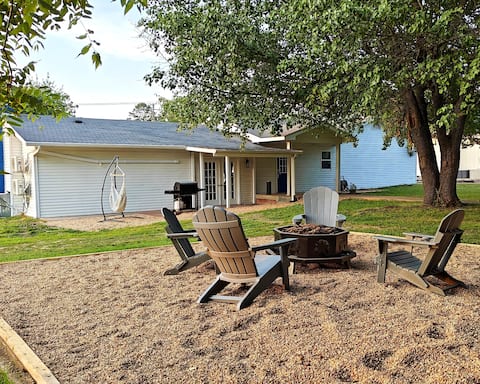
Bull Shoals Lake Escape
Entire Place • 4 bedrooms
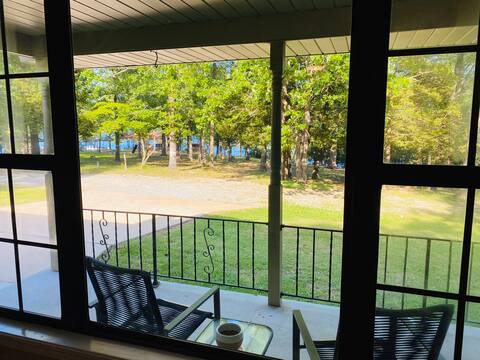
Big or Small Family, Your Lake Escape Awaits!
Entire Place • 4 bedrooms
Steps to the water’s edge of Bull Shoals Lake!!
Entire Place • 3 bedrooms

Cozy Bull Shoals Condo Getaway ~ 1 Mi to Lake!
Entire Place • 1 bedroom
Note: Performance varies based on location, size, amenities, seasonality, and management quality. Data reflects the past 12 months.
Top Performing Airbnb Hosts in Bull Shoals (2025)
Learn from the best! This table showcases top-performing Airbnb hosts in Bull Shoals based on the number of properties managed and estimated total revenue over the past year. Analyze their scale and performance metrics.
| Host Name | Properties | Grossing Revenue | Stay Reviews | Avg Rating |
|---|---|---|---|---|
| Evolve | 5 | $67,055 | 77 | 4.82/5.0 |
| Andy | 1 | $57,662 | 67 | 4.87/5.0 |
| Kristen | 1 | $35,487 | 19 | 4.95/5.0 |
| Shyanne | 2 | $33,727 | 101 | 4.86/5.0 |
| Linsey | 2 | $29,984 | 88 | 4.91/5.0 |
| Aaron | 1 | $21,907 | 18 | 4.94/5.0 |
| Host #157199924 | 1 | $20,231 | 96 | 4.98/5.0 |
| Lisa | 1 | $18,753 | 61 | 4.95/5.0 |
| Heather | 1 | $18,476 | 115 | 4.95/5.0 |
| Tammy | 1 | $15,386 | 30 | 4.97/5.0 |
Analyzing the strategies of top hosts, such as their property selection, pricing, and guest communication, can offer valuable lessons for optimizing your own Airbnb operations in Bull Shoals.
Dive Deeper: Advanced Bull Shoals STR Market Data (2025)
Ready to unlock more insights? AirROI provides access to advanced metrics and comprehensive Airbnb data for Bull Shoals. Explore detailed analytics beyond this report to refine your investment strategy, optimize pricing, and maximize your vacation rental profits.
Explore Advanced MetricsBull Shoals Short-Term Rental Market Composition (2025): Property & Room Types
Room Type Distribution
Property Type Distribution
Market Composition Insights for Bull Shoals
- The Bull Shoals Airbnb market composition is heavily skewed towards Entire Home/Apt listings, which make up 89.5% of the 19 active rentals. This indicates strong guest preference for privacy and space.
- Looking at the property type distribution in Bull Shoals, House properties are the most common (73.7%), reflecting the local real estate landscape.
- Houses represent a significant 73.7% portion, catering likely to families or larger groups.
- The presence of 10.5% Hotel/Boutique listings indicates integration with traditional hospitality.
Bull Shoals Airbnb Room Capacity Analysis (2025): Bedroom Distribution
Distribution of Listings by Number of Bedrooms
Room Capacity Insights for Bull Shoals
- The dominant room capacity in Bull Shoals is 3 bedrooms listings, making up 42.1% of the market. This suggests a strong demand for properties suitable for families or small groups.
- Together, 3 bedrooms and 2 bedrooms properties represent 63.2% of the active Airbnb listings in Bull Shoals, indicating a high concentration in these sizes.
- A significant 57.9% of listings offer 3+ bedrooms, catering to larger groups and families seeking more space in Bull Shoals.
Bull Shoals Vacation Rental Guest Capacity Trends (2025)
Distribution of Listings by Guest Capacity
Guest Capacity Insights for Bull Shoals
- The most common guest capacity trend in Bull Shoals vacation rentals is listings accommodating 8+ guests (47.4%). This suggests the primary traveler segment is likely larger groups.
- Properties designed for 8+ guests and 4 guests dominate the Bull Shoals STR market, accounting for 68.5% of listings.
- 63.2% of properties accommodate 6+ guests, serving the market segment for larger families or group travel in Bull Shoals.
- On average, properties in Bull Shoals are equipped to host 5.9 guests.
Bull Shoals Airbnb Booking Patterns (2025): Available vs. Booked Days
Available Days Distribution
Booked Days Distribution
Booking Pattern Insights for Bull Shoals
- The most common availability pattern in Bull Shoals falls within the 271-366 days range, representing 52.6% of listings. This suggests many properties have significant open periods on their calendars.
- Approximately 89.4% of listings show high availability (181+ days open annually), indicating potential for increased bookings or specific owner usage patterns.
- For booked days, the 91-180 days range is most frequent in Bull Shoals (47.4%), reflecting common guest stay durations or potential owner blocking patterns.
- A notable 15.8% of properties secure long booking periods (181+ days booked per year), highlighting successful long-term rental strategies or significant owner usage.
Bull Shoals Airbnb Minimum Stay Requirements Analysis
Distribution of Listings by Minimum Night Requirement
1 Night
5 listings
27.8% of total
2 Nights
11 listings
61.1% of total
3 Nights
2 listings
11.1% of total
Key Insights
- The most prevalent minimum stay requirement in Bull Shoals is 2 Nights, adopted by 61.1% of listings. This highlights the market's preference for shorter, flexible bookings.
- A strong majority (88.9%) of the Bull Shoals Airbnb data shows acceptance of very short stays (1-2 nights), indicating a dynamic, high-turnover market.
Recommendations
- Align with the market by considering a 2 Nights minimum stay, as 61.1% of Bull Shoals hosts use this setting.
- If feasible, allowing 1-night stays, especially midweek or during low season, could capture last-minute bookings, as only 27.8% currently do.
- Adjust minimum nights based on seasonality – potentially shorter during low season and longer during peak demand periods in Bull Shoals.
Bull Shoals Airbnb Cancellation Policy Trends Analysis (2025)
Flexible
1 listings
5.9% of total
Moderate
8 listings
47.1% of total
Firm
2 listings
11.8% of total
Strict
6 listings
35.3% of total
Cancellation Policy Insights for Bull Shoals
- The prevailing Airbnb cancellation policy trend in Bull Shoals is Moderate, used by 47.1% of listings.
- There's a relatively balanced mix between guest-friendly (53.0%) and stricter (47.1%) policies, offering choices for different guest needs.
Recommendations for Hosts
- Consider adopting a Moderate policy to align with the 47.1% market standard in Bull Shoals.
- With 35.3% using Strict terms, this is a viable option in Bull Shoals, particularly for high-value properties or during peak demand periods.
- Regularly review your cancellation policy against competitors and market demand shifts in Bull Shoals.
Bull Shoals STR Booking Lead Time Analysis (2025)
Average Booking Lead Time by Month
Booking Lead Time Insights for Bull Shoals
- The overall average booking lead time for vacation rentals in Bull Shoals is 49 days.
- Guests book furthest in advance for stays during April (average 113 days), likely coinciding with peak travel demand or local events.
- The shortest booking windows occur for stays in October (average 38 days), indicating more last-minute travel plans during this time.
- Seasonally, Summer (67 days avg.) sees the longest lead times, while Fall (48 days avg.) has the shortest, reflecting typical travel planning cycles.
Recommendations for Hosts
- Use the overall average lead time (49 days) as a baseline for your pricing and availability strategy in Bull Shoals.
- For April stays, consider implementing length-of-stay discounts or slightly higher rates for bookings made less than 113 days out to capitalize on advance planning.
- Target marketing efforts for the Summer season well in advance (at least 67 days) to capture early planners.
- Monitor your own booking lead times against these Bull Shoals averages to identify opportunities for dynamic pricing adjustments.
Popular & Essential Airbnb Amenities in Bull Shoals (2025)
Amenity Prevalence
Amenity Insights for Bull Shoals
- Essential amenities in Bull Shoals that guests expect include: TV, Smoke alarm, Air conditioning, Free parking on premises, Wifi. Lacking these (any) could significantly impact bookings.
- Popular amenities like Essentials, BBQ grill, Coffee maker are common but not universal. Offering these can provide a competitive edge.
Recommendations for Hosts
- Ensure your listing includes all essential amenities for Bull Shoals: TV, Smoke alarm, Air conditioning, Free parking on premises, Wifi.
- Consider adding popular differentiators like Essentials or BBQ grill to increase appeal.
- Highlight unique or less common amenities you offer (e.g., hot tub, dedicated workspace, EV charger) in your listing description and photos.
- Regularly check competitor amenities in Bull Shoals to stay competitive.
Bull Shoals Airbnb Guest Demographics & Profile Analysis (2025)
Guest Profile Summary for Bull Shoals
- The typical guest profile for Airbnb in Bull Shoals consists of primarily domestic travelers (100%), often arriving from nearby Benton, typically belonging to the Post-2000s (Gen Z/Alpha) group (50%), primarily speaking English or German.
- Domestic travelers account for 100.0% of guests.
- Top languages spoken are English (85.7%) followed by German (2.9%).
- A significant demographic segment is the Post-2000s (Gen Z/Alpha) group, representing 50% of guests.
Recommendations for Hosts
- Target domestic marketing efforts towards travelers from Benton and St. Louis.
- Tailor amenities and listing descriptions to appeal to the dominant Post-2000s (Gen Z/Alpha) demographic (e.g., highlight fast WiFi, smart home features, local guides).
- Highlight unique local experiences or amenities relevant to the primary guest profile.
- Consider seasonal promotions aligned with peak travel times for key origin markets.
Nearby Short-Term Rental Market Comparison
How does the Bull Shoals Airbnb market stack up against its neighbors? Compare key performance metrics like average monthly revenue, ADR, and occupancy rates in surrounding areas to understand the broader regional STR landscape.
| Market | Active Properties | Monthly Revenue | Daily Rate | Avg. Occupancy |
|---|---|---|---|---|
| Blue Eye | 25 | $6,531 | $430.94 | 53% |
| Hollister | 206 | $4,444 | $369.44 | 43% |
| Flippin | 33 | $3,682 | $254.76 | 43% |
| Kimberling City | 231 | $3,610 | $327.84 | 36% |
| Kirbyville | 16 | $2,930 | $262.20 | 34% |
| Ponca | 37 | $2,914 | $368.88 | 33% |
| Eagle Rock | 54 | $2,874 | $239.48 | 40% |
| Omaha | 30 | $2,865 | $199.67 | 49% |
| Ridgedale | 142 | $2,821 | $292.75 | 36% |
| Branson West | 219 | $2,821 | $202.78 | 46% |