Winslow Airbnb Market Analysis 2026: Short Term Rental Data & Vacation Rental Statistics in Arizona, United States
Is Airbnb profitable in Winslow in 2026? Explore comprehensive Airbnb analytics for Winslow, Arizona, United States to uncover income potential. This 2026 STR market report for Winslow, based on AirROI data from February 2025 to January 2026, reveals key trends in the niche market of 20 active listings.
Whether you're considering an Airbnb investment in Winslow, optimizing your existing vacation rental, or exploring rental arbitrage opportunities, understanding the Winslow Airbnb data is crucial. Leveraging the low regulation environment is key to maximizing your short term rental income potential. Let's dive into the specifics.
Key Winslow Airbnb Performance Metrics Overview
Monthly Airbnb Revenue Variations & Income Potential in Winslow (2026)
Understanding the monthly revenue variations for Airbnb listings in Winslow is key to maximizing your short term rental income potential. Seasonality significantly impacts earnings. Our analysis, based on data from the past 12 months, shows that the peak revenue month for STRs in Winslow is typically November, while February often presents the lowest earnings, highlighting opportunities for strategic pricing adjustments during shoulder and low seasons. Explore the typical Airbnb income in Winslow across different performance tiers:
- Best-in-class properties (Top 10%) achieve $4,534+ monthly, often utilizing dynamic pricing and superior guest experiences.
- Strong performing properties (Top 25%) earn $3,368 or more, indicating effective management and desirable locations/amenities.
- Typical properties (Median) generate around $1,731 per month, representing the average market performance.
- Entry-level properties (Bottom 25%) see earnings around $812, often with potential for optimization.
Average Monthly Airbnb Earnings Trend in Winslow
Winslow Airbnb Occupancy Rate Trends (2026)
Maximize your bookings by understanding the Winslow STR occupancy trends. Seasonal demand shifts significantly influence how often properties are booked. Typically, Julysees the highest demand (peak season occupancy), while December experiences the lowest (low season). Effective strategies, like adjusting minimum stays or offering promotions, can boost occupancy during slower periods. Here's how different property tiers perform in Winslow:
- Best-in-class properties (Top 10%) achieve 86%+ occupancy, indicating high desirability and potentially optimized availability.
- Strong performing properties (Top 25%) maintain 70% or higher occupancy, suggesting good market fit and guest satisfaction.
- Typical properties (Median) have an occupancy rate around 49%.
- Entry-level properties (Bottom 25%) average 23% occupancy, potentially facing higher vacancy.
Average Monthly Occupancy Rate Trend in Winslow
Average Daily Rate (ADR) Airbnb Trends in Winslow (2026)
Effective short term rental pricing strategy in Winslow involves understanding monthly ADR fluctuations. The Average Daily Rate (ADR) for Airbnb in Winslow typically peaks in January and dips lowest during March. Leveraging Airbnb dynamic pricing tools or strategies based on this seasonality can significantly boost revenue. Here's a look at the typical nightly rates achieved:
- Best-in-class properties (Top 10%) command rates of $163+ per night, often due to premium features or locations.
- Strong performing properties (Top 25%) achieve nightly rates of $139 or more.
- Typical properties (Median) charge around $118 per night.
- Entry-level properties (Bottom 25%) earn around $103 per night.
Average Daily Rate (ADR) Trend by Month in Winslow
Get Live Winslow Market Intelligence 👇

Explore Real-time Analytics
Airbnb Seasonality Analysis & Trends in Winslow (2026)
Peak Season (November, January, July)
- Revenue averages $2,787 per month
- Occupancy rates average 52.9%
- Daily rates average $127
Shoulder Season
- Revenue averages $2,201 per month
- Occupancy maintains around 48.4%
- Daily rates hold near $123
Low Season (February, June, August)
- Revenue drops to average $1,808 per month
- Occupancy decreases to average 43.7%
- Daily rates adjust to average $121
Seasonality Insights for Winslow
- The Airbnb seasonality in Winslow shows moderate seasonality with distinct peak and low periods. While the sections above show seasonal averages, it's also insightful to look at the extremes:
- During the high season, the absolute peak month showcases Winslow's highest earning potential, with monthly revenues capable of climbing to $2,911, occupancy reaching a high of 65.2%, and ADRs peaking at $130.
- Conversely, the slowest single month of the year, typically falling within the low season, marks the market's lowest point. In this month, revenue might dip to $1,653, occupancy could drop to 39.8%, and ADRs may adjust down to $118.
- Understanding both the seasonal averages and these monthly peaks and troughs in revenue, occupancy, and ADR is crucial for maximizing your Airbnb profit potential in Winslow.
Seasonal Strategies for Maximizing Profit
- Peak Season: Maximize revenue through premium pricing and potentially longer minimum stays. Ensure high availability.
- Low Season: Offer competitive pricing, special promotions (e.g., extended stay discounts), and flexible cancellation policies. Target off-season travelers like remote workers or budget-conscious guests.
- Shoulder Seasons: Implement dynamic pricing that balances peak and low rates. Target weekend travelers or specific events. Offer slightly more flexible terms than peak season.
- Regularly analyze your own performance against these Winslow seasonality benchmarks and adjust your pricing and availability strategy accordingly.
Best Areas for Airbnb Investment in Winslow (2026)
Exploring the top neighborhoods for short-term rentals in Winslow? This section highlights key areas, outlining why they are attractive for hosts and guests, along with notable local attractions. Consider these locations based on your target guest profile and investment strategy.
| Neighborhood / Area | Why Host Here? (Target Guests & Appeal) | Key Attractions & Landmarks |
|---|---|---|
| Historic Winslow | A charming area that captures the essence of Route 66, appealing to history buffs and road trip travelers. Its nostalgic vibe is ideal for those looking to experience classic Americana. | Standin' on the Corner Park, Route 66 Museum, Old Trails Museum, Winslow Arts Trust, Historic Downtown Winslow |
| Jim Gray's Petrified Wood Co. | An iconic attraction that draws visitors interested in nature and geological wonders. Perfect for those wanting to explore the natural beauty of the area. | Petrified Wood, Gift Shop, Nature Trails, Local Art |
| Homolovi State Park | Known for its archaeological significance and stunning landscapes, this area appeals to outdoor enthusiasts and history lovers alike, ideal for camping and nature activities. | Ancient Ruins, Bird Watching, Camping Sites, Nature Trails |
| Little Painted Desert County Park | Offers breathtaking views and unique geological features. Attracts visitors interested in photography and outdoor activities. | Scenic Overlooks, Hiking Trails, Photography Opportunities |
| Meteor Crater | One of the best-preserved meteorite impact sites in the world, offering educational tours and spectacular views, ideal for science enthusiasts and families. | Visitor Center, Walking Trails, Museum Exhibits |
| Winslow's Route 66 Motor Lodge | A quaint lodge that embodies the Route 66 spirit, attracting travelers looking for the classic road trip experience with themed decor. | Themed Rooms, Historic Signage, Swimming Pool |
| Bison Sanctuary | A unique wildlife experience that draws visitors interested in wildlife conservation and nature. | Bison Viewing, Self-Guided Tours, Educational Programs |
| La Posada Hotel | A historic rail stop turned unique hotel, offering cultural and architectural interest, attracting guests seeking a distinctive lodging experience. | Art Gallery, Historic Architecture, Fine Dining, Gardens |
Understanding Airbnb License Requirements & STR Laws in Winslow (2026)
While Winslow, Arizona, United States currently shows low STR regulations, specific Airbnb license requirements might still exist or change. Always verify the latest short term rental regulations and Airbnb license requirements directly with local government authorities for Winslow to ensure full compliance before hosting.
(Source: AirROI data, 2026, finding no licensed listings among those analyzed)
Top Performing Airbnb Properties in Winslow (2026)
Benchmark your potential! Explore examples of top-performing Airbnb properties in Winslowbased on Trailing Twelve Month (TTM) revenue. Analyze their characteristics, revenue, occupancy rate, and ADR to understand what drives success in this market.

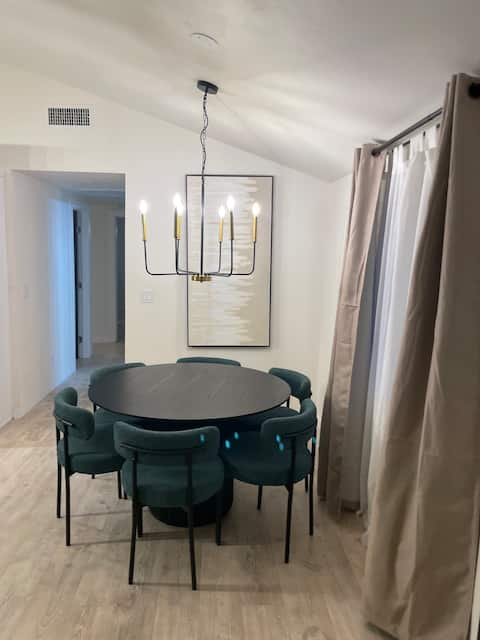
Elegant Modern Winslow Home
Entire Place • 4 bedrooms

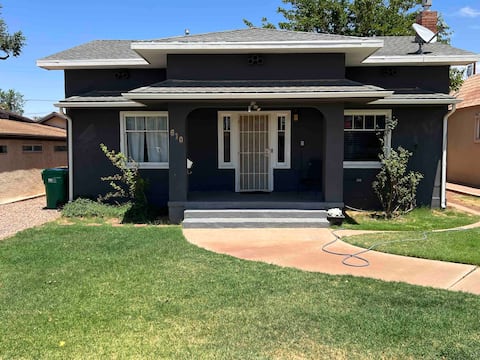
Easy Stay House
Entire Place • 3 bedrooms
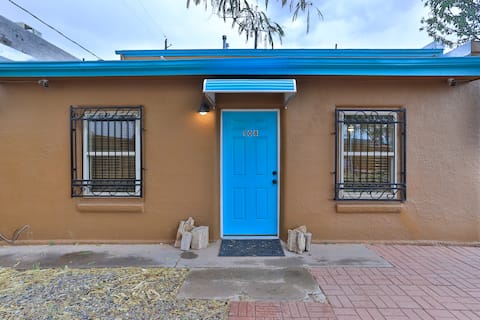
Winslow Stay
Entire Place • 2 bedrooms
Cheerful Two Bedroom House with Fire Place.
Entire Place • 2 bedrooms
Charming Winslow Retreat Just a Stroll to Downtown
Entire Place • 3 bedrooms

High desert cottage in the heart of Winslow
Entire Place • 1 bedroom
Note: Performance varies based on location, size, amenities, seasonality, and management quality. Data reflects the past 12 months.
Top Performing Airbnb Hosts in Winslow (2026)
Learn from the best! This table showcases top-performing Airbnb hosts in Winslow based on the number of properties managed and estimated total revenue over the past year. Analyze their scale and performance metrics.
| Host Name | Properties | Grossing Revenue | Stay Reviews | Avg Rating |
|---|---|---|---|---|
| Sarah | 2 | $79,349 | 372 | 4.95/5.0 |
| Michael | 1 | $45,233 | 9 | 5.00/5.0 |
| Michael | 1 | $31,374 | 74 | 4.84/5.0 |
| Hugo | 1 | $29,918 | 12 | 5.00/5.0 |
| Ryan | 3 | $20,780 | 7 | 4.75/5.0 |
| Vincent | 1 | $15,619 | 67 | 4.93/5.0 |
| Michelle | 3 | $11,033 | 15 | 4.96/5.0 |
| Sondra | 2 | $9,729 | 653 | 4.92/5.0 |
| Mariah | 2 | $9,697 | 17 | 4.96/5.0 |
| Global Travel Accommodations | 2 | $7,489 | 156 | 4.91/5.0 |
Analyzing the strategies of top hosts, such as their property selection, pricing, and guest communication, can offer valuable lessons for optimizing your own Airbnb operations in Winslow.
Dive Deeper: Advanced Winslow STR Market Data (2026)
Ready to unlock more insights? AirROI provides access to advanced metrics and comprehensive Airbnb data for Winslow. Explore detailed analytics beyond this report to refine your investment strategy, optimize pricing, and maximize your vacation rental profits.
Explore Advanced MetricsWinslow Short-Term Rental Market Composition (2026): Property & Room Types
Room Type Distribution
Property Type Distribution
Market Composition Insights for Winslow
- The Winslow Airbnb market composition is heavily skewed towards Entire Home/Apt listings, which make up 80% of the 20 active rentals. This indicates strong guest preference for privacy and space.
- Looking at the property type distribution in Winslow, House properties are the most common (65%), reflecting the local real estate landscape.
- Houses represent a significant 65% portion, catering likely to families or larger groups.
Winslow Airbnb Room Capacity Analysis (2026): Bedroom Distribution
Distribution of Listings by Number of Bedrooms
Room Capacity Insights for Winslow
- The dominant room capacity in Winslow is 2 bedrooms listings, making up 30% of the market. This suggests a strong demand for properties suitable for couples or solo travelers.
- Together, 2 bedrooms and 1 bedroom properties represent 55.0% of the active Airbnb listings in Winslow, indicating a high concentration in these sizes.
Winslow Vacation Rental Guest Capacity Trends (2026)
Distribution of Listings by Guest Capacity
Guest Capacity Insights for Winslow
- The most common guest capacity trend in Winslow vacation rentals is listings accommodating 4 guests (20%). This suggests the primary traveler segment is likely small families or groups.
- Properties designed for 4 guests and 6 guests dominate the Winslow STR market, accounting for 40.0% of listings.
- 25.0% of properties accommodate 6+ guests, serving the market segment for larger families or group travel in Winslow.
- On average, properties in Winslow are equipped to host 3.4 guests.
Winslow Airbnb Booking Patterns (2026): Available vs. Booked Days
Available Days Distribution
Booked Days Distribution
Booking Pattern Insights for Winslow
- The most common availability pattern in Winslow falls within the 271-366 days range, representing 65% of listings. This suggests many properties have significant open periods on their calendars.
- Approximately 80.0% of listings show high availability (181+ days open annually), indicating potential for increased bookings or specific owner usage patterns.
- For booked days, the 31-90 days range is most frequent in Winslow (45%), reflecting common guest stay durations or potential owner blocking patterns.
- A notable 20.0% of properties secure long booking periods (181+ days booked per year), highlighting successful long-term rental strategies or significant owner usage.
Winslow Airbnb Minimum Stay Requirements Analysis
Distribution of Listings by Minimum Night Requirement
1 Night
10 listings
50% of total
3 Nights
1 listings
5% of total
4-6 Nights
6 listings
30% of total
30+ Nights
3 listings
15% of total
Key Insights
- The most prevalent minimum stay requirement in Winslow is 1 Night, adopted by 50% of listings. This highlights the market's preference for shorter, flexible bookings.
- A significant segment (15%) caters to monthly stays (30+ nights) in Winslow, pointing to opportunities in the extended-stay market.
Recommendations
- Align with the market by considering a 1 Night minimum stay, as 50% of Winslow hosts use this setting.
- Explore offering discounts for stays of 30+ nights to attract the 15% of the market seeking extended stays.
- Adjust minimum nights based on seasonality – potentially shorter during low season and longer during peak demand periods in Winslow.
Winslow Airbnb Cancellation Policy Trends Analysis (2026)
Flexible
5 listings
25% of total
Moderate
6 listings
30% of total
Firm
7 listings
35% of total
Strict
2 listings
10% of total
Cancellation Policy Insights for Winslow
- The prevailing Airbnb cancellation policy trend in Winslow is Firm, used by 35% of listings.
- There's a relatively balanced mix between guest-friendly (55.0%) and stricter (45.0%) policies, offering choices for different guest needs.
Recommendations for Hosts
- Consider adopting a Firm policy to align with the 35% market standard in Winslow.
- Using a Strict policy might deter some guests, as only 10% of listings use it. Evaluate if potential revenue protection outweighs possible lower booking rates.
- Regularly review your cancellation policy against competitors and market demand shifts in Winslow.
Winslow STR Booking Lead Time Analysis (2026)
Average Booking Lead Time by Month
Booking Lead Time Insights for Winslow
- The overall average booking lead time for vacation rentals in Winslow is 27 days.
- Guests book furthest in advance for stays during September (average 77 days), likely coinciding with peak travel demand or local events.
- The shortest booking windows occur for stays in April (average 12 days), indicating more last-minute travel plans during this time.
- Seasonally, Fall (43 days avg.) sees the longest lead times, while Winter (21 days avg.) has the shortest, reflecting typical travel planning cycles.
Recommendations for Hosts
- Use the overall average lead time (27 days) as a baseline for your pricing and availability strategy in Winslow.
- For September stays, consider implementing length-of-stay discounts or slightly higher rates for bookings made less than 77 days out to capitalize on advance planning.
- During April, focus on last-minute booking availability and promotions, as guests book with very short notice (12 days avg.).
- Target marketing efforts for the Fall season well in advance (at least 43 days) to capture early planners.
- Monitor your own booking lead times against these Winslow averages to identify opportunities for dynamic pricing adjustments.
Popular & Essential Airbnb Amenities in Winslow (2026)
Amenity Prevalence
Amenity Insights for Winslow
- Essential amenities in Winslow that guests expect include: TV, Smoke alarm, Air conditioning, Wifi. Lacking these (any) could significantly impact bookings.
- Popular amenities like Kitchen, Free parking on premises, Hot water are common but not universal. Offering these can provide a competitive edge.
Recommendations for Hosts
- Ensure your listing includes all essential amenities for Winslow: TV, Smoke alarm, Air conditioning, Wifi.
- Prioritize adding missing essentials: Air conditioning, Wifi.
- Consider adding popular differentiators like Kitchen or Free parking on premises to increase appeal.
- Highlight unique or less common amenities you offer (e.g., hot tub, dedicated workspace, EV charger) in your listing description and photos.
- Regularly check competitor amenities in Winslow to stay competitive.
Winslow Airbnb Guest Demographics & Profile Analysis (2026)
Guest Profile Summary for Winslow
- The typical guest profile for Airbnb in Winslow consists of primarily domestic travelers (93%), often arriving from nearby Phoenix, typically belonging to the Post-2000s (Gen Z/Alpha) group (50%), primarily speaking English or Spanish.
- Domestic travelers account for 92.6% of guests.
- Key international markets include United States (92.6%) and United Kingdom (1.1%).
- Top languages spoken are English (52.9%) followed by Spanish (6.6%).
- A significant demographic segment is the Post-2000s (Gen Z/Alpha) group, representing 50% of guests.
Recommendations for Hosts
- Target domestic marketing efforts towards travelers from Phoenix and Tucson.
- Tailor amenities and listing descriptions to appeal to the dominant Post-2000s (Gen Z/Alpha) demographic (e.g., highlight fast WiFi, smart home features, local guides).
- Highlight unique local experiences or amenities relevant to the primary guest profile.
- Consider seasonal promotions aligned with peak travel times for key origin markets.
Nearby Short-Term Rental Market Comparison
How does the Winslow Airbnb market stack up against its neighbors? Compare key performance metrics like average monthly revenue, ADR, and occupancy rates in surrounding areas to understand the broader regional STR landscape.
| Market | Active Properties | Monthly Revenue | Daily Rate | Avg. Occupancy |
|---|---|---|---|---|
| Sedona | 1,658 | $5,761 | $410.99 | 50% |
| Sedona City Limit | 372 | $4,884 | $333.39 | 51% |
| Fort Valley | 38 | $4,747 | $408.22 | 43% |
| Doney Park | 17 | $4,085 | $299.83 | 54% |
| Kachina Village | 138 | $3,786 | $252.87 | 50% |
| Greenehaven | 48 | $3,740 | $333.15 | 44% |
| Big Park | 427 | $3,618 | $294.75 | 47% |
| Star Valley | 12 | $3,374 | $279.20 | 43% |
| Flagstaff | 1,391 | $3,353 | $281.58 | 47% |
| Timberline-Fernwood | 17 | $3,344 | $202.94 | 58% |