Williamson Airbnb Market Analysis 2026: Short Term Rental Data & Vacation Rental Statistics in Arizona, United States
Is Airbnb profitable in Williamson in 2026? Explore comprehensive Airbnb analytics for Williamson, Arizona, United States to uncover income potential. This 2026 STR market report for Williamson, based on AirROI data from February 2025 to January 2026, reveals key trends in the niche market of 22 active listings.
Whether you're considering an Airbnb investment in Williamson, optimizing your existing vacation rental, or exploring rental arbitrage opportunities, understanding the Williamson Airbnb data is crucial. Leveraging the low regulation environment is key to maximizing your short term rental income potential. Let's dive into the specifics.
Key Williamson Airbnb Performance Metrics Overview
Monthly Airbnb Revenue Variations & Income Potential in Williamson (2026)
Understanding the monthly revenue variations for Airbnb listings in Williamson is key to maximizing your short term rental income potential. Seasonality significantly impacts earnings. Our analysis, based on data from the past 12 months, shows that the peak revenue month for STRs in Williamson is typically July, while September often presents the lowest earnings, highlighting opportunities for strategic pricing adjustments during shoulder and low seasons. Explore the typical Airbnb income in Williamson across different performance tiers:
- Best-in-class properties (Top 10%) achieve $4,483+ monthly, often utilizing dynamic pricing and superior guest experiences.
- Strong performing properties (Top 25%) earn $3,070 or more, indicating effective management and desirable locations/amenities.
- Typical properties (Median) generate around $2,139 per month, representing the average market performance.
- Entry-level properties (Bottom 25%) see earnings around $1,205, often with potential for optimization.
Average Monthly Airbnb Earnings Trend in Williamson
Williamson Airbnb Occupancy Rate Trends (2026)
Maximize your bookings by understanding the Williamson STR occupancy trends. Seasonal demand shifts significantly influence how often properties are booked. Typically, Julysees the highest demand (peak season occupancy), while September experiences the lowest (low season). Effective strategies, like adjusting minimum stays or offering promotions, can boost occupancy during slower periods. Here's how different property tiers perform in Williamson:
- Best-in-class properties (Top 10%) achieve 74%+ occupancy, indicating high desirability and potentially optimized availability.
- Strong performing properties (Top 25%) maintain 53% or higher occupancy, suggesting good market fit and guest satisfaction.
- Typical properties (Median) have an occupancy rate around 39%.
- Entry-level properties (Bottom 25%) average 25% occupancy, potentially facing higher vacancy.
Average Monthly Occupancy Rate Trend in Williamson
Average Daily Rate (ADR) Airbnb Trends in Williamson (2026)
Effective short term rental pricing strategy in Williamson involves understanding monthly ADR fluctuations. The Average Daily Rate (ADR) for Airbnb in Williamson typically peaks in July and dips lowest during February. Leveraging Airbnb dynamic pricing tools or strategies based on this seasonality can significantly boost revenue. Here's a look at the typical nightly rates achieved:
- Best-in-class properties (Top 10%) command rates of $359+ per night, often due to premium features or locations.
- Strong performing properties (Top 25%) achieve nightly rates of $224 or more.
- Typical properties (Median) charge around $134 per night.
- Entry-level properties (Bottom 25%) earn around $99 per night.
Average Daily Rate (ADR) Trend by Month in Williamson
Get Live Williamson Market Intelligence 👇

Explore Real-time Analytics
Airbnb Seasonality Analysis & Trends in Williamson (2026)
Peak Season (July, December, August)
- Revenue averages $3,074 per month
- Occupancy rates average 46.8%
- Daily rates average $186
Shoulder Season
- Revenue averages $2,374 per month
- Occupancy maintains around 42.9%
- Daily rates hold near $171
Low Season (February, June, September)
- Revenue drops to average $1,708 per month
- Occupancy decreases to average 34.9%
- Daily rates adjust to average $170
Seasonality Insights for Williamson
- The Airbnb seasonality in Williamson shows highly seasonal trends requiring careful strategy. While the sections above show seasonal averages, it's also insightful to look at the extremes:
- During the high season, the absolute peak month showcases Williamson's highest earning potential, with monthly revenues capable of climbing to $3,613, occupancy reaching a high of 51.6%, and ADRs peaking at $192.
- Conversely, the slowest single month of the year, typically falling within the low season, marks the market's lowest point. In this month, revenue might dip to $1,564, occupancy could drop to 27.1%, and ADRs may adjust down to $153.
- Understanding both the seasonal averages and these monthly peaks and troughs in revenue, occupancy, and ADR is crucial for maximizing your Airbnb profit potential in Williamson.
Seasonal Strategies for Maximizing Profit
- Peak Season: Maximize revenue through premium pricing and potentially longer minimum stays. Ensure high availability.
- Low Season: Offer competitive pricing, special promotions (e.g., extended stay discounts), and flexible cancellation policies. Target off-season travelers like remote workers or budget-conscious guests.
- Shoulder Seasons: Implement dynamic pricing that balances peak and low rates. Target weekend travelers or specific events. Offer slightly more flexible terms than peak season.
- Regularly analyze your own performance against these Williamson seasonality benchmarks and adjust your pricing and availability strategy accordingly.
Best Areas for Airbnb Investment in Williamson (2026)
Exploring the top neighborhoods for short-term rentals in Williamson? This section highlights key areas, outlining why they are attractive for hosts and guests, along with notable local attractions. Consider these locations based on your target guest profile and investment strategy.
| Neighborhood / Area | Why Host Here? (Target Guests & Appeal) | Key Attractions & Landmarks |
|---|---|---|
| Sedona | Famous for its stunning red rock formations and vibrant arts community. A popular destination for nature lovers, hiking enthusiasts, and spiritual seekers, making it ideal for short-term rentals. | Red Rock State Park, Sedona Chapel of the Holy Cross, Cathedral Rock, Bell Rock, Sedona Art Center |
| Phoenix | The capital of Arizona with a growing population and business-friendly environment. It attracts a mix of tourists and business travelers, providing ample opportunity for Airbnb hosting. | Desert Botanical Garden, Heard Museum, South Mountain Park, Camelback Mountain, Phoenix Art Museum |
| Flagstaff | Known for its cool climate and proximity to the Grand Canyon. A gateway for outdoor activities such as skiing, hiking, and mountain biking, appealing to adventurous travelers. | Lowell Observatory, Walnut Canyon National Monument, Coconino National Forest, Arizona Snowbowl, Historic Route 66 |
| Tucson | Offers a rich blend of cultural heritage and beautiful desert landscapes. With attractions ranging from historic sites to outdoor adventures, it draws a diverse set of visitors. | Saguaro National Park, Arizona-Sonora Desert Museum, Old Tucson, Mission San Xavier del Bac, Tucson Botanical Gardens |
| Lake Havasu City | Known for its stunning lake and recreational activities, Lake Havasu City is a popular vacation destination, especially in the summer months. | London Bridge, Lake Havasu State Park, Havasu Falls, Lake Havasu Museum of History, Bill Williams River National Wildlife Refuge |
| Yuma | A historically rich area with a warm climate appealing to winter visitors, Yuma has various attractions from historical sites to outdoor recreation, making it attractive for Airbnb rentals. | Yuma Territorial Prison State Historic Park, Colorado River, Yuma Proving Ground, Yuma Quartermaster Depot State Historic Park, Imperial Sand Dunes |
| Scottsdale | Renowned for its upscale resorts, golf courses, and vibrant nightlife. Scottsdale attracts affluent tourists and those looking for a luxury experience, making it ideal for high-end Airbnb rentals. | Scottsdale Old Town, Desert Botanical Garden, Taliesin West, McDowell Sonoran Preserve, Scottsdale Waterfront |
| Globe | A small town with rich mining history and outdoor activities, Globe appeals to tourists seeking a more rustic Arizona experience, with unique local attractions. | Besh-Ba-Gowah Archaeological Park, Globe Historic District, Cobre Valley Center for the Arts, Four Peaks Wilderness Area, Apache Gold Casino Resort |
Understanding Airbnb License Requirements & STR Laws in Williamson (2026)
While Williamson, Arizona, United States currently shows low STR regulations, specific Airbnb license requirements might still exist or change. Always verify the latest short term rental regulations and Airbnb license requirements directly with local government authorities for Williamson to ensure full compliance before hosting.
(Source: AirROI data, 2026, finding no licensed listings among those analyzed)
Top Performing Airbnb Properties in Williamson (2026)
Benchmark your potential! Explore examples of top-performing Airbnb properties in Williamsonbased on Trailing Twelve Month (TTM) revenue. Analyze their characteristics, revenue, occupancy rate, and ADR to understand what drives success in this market.
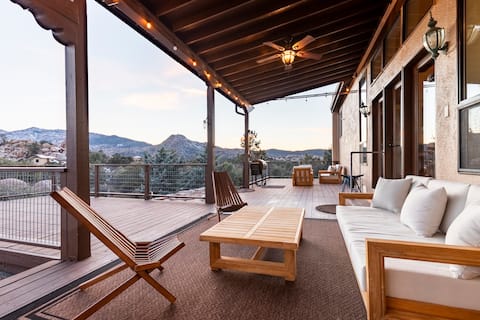
Hot Tub | King Bed | Serenity Retreat
Entire Place • 3 bedrooms

Mountain View Airy Retreat
Entire Place • 4 bedrooms

Private , Quiet, and Cozy cabin in Prescott city
Entire Place • 6 bedrooms
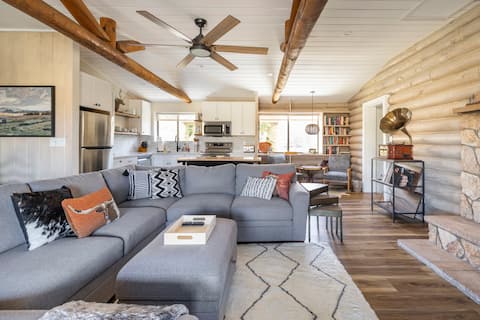
Log Cabin at Road Runner Crossing
Entire Place • 4 bedrooms

Luxury Cabin w/ Spa, Sauna & 5 Acres | MTN Views
Entire Place • 1 bedroom

Welcome to Suzanne&Gary's Granite Mountain Getaway
Entire Place • 1 bedroom
Note: Performance varies based on location, size, amenities, seasonality, and management quality. Data reflects the past 12 months.
Top Performing Airbnb Hosts in Williamson (2026)
Learn from the best! This table showcases top-performing Airbnb hosts in Williamson based on the number of properties managed and estimated total revenue over the past year. Analyze their scale and performance metrics.
| Host Name | Properties | Grossing Revenue | Stay Reviews | Avg Rating |
|---|---|---|---|---|
| Jane | 4 | $141,875 | 339 | 4.99/5.0 |
| Zac | 2 | $75,902 | 90 | 4.94/5.0 |
| Susan | 2 | $57,001 | 81 | 4.68/5.0 |
| Kj | 2 | $42,201 | 293 | 4.79/5.0 |
| John And Brittany | 1 | $41,767 | 193 | 4.99/5.0 |
| Edith | 2 | $39,537 | 332 | 4.97/5.0 |
| Gary | 1 | $33,183 | 92 | 5.00/5.0 |
| Wanderlust Prescott Retreats | 1 | $19,404 | 46 | 4.59/5.0 |
| Denise | 2 | $19,291 | 140 | 4.84/5.0 |
| Laura & Sean | 1 | $16,039 | 87 | 5.00/5.0 |
Analyzing the strategies of top hosts, such as their property selection, pricing, and guest communication, can offer valuable lessons for optimizing your own Airbnb operations in Williamson.
Dive Deeper: Advanced Williamson STR Market Data (2026)
Ready to unlock more insights? AirROI provides access to advanced metrics and comprehensive Airbnb data for Williamson. Explore detailed analytics beyond this report to refine your investment strategy, optimize pricing, and maximize your vacation rental profits.
Explore Advanced MetricsWilliamson Short-Term Rental Market Composition (2026): Property & Room Types
Room Type Distribution
Property Type Distribution
Market Composition Insights for Williamson
- The Williamson Airbnb market composition is heavily skewed towards Entire Home/Apt listings, which make up 95.5% of the 22 active rentals. This indicates strong guest preference for privacy and space.
- Looking at the property type distribution in Williamson, House properties are the most common (40.9%), reflecting the local real estate landscape.
- Houses represent a significant 40.9% portion, catering likely to families or larger groups.
- The presence of 22.7% Hotel/Boutique listings indicates integration with traditional hospitality.
Williamson Airbnb Room Capacity Analysis (2026): Bedroom Distribution
Distribution of Listings by Number of Bedrooms
Room Capacity Insights for Williamson
- The dominant room capacity in Williamson is 1 bedroom listings, making up 54.5% of the market. This suggests a strong demand for properties suitable for couples or solo travelers.
- Together, 1 bedroom and 2 bedrooms properties represent 72.7% of the active Airbnb listings in Williamson, indicating a high concentration in these sizes.
- With over half the market (54.5%) consisting of studios or 1-bedroom units, Williamson is particularly well-suited for individuals or couples.
- A significant 22.7% of listings offer 3+ bedrooms, catering to larger groups and families seeking more space in Williamson.
Williamson Vacation Rental Guest Capacity Trends (2026)
Distribution of Listings by Guest Capacity
Guest Capacity Insights for Williamson
- The most common guest capacity trend in Williamson vacation rentals is listings accommodating 2 guests (31.8%). This suggests the primary traveler segment is likely couples or solo travelers.
- Properties designed for 2 guests and 6 guests dominate the Williamson STR market, accounting for 54.5% of listings.
- 36.3% of properties accommodate 6+ guests, serving the market segment for larger families or group travel in Williamson.
- On average, properties in Williamson are equipped to host 4.0 guests.
Williamson Airbnb Booking Patterns (2026): Available vs. Booked Days
Available Days Distribution
Booked Days Distribution
Booking Pattern Insights for Williamson
- The most common availability pattern in Williamson falls within the 181-270 days range, representing 45.5% of listings. This suggests many properties have significant open periods on their calendars.
- Approximately 72.8% of listings show high availability (181+ days open annually), indicating potential for increased bookings or specific owner usage patterns.
- For booked days, the 91-180 days range is most frequent in Williamson (50%), reflecting common guest stay durations or potential owner blocking patterns.
- A notable 27.2% of properties secure long booking periods (181+ days booked per year), highlighting successful long-term rental strategies or significant owner usage.
Williamson Airbnb Minimum Stay Requirements Analysis
Distribution of Listings by Minimum Night Requirement
1 Night
4 listings
18.2% of total
2 Nights
14 listings
63.6% of total
3 Nights
1 listings
4.5% of total
7-29 Nights
1 listings
4.5% of total
30+ Nights
2 listings
9.1% of total
Key Insights
- The most prevalent minimum stay requirement in Williamson is 2 Nights, adopted by 63.6% of listings. This highlights the market's preference for shorter, flexible bookings.
- A strong majority (81.8%) of the Williamson Airbnb data shows acceptance of very short stays (1-2 nights), indicating a dynamic, high-turnover market.
Recommendations
- Align with the market by considering a 2 Nights minimum stay, as 63.6% of Williamson hosts use this setting.
- If feasible, allowing 1-night stays, especially midweek or during low season, could capture last-minute bookings, as only 18.2% currently do.
- A 2-night minimum appears standard (63.6%). Consider this for weekends or peak periods.
- Explore offering discounts for stays of 30+ nights to attract the 9.1% of the market seeking extended stays.
- Adjust minimum nights based on seasonality – potentially shorter during low season and longer during peak demand periods in Williamson.
Williamson Airbnb Cancellation Policy Trends Analysis (2026)
Flexible
2 listings
9.1% of total
Moderate
4 listings
18.2% of total
Firm
14 listings
63.6% of total
Strict
2 listings
9.1% of total
Cancellation Policy Insights for Williamson
- The prevailing Airbnb cancellation policy trend in Williamson is Firm, used by 63.6% of listings.
- A majority (72.7%) of hosts in Williamson utilize Firm or Strict policies, indicating a market where hosts prioritize booking security.
- Strict cancellation policies are quite rare (9.1%), potentially making listings with this policy less competitive unless justified by high demand or property type.
Recommendations for Hosts
- Consider adopting a Firm policy to align with the 63.6% market standard in Williamson.
- Using a Strict policy might deter some guests, as only 9.1% of listings use it. Evaluate if potential revenue protection outweighs possible lower booking rates.
- Regularly review your cancellation policy against competitors and market demand shifts in Williamson.
Williamson STR Booking Lead Time Analysis (2026)
Average Booking Lead Time by Month
Booking Lead Time Insights for Williamson
- The overall average booking lead time for vacation rentals in Williamson is 28 days.
- Guests book furthest in advance for stays during September (average 56 days), likely coinciding with peak travel demand or local events.
- The shortest booking windows occur for stays in August (average 19 days), indicating more last-minute travel plans during this time.
- Seasonally, Fall (40 days avg.) sees the longest lead times, while Summer (27 days avg.) has the shortest, reflecting typical travel planning cycles.
Recommendations for Hosts
- Use the overall average lead time (28 days) as a baseline for your pricing and availability strategy in Williamson.
- For September stays, consider implementing length-of-stay discounts or slightly higher rates for bookings made less than 56 days out to capitalize on advance planning.
- Target marketing efforts for the Fall season well in advance (at least 40 days) to capture early planners.
- Monitor your own booking lead times against these Williamson averages to identify opportunities for dynamic pricing adjustments.
Popular & Essential Airbnb Amenities in Williamson (2026)
Amenity Prevalence
Amenity Insights for Williamson
- Essential amenities in Williamson that guests expect include: Air conditioning, Wifi, Heating, Smoke alarm, TV, Free parking on premises. Lacking these (any) could significantly impact bookings.
- Popular amenities like Essentials, Refrigerator, Dishes and silverware are common but not universal. Offering these can provide a competitive edge.
Recommendations for Hosts
- Ensure your listing includes all essential amenities for Williamson: Air conditioning, Wifi, Heating, Smoke alarm, TV, Free parking on premises.
- Prioritize adding missing essentials: Air conditioning, Wifi, Heating, Smoke alarm, TV, Free parking on premises.
- Consider adding popular differentiators like Essentials or Refrigerator to increase appeal.
- Highlight unique or less common amenities you offer (e.g., hot tub, dedicated workspace, EV charger) in your listing description and photos.
- Regularly check competitor amenities in Williamson to stay competitive.
Williamson Airbnb Guest Demographics & Profile Analysis (2026)
Guest Profile Summary for Williamson
- The typical guest profile for Airbnb in Williamson consists of primarily domestic travelers (98%), often arriving from nearby Phoenix, typically belonging to the Post-2000s (Gen Z/Alpha) group (50%), primarily speaking English or Spanish.
- Domestic travelers account for 97.7% of guests.
- Key international markets include United States (97.7%) and Canada (0.9%).
- Top languages spoken are English (77.5%) followed by Spanish (11.7%).
- A significant demographic segment is the Post-2000s (Gen Z/Alpha) group, representing 50% of guests.
Recommendations for Hosts
- Target domestic marketing efforts towards travelers from Phoenix and Scottsdale.
- Tailor amenities and listing descriptions to appeal to the dominant Post-2000s (Gen Z/Alpha) demographic (e.g., highlight fast WiFi, smart home features, local guides).
- Highlight unique local experiences or amenities relevant to the primary guest profile.
- Consider seasonal promotions aligned with peak travel times for key origin markets.
Nearby Short-Term Rental Market Comparison
How does the Williamson Airbnb market stack up against its neighbors? Compare key performance metrics like average monthly revenue, ADR, and occupancy rates in surrounding areas to understand the broader regional STR landscape.
| Market | Active Properties | Monthly Revenue | Daily Rate | Avg. Occupancy |
|---|---|---|---|---|
| Paradise Valley | 67 | $10,566 | $1242.99 | 41% |
| Sedona | 1,658 | $5,761 | $410.99 | 50% |
| Sedona City Limit | 372 | $4,884 | $333.39 | 51% |
| Fort Valley | 38 | $4,747 | $408.22 | 43% |
| Scottsdale | 4,331 | $4,202 | $370.53 | 47% |
| Doney Park | 17 | $4,085 | $299.83 | 54% |
| Carefree | 31 | $4,052 | $522.63 | 39% |
| Cave Creek | 132 | $4,016 | $399.83 | 42% |
| Red Lake | 12 | $3,899 | $257.65 | 54% |
| Kachina Village | 138 | $3,786 | $252.87 | 50% |