Williams Airbnb Market Analysis 2026: Short Term Rental Data & Vacation Rental Statistics in Arizona, United States
Is Airbnb profitable in Williams in 2026? Explore comprehensive Airbnb analytics for Williams, Arizona, United States to uncover income potential. This 2026 STR market report for Williams, based on AirROI data from February 2025 to January 2026, reveals key trends in the market of 294 active listings.
Whether you're considering an Airbnb investment in Williams, optimizing your existing vacation rental, or exploring rental arbitrage opportunities, understanding the Williams Airbnb data is crucial. Leveraging the low regulation environment is key to maximizing your short term rental income potential. Let's dive into the specifics.
Key Williams Airbnb Performance Metrics Overview
Monthly Airbnb Revenue Variations & Income Potential in Williams (2026)
Understanding the monthly revenue variations for Airbnb listings in Williams is key to maximizing your short term rental income potential. Seasonality significantly impacts earnings. Our analysis, based on data from the past 12 months, shows that the peak revenue month for STRs in Williams is typically December, while January often presents the lowest earnings, highlighting opportunities for strategic pricing adjustments during shoulder and low seasons. Explore the typical Airbnb income in Williams across different performance tiers:
- Best-in-class properties (Top 10%) achieve $6,833+ monthly, often utilizing dynamic pricing and superior guest experiences.
- Strong performing properties (Top 25%) earn $4,452 or more, indicating effective management and desirable locations/amenities.
- Typical properties (Median) generate around $2,754 per month, representing the average market performance.
- Entry-level properties (Bottom 25%) see earnings around $1,374, often with potential for optimization.
Average Monthly Airbnb Earnings Trend in Williams
Williams Airbnb Occupancy Rate Trends (2026)
Maximize your bookings by understanding the Williams STR occupancy trends. Seasonal demand shifts significantly influence how often properties are booked. Typically, Aprilsees the highest demand (peak season occupancy), while January experiences the lowest (low season). Effective strategies, like adjusting minimum stays or offering promotions, can boost occupancy during slower periods. Here's how different property tiers perform in Williams:
- Best-in-class properties (Top 10%) achieve 81%+ occupancy, indicating high desirability and potentially optimized availability.
- Strong performing properties (Top 25%) maintain 68% or higher occupancy, suggesting good market fit and guest satisfaction.
- Typical properties (Median) have an occupancy rate around 49%.
- Entry-level properties (Bottom 25%) average 27% occupancy, potentially facing higher vacancy.
Average Monthly Occupancy Rate Trend in Williams
Average Daily Rate (ADR) Airbnb Trends in Williams (2026)
Effective short term rental pricing strategy in Williams involves understanding monthly ADR fluctuations. The Average Daily Rate (ADR) for Airbnb in Williams typically peaks in December and dips lowest during February. Leveraging Airbnb dynamic pricing tools or strategies based on this seasonality can significantly boost revenue. Here's a look at the typical nightly rates achieved:
- Best-in-class properties (Top 10%) command rates of $357+ per night, often due to premium features or locations.
- Strong performing properties (Top 25%) achieve nightly rates of $257 or more.
- Typical properties (Median) charge around $181 per night.
- Entry-level properties (Bottom 25%) earn around $125 per night.
Average Daily Rate (ADR) Trend by Month in Williams
Get Live Williams Market Intelligence 👇

Explore Real-time Analytics
Airbnb Seasonality Analysis & Trends in Williams (2026)
Peak Season (December, April, March)
- Revenue averages $4,030 per month
- Occupancy rates average 54.7%
- Daily rates average $206
Shoulder Season
- Revenue averages $3,539 per month
- Occupancy maintains around 48.2%
- Daily rates hold near $214
Low Season (January, February, August)
- Revenue drops to average $2,486 per month
- Occupancy decreases to average 38.9%
- Daily rates adjust to average $192
Seasonality Insights for Williams
- The Airbnb seasonality in Williams shows moderate seasonality with distinct peak and low periods. While the sections above show seasonal averages, it's also insightful to look at the extremes:
- During the high season, the absolute peak month showcases Williams's highest earning potential, with monthly revenues capable of climbing to $4,077, occupancy reaching a high of 58.7%, and ADRs peaking at $228.
- Conversely, the slowest single month of the year, typically falling within the low season, marks the market's lowest point. In this month, revenue might dip to $2,213, occupancy could drop to 31.6%, and ADRs may adjust down to $174.
- Understanding both the seasonal averages and these monthly peaks and troughs in revenue, occupancy, and ADR is crucial for maximizing your Airbnb profit potential in Williams.
Seasonal Strategies for Maximizing Profit
- Peak Season: Maximize revenue through premium pricing and potentially longer minimum stays. Ensure high availability.
- Low Season: Offer competitive pricing, special promotions (e.g., extended stay discounts), and flexible cancellation policies. Target off-season travelers like remote workers or budget-conscious guests.
- Shoulder Seasons: Implement dynamic pricing that balances peak and low rates. Target weekend travelers or specific events. Offer slightly more flexible terms than peak season.
- Regularly analyze your own performance against these Williams seasonality benchmarks and adjust your pricing and availability strategy accordingly.
Best Areas for Airbnb Investment in Williams (2026)
Exploring the top neighborhoods for short-term rentals in Williams? This section highlights key areas, outlining why they are attractive for hosts and guests, along with notable local attractions. Consider these locations based on your target guest profile and investment strategy.
| Neighborhood / Area | Why Host Here? (Target Guests & Appeal) | Key Attractions & Landmarks |
|---|---|---|
| Grand Canyon Village | The gateway to the Grand Canyon, attracting millions of tourists each year. Perfect for nature lovers and adventure seekers looking to explore one of the natural wonders of the world. | Grand Canyon National Park, Mather Point, Bright Angel Lodge, Grand Canyon Visitor Center, South Rim Trails |
| Williams Historic Route 66 | A charming town along the historic Route 66, known for its vintage diners and local shops. Ideal for travelers wanting a nostalgic Americana experience. | Route 66 attractions, Bearizona Wildlife Park, Williams Depot, Grand Canyon Railway, Historic downtown shops |
| Bearizona | A unique drive-thru wildlife park that showcases North American animals. Great for families and wildlife enthusiasts. | Bearizona Wildlife Park, Wildlife shows, Nature trails, Petting zoo, Animal encounters |
| Kaibab National Forest | Surrounding the Grand Canyon, this forest offers stunning scenery, hiking, and outdoor activities. Perfect for those who appreciate nature and solitude. | Hiking trails, Wildlife viewing, Camping sites, Scenic drives, Stargazing |
| Coconino National Forest | A beautiful forested area with diverse landscapes, ideal for camping, hiking, and outdoor recreation. Attractive to guests looking for a peaceful getaway. | Hiking trails, Fishing spots, Scenic vistas, Pine trees, Outdoor recreation areas |
| Downtown Williams | A vibrant area with shops, restaurants, and entertainment options. Often referred to as the 'Gateway to the Grand Canyon', it attracts tourists heading to the park. | Local shops, Restaurants, Historic theaters, Williams Stagecoach, Events and festivals |
| Route 66 Museum | A museum dedicated to preserving the history of Route 66, attracting automotive enthusiasts and history buffs alike. | Route 66 memorabilia, Historic exhibits, Interactive displays, Guided tours, Gift shop |
| Seligman | A neighboring town that is also a historic Route 66 hub, known for its quirky shops and nostalgic vibe. Great for tourists taking a road trip along this iconic highway. | Route 66 Historic District, Delgadillo's Snow Cap Drive-In, Seligman Roadside Attractions, Local gift shops, Historic buildings |
Understanding Airbnb License Requirements & STR Laws in Williams (2026)
While Williams, Arizona, United States currently shows low STR regulations, specific Airbnb license requirements might still exist or change. Always verify the latest short term rental regulations and Airbnb license requirements directly with local government authorities for Williams to ensure full compliance before hosting.
(Source: AirROI data, 2026, based on 0% licensed listings)
Top Performing Airbnb Properties in Williams (2026)
Benchmark your potential! Explore examples of top-performing Airbnb properties in Williamsbased on Trailing Twelve Month (TTM) revenue. Analyze their characteristics, revenue, occupancy rate, and ADR to understand what drives success in this market.
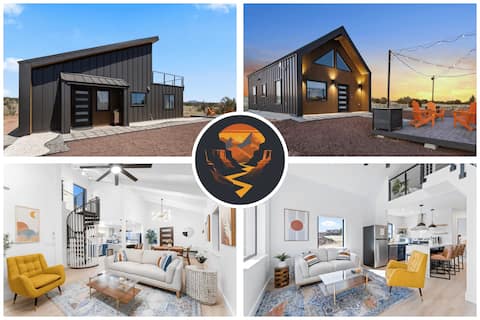
*NEW* Luxe Ranch Double Villas | Near GC S Rim
Entire Place • 5 bedrooms

Sleeps 16| Jacuzzi |Escape Room|Polar Express
Entire Place • 7 bedrooms

*NEW* Luxe Desert Retreat | Near GrandCanyon S Rim
Entire Place • 3 bedrooms

Big Bear Estate | 10 acres | Gameroom
Entire Place • 5 bedrooms
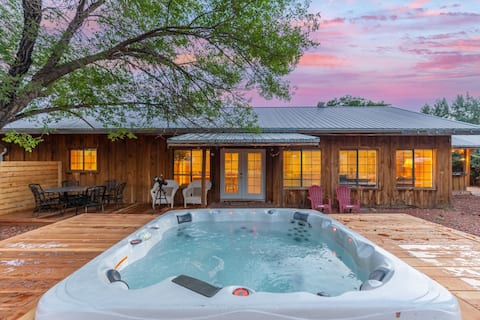
Mountain Views | Unit 1 | 5 bedrooms | Hottub
Entire Place • 5 bedrooms
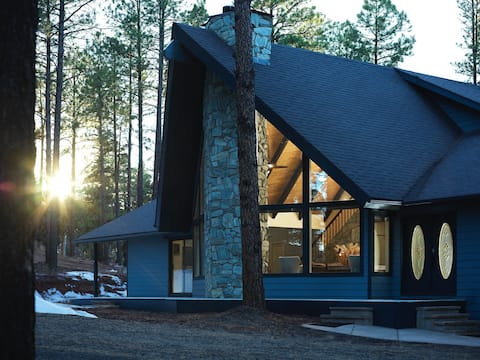
Cobalt Cabin Gateway to Grand Canyon Sedona & More
Entire Place • 3 bedrooms
Note: Performance varies based on location, size, amenities, seasonality, and management quality. Data reflects the past 12 months.
Top Performing Airbnb Hosts in Williams (2026)
Learn from the best! This table showcases top-performing Airbnb hosts in Williams based on the number of properties managed and estimated total revenue over the past year. Analyze their scale and performance metrics.
| Host Name | Properties | Grossing Revenue | Stay Reviews | Avg Rating |
|---|---|---|---|---|
| Team Harry, JD, And Sam | 30 | $680,699 | 1484 | 4.47/5.0 |
| Roman | 26 | $675,480 | 2373 | 4.76/5.0 |
| Jeff | 13 | $512,315 | 1477 | 4.91/5.0 |
| Jonathan | 11 | $499,994 | 376 | 4.89/5.0 |
| Nook Getaways Grand Canyon | 3 | $490,070 | 312 | 4.91/5.0 |
| Vijay | 21 | $389,074 | 826 | 4.46/5.0 |
| Caryn | 5 | $309,184 | 659 | 4.82/5.0 |
| Porter | 8 | $274,090 | 151 | 4.55/5.0 |
| Pat | 2 | $195,354 | 204 | 4.99/5.0 |
| Trappers | 6 | $191,790 | 257 | 4.94/5.0 |
Analyzing the strategies of top hosts, such as their property selection, pricing, and guest communication, can offer valuable lessons for optimizing your own Airbnb operations in Williams.
Dive Deeper: Advanced Williams STR Market Data (2026)
Ready to unlock more insights? AirROI provides access to advanced metrics and comprehensive Airbnb data for Williams. Explore detailed analytics beyond this report to refine your investment strategy, optimize pricing, and maximize your vacation rental profits.
Explore Advanced MetricsWilliams Short-Term Rental Market Composition (2026): Property & Room Types
Room Type Distribution
Property Type Distribution
Market Composition Insights for Williams
- The Williams Airbnb market composition is heavily skewed towards Entire Home/Apt listings, which make up 84.7% of the 294 active rentals. This indicates strong guest preference for privacy and space.
- Looking at the property type distribution in Williams, House properties are the most common (40.1%), reflecting the local real estate landscape.
- Houses represent a significant 40.1% portion, catering likely to families or larger groups.
- The presence of 14.3% Hotel/Boutique listings indicates integration with traditional hospitality.
- Smaller segments like apartment/condo, unique stays, others (combined 5.5%) offer potential for unique stay experiences.
Williams Airbnb Room Capacity Analysis (2026): Bedroom Distribution
Distribution of Listings by Number of Bedrooms
Room Capacity Insights for Williams
- The dominant room capacity in Williams is 1 bedroom listings, making up 42.2% of the market. This suggests a strong demand for properties suitable for couples or solo travelers.
- Together, 1 bedroom and 2 bedrooms properties represent 61.9% of the active Airbnb listings in Williams, indicating a high concentration in these sizes.
- A significant 30.6% of listings offer 3+ bedrooms, catering to larger groups and families seeking more space in Williams.
Williams Vacation Rental Guest Capacity Trends (2026)
Distribution of Listings by Guest Capacity
Guest Capacity Insights for Williams
- The most common guest capacity trend in Williams vacation rentals is listings accommodating 8+ guests (24.8%). This suggests the primary traveler segment is likely larger groups.
- Properties designed for 8+ guests and 2 guests dominate the Williams STR market, accounting for 47.2% of listings.
- 43.5% of properties accommodate 6+ guests, serving the market segment for larger families or group travel in Williams.
- On average, properties in Williams are equipped to host 4.7 guests.
Williams Airbnb Booking Patterns (2026): Available vs. Booked Days
Available Days Distribution
Booked Days Distribution
Booking Pattern Insights for Williams
- The most common availability pattern in Williams falls within the 181-270 days range, representing 41.8% of listings. This suggests many properties have significant open periods on their calendars.
- Approximately 67.7% of listings show high availability (181+ days open annually), indicating potential for increased bookings or specific owner usage patterns.
- For booked days, the 91-180 days range is most frequent in Williams (41.8%), reflecting common guest stay durations or potential owner blocking patterns.
- A notable 33.6% of properties secure long booking periods (181+ days booked per year), highlighting successful long-term rental strategies or significant owner usage.
Williams Airbnb Minimum Stay Requirements Analysis
Distribution of Listings by Minimum Night Requirement
1 Night
208 listings
71.2% of total
2 Nights
35 listings
12% of total
3 Nights
5 listings
1.7% of total
30+ Nights
44 listings
15.1% of total
Key Insights
- The most prevalent minimum stay requirement in Williams is 1 Night, adopted by 71.2% of listings. This highlights the market's preference for shorter, flexible bookings.
- A strong majority (83.2%) of the Williams Airbnb data shows acceptance of very short stays (1-2 nights), indicating a dynamic, high-turnover market.
- A significant segment (15.1%) caters to monthly stays (30+ nights) in Williams, pointing to opportunities in the extended-stay market.
Recommendations
- Align with the market by considering a 1 Night minimum stay, as 71.2% of Williams hosts use this setting.
- Explore offering discounts for stays of 30+ nights to attract the 15.1% of the market seeking extended stays.
- Adjust minimum nights based on seasonality – potentially shorter during low season and longer during peak demand periods in Williams.
Williams Airbnb Cancellation Policy Trends Analysis (2026)
Super Strict 30 Days
2 listings
0.7% of total
Limited
2 listings
0.7% of total
Super Strict 60 Days
3 listings
1% of total
Flexible
67 listings
22.9% of total
Moderate
103 listings
35.2% of total
Firm
59 listings
20.1% of total
Strict
57 listings
19.5% of total
Cancellation Policy Insights for Williams
- The prevailing Airbnb cancellation policy trend in Williams is Moderate, used by 35.2% of listings.
- There's a relatively balanced mix between guest-friendly (58.1%) and stricter (39.6%) policies, offering choices for different guest needs.
Recommendations for Hosts
- Consider adopting a Moderate policy to align with the 35.2% market standard in Williams.
- Regularly review your cancellation policy against competitors and market demand shifts in Williams.
Williams STR Booking Lead Time Analysis (2026)
Average Booking Lead Time by Month
Booking Lead Time Insights for Williams
- The overall average booking lead time for vacation rentals in Williams is 51 days.
- Guests book furthest in advance for stays during October (average 66 days), likely coinciding with peak travel demand or local events.
- The shortest booking windows occur for stays in January (average 29 days), indicating more last-minute travel plans during this time.
- Seasonally, Fall (60 days avg.) sees the longest lead times, while Winter (36 days avg.) has the shortest, reflecting typical travel planning cycles.
Recommendations for Hosts
- Use the overall average lead time (51 days) as a baseline for your pricing and availability strategy in Williams.
- For October stays, consider implementing length-of-stay discounts or slightly higher rates for bookings made less than 66 days out to capitalize on advance planning.
- Target marketing efforts for the Fall season well in advance (at least 60 days) to capture early planners.
- Monitor your own booking lead times against these Williams averages to identify opportunities for dynamic pricing adjustments.
Popular & Essential Airbnb Amenities in Williams (2026)
Amenity Prevalence
Amenity Insights for Williams
- Essential amenities in Williams that guests expect include: Free parking on premises. Lacking these (this) could significantly impact bookings.
- Popular amenities like Smoke alarm, Fire extinguisher, Heating are common but not universal. Offering these can provide a competitive edge.
- Warning: Wifi is not universally provided but is considered essential globally. Ensure reliable Wifi is offered.
Recommendations for Hosts
- Ensure your listing includes all essential amenities for Williams: Free parking on premises.
- Prioritize adding missing essentials: Free parking on premises.
- Consider adding popular differentiators like Smoke alarm or Fire extinguisher to increase appeal.
- Highlight unique or less common amenities you offer (e.g., hot tub, dedicated workspace, EV charger) in your listing description and photos.
- Regularly check competitor amenities in Williams to stay competitive.
Williams Airbnb Guest Demographics & Profile Analysis (2026)
Guest Profile Summary for Williams
- The typical guest profile for Airbnb in Williams consists of primarily domestic travelers (82%), often arriving from nearby Phoenix, typically belonging to the Post-2000s (Gen Z/Alpha) group (50%), primarily speaking English or Spanish.
- Domestic travelers account for 81.9% of guests.
- Key international markets include United States (81.9%) and Canada (2.5%).
- Top languages spoken are English (59.7%) followed by Spanish (14.6%).
- A significant demographic segment is the Post-2000s (Gen Z/Alpha) group, representing 50% of guests.
Recommendations for Hosts
- Target domestic marketing efforts towards travelers from Phoenix and New York.
- Tailor amenities and listing descriptions to appeal to the dominant Post-2000s (Gen Z/Alpha) demographic (e.g., highlight fast WiFi, smart home features, local guides).
- Highlight unique local experiences or amenities relevant to the primary guest profile.
- Consider seasonal promotions aligned with peak travel times for key origin markets.
Nearby Short-Term Rental Market Comparison
How does the Williams Airbnb market stack up against its neighbors? Compare key performance metrics like average monthly revenue, ADR, and occupancy rates in surrounding areas to understand the broader regional STR landscape.
| Market | Active Properties | Monthly Revenue | Daily Rate | Avg. Occupancy |
|---|---|---|---|---|
| Sedona | 1,658 | $5,761 | $410.99 | 50% |
| Sedona City Limit | 372 | $4,884 | $333.39 | 51% |
| Fort Valley | 38 | $4,747 | $408.22 | 43% |
| Doney Park | 17 | $4,085 | $299.83 | 54% |
| Red Lake | 12 | $3,899 | $257.65 | 54% |
| Kachina Village | 138 | $3,786 | $252.87 | 50% |
| Greenehaven | 48 | $3,740 | $333.15 | 44% |
| Big Park | 427 | $3,618 | $294.75 | 47% |
| Star Valley | 12 | $3,374 | $279.20 | 43% |
| Flagstaff | 1,391 | $3,353 | $281.58 | 47% |