Sierra Vista Airbnb Market Analysis 2026: Short Term Rental Data & Vacation Rental Statistics in Arizona, United States
Is Airbnb profitable in Sierra Vista in 2026? Explore comprehensive Airbnb analytics for Sierra Vista, Arizona, United States to uncover income potential. This 2026 STR market report for Sierra Vista, based on AirROI data from February 2025 to January 2026, reveals key trends in the niche market of 145 active listings.
Whether you're considering an Airbnb investment in Sierra Vista, optimizing your existing vacation rental, or exploring rental arbitrage opportunities, understanding the Sierra Vista Airbnb data is crucial. Leveraging the low regulation environment is key to maximizing your short term rental income potential. Let's dive into the specifics.
Key Sierra Vista Airbnb Performance Metrics Overview
Monthly Airbnb Revenue Variations & Income Potential in Sierra Vista (2026)
Understanding the monthly revenue variations for Airbnb listings in Sierra Vista is key to maximizing your short term rental income potential. Seasonality significantly impacts earnings. Our analysis, based on data from the past 12 months, shows that the peak revenue month for STRs in Sierra Vista is typically March, while June often presents the lowest earnings, highlighting opportunities for strategic pricing adjustments during shoulder and low seasons. Explore the typical Airbnb income in Sierra Vista across different performance tiers:
- Best-in-class properties (Top 10%) achieve $4,351+ monthly, often utilizing dynamic pricing and superior guest experiences.
- Strong performing properties (Top 25%) earn $3,136 or more, indicating effective management and desirable locations/amenities.
- Typical properties (Median) generate around $2,058 per month, representing the average market performance.
- Entry-level properties (Bottom 25%) see earnings around $1,089, often with potential for optimization.
Average Monthly Airbnb Earnings Trend in Sierra Vista
Sierra Vista Airbnb Occupancy Rate Trends (2026)
Maximize your bookings by understanding the Sierra Vista STR occupancy trends. Seasonal demand shifts significantly influence how often properties are booked. Typically, Marchsees the highest demand (peak season occupancy), while January experiences the lowest (low season). Effective strategies, like adjusting minimum stays or offering promotions, can boost occupancy during slower periods. Here's how different property tiers perform in Sierra Vista:
- Best-in-class properties (Top 10%) achieve 86%+ occupancy, indicating high desirability and potentially optimized availability.
- Strong performing properties (Top 25%) maintain 73% or higher occupancy, suggesting good market fit and guest satisfaction.
- Typical properties (Median) have an occupancy rate around 52%.
- Entry-level properties (Bottom 25%) average 30% occupancy, potentially facing higher vacancy.
Average Monthly Occupancy Rate Trend in Sierra Vista
Average Daily Rate (ADR) Airbnb Trends in Sierra Vista (2026)
Effective short term rental pricing strategy in Sierra Vista involves understanding monthly ADR fluctuations. The Average Daily Rate (ADR) for Airbnb in Sierra Vista typically peaks in October and dips lowest during April. Leveraging Airbnb dynamic pricing tools or strategies based on this seasonality can significantly boost revenue. Here's a look at the typical nightly rates achieved:
- Best-in-class properties (Top 10%) command rates of $240+ per night, often due to premium features or locations.
- Strong performing properties (Top 25%) achieve nightly rates of $169 or more.
- Typical properties (Median) charge around $126 per night.
- Entry-level properties (Bottom 25%) earn around $91 per night.
Average Daily Rate (ADR) Trend by Month in Sierra Vista
Get Live Sierra Vista Market Intelligence 👇

Explore Real-time Analytics
Airbnb Seasonality Analysis & Trends in Sierra Vista (2026)
Peak Season (March, February, May)
- Revenue averages $2,730 per month
- Occupancy rates average 61.0%
- Daily rates average $135
Shoulder Season
- Revenue averages $2,285 per month
- Occupancy maintains around 49.6%
- Daily rates hold near $147
Low Season (January, June, September)
- Revenue drops to average $2,014 per month
- Occupancy decreases to average 44.1%
- Daily rates adjust to average $147
Seasonality Insights for Sierra Vista
- The Airbnb seasonality in Sierra Vista shows moderate seasonality with distinct peak and low periods. While the sections above show seasonal averages, it's also insightful to look at the extremes:
- During the high season, the absolute peak month showcases Sierra Vista's highest earning potential, with monthly revenues capable of climbing to $2,986, occupancy reaching a high of 66.8%, and ADRs peaking at $156.
- Conversely, the slowest single month of the year, typically falling within the low season, marks the market's lowest point. In this month, revenue might dip to $2,005, occupancy could drop to 43.0%, and ADRs may adjust down to $133.
- Understanding both the seasonal averages and these monthly peaks and troughs in revenue, occupancy, and ADR is crucial for maximizing your Airbnb profit potential in Sierra Vista.
Seasonal Strategies for Maximizing Profit
- Peak Season: Maximize revenue through premium pricing and potentially longer minimum stays. Ensure high availability.
- Low Season: Offer competitive pricing, special promotions (e.g., extended stay discounts), and flexible cancellation policies. Target off-season travelers like remote workers or budget-conscious guests.
- Shoulder Seasons: Implement dynamic pricing that balances peak and low rates. Target weekend travelers or specific events. Offer slightly more flexible terms than peak season.
- Regularly analyze your own performance against these Sierra Vista seasonality benchmarks and adjust your pricing and availability strategy accordingly.
Best Areas for Airbnb Investment in Sierra Vista (2026)
Exploring the top neighborhoods for short-term rentals in Sierra Vista? This section highlights key areas, outlining why they are attractive for hosts and guests, along with notable local attractions. Consider these locations based on your target guest profile and investment strategy.
| Neighborhood / Area | Why Host Here? (Target Guests & Appeal) | Key Attractions & Landmarks |
|---|---|---|
| Historic Old Town | Charming area featuring unique boutiques and local dining options. Attracts visitors interested in the rich history and culture of Sierra Vista. | Sierra Vista Historical Society Museum, Veterans Memorial Park, Local art galleries, Chiricahua National Monument, Public art installation sites |
| The Landings | Family-friendly neighborhood close to schools and parks. Popular with families and visitors seeking a quieter atmosphere while still being close to attractions. | Buffalo Soldier Memorial Park, Parks and recreational areas, Local farmers market, Gardner Canyon, Sierra Vista Aquatic Center |
| Carr Canyon | Scenic area in the Huachuca Mountains, offering hiking and outdoor activities. Appeals to nature lovers and those seeking adventure in the outdoors. | Carr Canyon Trail, Coronado National Forest, Nature hikes, Bird watching opportunities, Picnic areas |
| Travelers Rest | A peaceful neighborhood with convenient access to nearby shopping and dining. Good choice for visitors wanting a comfortable stay with amenities. | Sierra Vista Mall, Local restaurants, Movie theaters, Arts and craft fairs, Nearby golf courses |
| Sierra Vista Town Center | Main commercial area with shopping, restaurants, and entertainment. Great for tourists wanting the conveniences of urban living. | Sierra Vista Farmers Market, Parks and recreational areas, Community events, Local dining options, Shopping centers |
| Desert Echoes | A quiet residential area ideal for longer stays, attracting business travelers and families who prefer a home-like environment. | Desert Botanical Gardens, Parks for walking and jogging, Community centers, Local grocery stores, Access to biking trails |
| Kachina Village | Beautiful location surrounded by nature, perfect for those seeking a retreat while being close to the city's amenities. | Huachuca Mountains hikes, Nature trails, Wildlife viewing spots, Scenic vistas, Local artisans and crafters |
| East Sierra Vista | A rapidly growing area with new developments and modern amenities. Appeals to visitors looking for new environments and conveniences. | Shopping centers and plazas, Local dining chains, Easy access to main roads, Community parks, Outdoor activities spots |
Understanding Airbnb License Requirements & STR Laws in Sierra Vista (2026)
While Sierra Vista, Arizona, United States currently shows low STR regulations, specific Airbnb license requirements might still exist or change. Always verify the latest short term rental regulations and Airbnb license requirements directly with local government authorities for Sierra Vista to ensure full compliance before hosting.
(Source: AirROI data, 2026, finding no licensed listings among those analyzed)
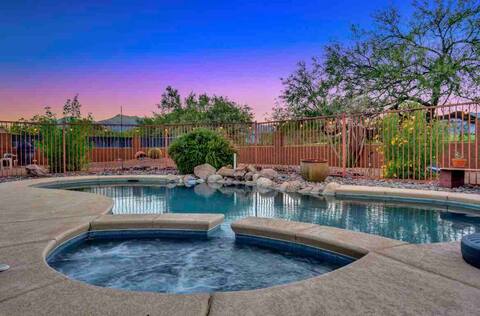
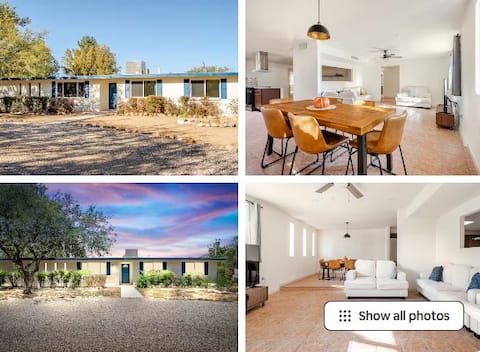
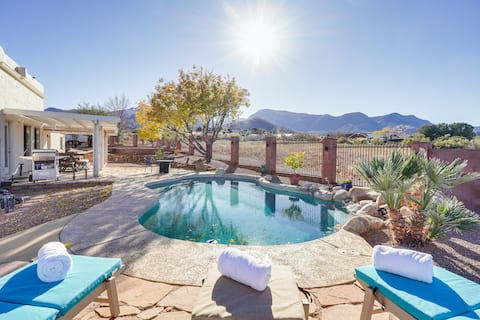
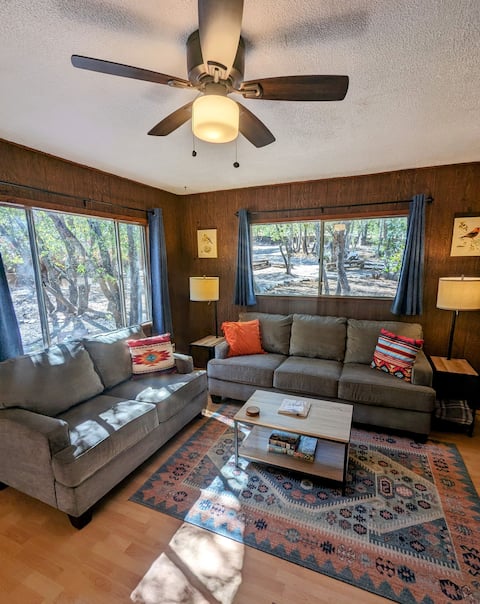
Top Performing Airbnb Properties in Sierra Vista (2026)
Benchmark your potential! Explore examples of top-performing Airbnb properties in Sierra Vistabased on Trailing Twelve Month (TTM) revenue. Analyze their characteristics, revenue, occupancy rate, and ADR to understand what drives success in this market.

*NEW* 4BR/2BTH • Pool & Grill • Central Location
Entire Place • 4 bedrooms
Mountain Vista 4 BDRM Home with Pool & Spa
Entire Place • 4 bedrooms
Cozy Clean Large 5BR/3BTH Home l Central Location
Entire Place • 5 bedrooms
Sierra Vista Home w/ Private Pool & Game Room
Entire Place • 4 bedrooms

The Atsina House
Entire Place • 4 bedrooms
Hummingbird Cabin @ Ramsey Canyon Bird Sanctuary
Entire Place • 1 bedroom
Note: Performance varies based on location, size, amenities, seasonality, and management quality. Data reflects the past 12 months.
Top Performing Airbnb Hosts in Sierra Vista (2026)
Learn from the best! This table showcases top-performing Airbnb hosts in Sierra Vista based on the number of properties managed and estimated total revenue over the past year. Analyze their scale and performance metrics.
| Host Name | Properties | Grossing Revenue | Stay Reviews | Avg Rating |
|---|---|---|---|---|
| Lasan | 5 | $183,384 | 171 | 4.95/5.0 |
| The Temark Family | 3 | $124,273 | 52 | 5.00/5.0 |
| Theresa | 7 | $117,722 | 473 | 4.99/5.0 |
| Rachel | 5 | $115,514 | 521 | 4.96/5.0 |
| Charlie | 3 | $107,801 | 158 | 4.96/5.0 |
| Jen | 3 | $98,912 | 56 | 4.81/5.0 |
| Plushy | 3 | $87,900 | 70 | 4.59/5.0 |
| Katy | 1 | $73,900 | 96 | 4.98/5.0 |
| Julie | 3 | $72,467 | 139 | 4.91/5.0 |
| Roy And Gail | 3 | $70,693 | 295 | 4.96/5.0 |
Analyzing the strategies of top hosts, such as their property selection, pricing, and guest communication, can offer valuable lessons for optimizing your own Airbnb operations in Sierra Vista.
Dive Deeper: Advanced Sierra Vista STR Market Data (2026)
Ready to unlock more insights? AirROI provides access to advanced metrics and comprehensive Airbnb data for Sierra Vista. Explore detailed analytics beyond this report to refine your investment strategy, optimize pricing, and maximize your vacation rental profits.
Explore Advanced MetricsSierra Vista Short-Term Rental Market Composition (2026): Property & Room Types
Room Type Distribution
Property Type Distribution
Market Composition Insights for Sierra Vista
- The Sierra Vista Airbnb market composition is heavily skewed towards Entire Home/Apt listings, which make up 86.9% of the 145 active rentals. This indicates strong guest preference for privacy and space.
- Looking at the property type distribution in Sierra Vista, House properties are the most common (67.6%), reflecting the local real estate landscape.
- Houses represent a significant 67.6% portion, catering likely to families or larger groups.
- The presence of 9.7% Hotel/Boutique listings indicates integration with traditional hospitality.
- Smaller segments like others, outdoor/unique, unique stays (combined 6.9%) offer potential for unique stay experiences.
Sierra Vista Airbnb Room Capacity Analysis (2026): Bedroom Distribution
Distribution of Listings by Number of Bedrooms
Room Capacity Insights for Sierra Vista
- The dominant room capacity in Sierra Vista is 3 bedrooms listings, making up 32.4% of the market. This suggests a strong demand for properties suitable for families or small groups.
- Together, 3 bedrooms and 1 bedroom properties represent 51.7% of the active Airbnb listings in Sierra Vista, indicating a high concentration in these sizes.
- A significant 44.1% of listings offer 3+ bedrooms, catering to larger groups and families seeking more space in Sierra Vista.
Sierra Vista Vacation Rental Guest Capacity Trends (2026)
Distribution of Listings by Guest Capacity
Guest Capacity Insights for Sierra Vista
- The most common guest capacity trend in Sierra Vista vacation rentals is listings accommodating 6 guests (22.1%). This suggests the primary traveler segment is likely larger groups.
- Properties designed for 6 guests and 8+ guests dominate the Sierra Vista STR market, accounting for 43.5% of listings.
- 45.6% of properties accommodate 6+ guests, serving the market segment for larger families or group travel in Sierra Vista.
- On average, properties in Sierra Vista are equipped to host 4.6 guests.
Sierra Vista Airbnb Booking Patterns (2026): Available vs. Booked Days
Available Days Distribution
Booked Days Distribution
Booking Pattern Insights for Sierra Vista
- The most common availability pattern in Sierra Vista falls within the 91-180 days range, representing 34.5% of listings. This suggests many properties have significant open periods on their calendars.
- Approximately 58.6% of listings show high availability (181+ days open annually), indicating potential for increased bookings or specific owner usage patterns.
- For booked days, the 181-270 days range is most frequent in Sierra Vista (35.9%), reflecting common guest stay durations or potential owner blocking patterns.
- A notable 42.8% of properties secure long booking periods (181+ days booked per year), highlighting successful long-term rental strategies or significant owner usage.
Sierra Vista Airbnb Minimum Stay Requirements Analysis
Distribution of Listings by Minimum Night Requirement
1 Night
39 listings
26.9% of total
2 Nights
51 listings
35.2% of total
3 Nights
3 listings
2.1% of total
4-6 Nights
9 listings
6.2% of total
7-29 Nights
5 listings
3.4% of total
30+ Nights
38 listings
26.2% of total
Key Insights
- The most prevalent minimum stay requirement in Sierra Vista is 2 Nights, adopted by 35.2% of listings. This highlights the market's preference for shorter, flexible bookings.
- A strong majority (62.1%) of the Sierra Vista Airbnb data shows acceptance of very short stays (1-2 nights), indicating a dynamic, high-turnover market.
- A significant segment (26.2%) caters to monthly stays (30+ nights) in Sierra Vista, pointing to opportunities in the extended-stay market.
Recommendations
- Align with the market by considering a 2 Nights minimum stay, as 35.2% of Sierra Vista hosts use this setting.
- If feasible, allowing 1-night stays, especially midweek or during low season, could capture last-minute bookings, as only 26.9% currently do.
- Explore offering discounts for stays of 30+ nights to attract the 26.2% of the market seeking extended stays.
- Adjust minimum nights based on seasonality – potentially shorter during low season and longer during peak demand periods in Sierra Vista.
Sierra Vista Airbnb Cancellation Policy Trends Analysis (2026)
Super Strict 30 Days
1 listings
0.7% of total
Flexible
37 listings
25.5% of total
Moderate
35 listings
24.1% of total
Firm
56 listings
38.6% of total
Strict
16 listings
11% of total
Cancellation Policy Insights for Sierra Vista
- The prevailing Airbnb cancellation policy trend in Sierra Vista is Firm, used by 38.6% of listings.
- There's a relatively balanced mix between guest-friendly (49.6%) and stricter (49.6%) policies, offering choices for different guest needs.
Recommendations for Hosts
- Consider adopting a Firm policy to align with the 38.6% market standard in Sierra Vista.
- Using a Strict policy might deter some guests, as only 11% of listings use it. Evaluate if potential revenue protection outweighs possible lower booking rates.
- Regularly review your cancellation policy against competitors and market demand shifts in Sierra Vista.
Sierra Vista STR Booking Lead Time Analysis (2026)
Average Booking Lead Time by Month
Booking Lead Time Insights for Sierra Vista
- The overall average booking lead time for vacation rentals in Sierra Vista is 47 days.
- Guests book furthest in advance for stays during February (average 73 days), likely coinciding with peak travel demand or local events.
- The shortest booking windows occur for stays in September (average 33 days), indicating more last-minute travel plans during this time.
- Seasonally, Spring (55 days avg.) sees the longest lead times, while Summer (37 days avg.) has the shortest, reflecting typical travel planning cycles.
Recommendations for Hosts
- Use the overall average lead time (47 days) as a baseline for your pricing and availability strategy in Sierra Vista.
- For February stays, consider implementing length-of-stay discounts or slightly higher rates for bookings made less than 73 days out to capitalize on advance planning.
- Target marketing efforts for the Spring season well in advance (at least 55 days) to capture early planners.
- Monitor your own booking lead times against these Sierra Vista averages to identify opportunities for dynamic pricing adjustments.
Popular & Essential Airbnb Amenities in Sierra Vista (2026)
Amenity Prevalence
Amenity Insights for Sierra Vista
- Essential amenities in Sierra Vista that guests expect include: Free parking on premises, Wifi, Smoke alarm, Air conditioning, TV, Heating. Lacking these (any) could significantly impact bookings.
- Popular amenities like Kitchen, Hangers, Coffee maker are common but not universal. Offering these can provide a competitive edge.
Recommendations for Hosts
- Ensure your listing includes all essential amenities for Sierra Vista: Free parking on premises, Wifi, Smoke alarm, Air conditioning, TV, Heating.
- Prioritize adding missing essentials: Free parking on premises, Wifi, Smoke alarm, Air conditioning, TV, Heating.
- Consider adding popular differentiators like Kitchen or Hangers to increase appeal.
- Highlight unique or less common amenities you offer (e.g., hot tub, dedicated workspace, EV charger) in your listing description and photos.
- Regularly check competitor amenities in Sierra Vista to stay competitive.
Sierra Vista Airbnb Guest Demographics & Profile Analysis (2026)
Guest Profile Summary for Sierra Vista
- The typical guest profile for Airbnb in Sierra Vista consists of primarily domestic travelers (97%), often arriving from nearby Phoenix, typically belonging to the Post-2000s (Gen Z/Alpha) group (50%), primarily speaking English or Spanish.
- Domestic travelers account for 96.8% of guests.
- Key international markets include United States (96.8%) and Canada (1%).
- Top languages spoken are English (69.5%) followed by Spanish (19.3%).
- A significant demographic segment is the Post-2000s (Gen Z/Alpha) group, representing 50% of guests.
Recommendations for Hosts
- Target domestic marketing efforts towards travelers from Phoenix and Tucson.
- Tailor amenities and listing descriptions to appeal to the dominant Post-2000s (Gen Z/Alpha) demographic (e.g., highlight fast WiFi, smart home features, local guides).
- Highlight unique local experiences or amenities relevant to the primary guest profile.
- Consider seasonal promotions aligned with peak travel times for key origin markets.
Nearby Short-Term Rental Market Comparison
How does the Sierra Vista Airbnb market stack up against its neighbors? Compare key performance metrics like average monthly revenue, ADR, and occupancy rates in surrounding areas to understand the broader regional STR landscape.
| Market | Active Properties | Monthly Revenue | Daily Rate | Avg. Occupancy |
|---|---|---|---|---|
| Mount Lemmon | 44 | $3,071 | $256.32 | 44% |
| Patagonia | 11 | $2,666 | $332.42 | 36% |
| Corona de Tucson | 16 | $2,248 | $183.94 | 50% |
| Oro Valley | 249 | $2,189 | $223.37 | 43% |
| Marana | 118 | $2,153 | $225.94 | 44% |
| Casa Grande | 176 | $2,045 | $182.24 | 44% |
| Tucson | 3,835 | $1,925 | $185.25 | 45% |
| Sahuarita | 41 | $1,910 | $178.60 | 45% |
| Elgin | 19 | $1,847 | $217.17 | 34% |
| Vail | 21 | $1,830 | $213.33 | 44% |