Sedona Airbnb Market Analysis 2026: Short Term Rental Data & Vacation Rental Statistics in Arizona, United States
Is Airbnb profitable in Sedona in 2026? Explore comprehensive Airbnb analytics for Sedona, Arizona, United States to uncover income potential. This 2026 STR market report for Sedona, based on AirROI data from February 2025 to January 2026, reveals key trends in the bustling market of 1,658 active listings.
Whether you're considering an Airbnb investment in Sedona, optimizing your existing vacation rental, or exploring rental arbitrage opportunities, understanding the Sedona Airbnb data is crucial. Leveraging the low regulation environment is key to maximizing your short term rental income potential. Let's dive into the specifics.
Key Sedona Airbnb Performance Metrics Overview
Monthly Airbnb Revenue Variations & Income Potential in Sedona (2026)
Understanding the monthly revenue variations for Airbnb listings in Sedona is key to maximizing your short term rental income potential. Seasonality significantly impacts earnings. Our analysis, based on data from the past 12 months, shows that the peak revenue month for STRs in Sedona is typically March, while August often presents the lowest earnings, highlighting opportunities for strategic pricing adjustments during shoulder and low seasons. Explore the typical Airbnb income in Sedona across different performance tiers:
- Best-in-class properties (Top 10%) achieve $14,144+ monthly, often utilizing dynamic pricing and superior guest experiences.
- Strong performing properties (Top 25%) earn $9,055 or more, indicating effective management and desirable locations/amenities.
- Typical properties (Median) generate around $5,140 per month, representing the average market performance.
- Entry-level properties (Bottom 25%) see earnings around $2,802, often with potential for optimization.
Average Monthly Airbnb Earnings Trend in Sedona
Sedona Airbnb Occupancy Rate Trends (2026)
Maximize your bookings by understanding the Sedona STR occupancy trends. Seasonal demand shifts significantly influence how often properties are booked. Typically, Marchsees the highest demand (peak season occupancy), while August experiences the lowest (low season). Effective strategies, like adjusting minimum stays or offering promotions, can boost occupancy during slower periods. Here's how different property tiers perform in Sedona:
- Best-in-class properties (Top 10%) achieve 85%+ occupancy, indicating high desirability and potentially optimized availability.
- Strong performing properties (Top 25%) maintain 73% or higher occupancy, suggesting good market fit and guest satisfaction.
- Typical properties (Median) have an occupancy rate around 54%.
- Entry-level properties (Bottom 25%) average 33% occupancy, potentially facing higher vacancy.
Average Monthly Occupancy Rate Trend in Sedona
Average Daily Rate (ADR) Airbnb Trends in Sedona (2026)
Effective short term rental pricing strategy in Sedona involves understanding monthly ADR fluctuations. The Average Daily Rate (ADR) for Airbnb in Sedona typically peaks in October and dips lowest during August. Leveraging Airbnb dynamic pricing tools or strategies based on this seasonality can significantly boost revenue. Here's a look at the typical nightly rates achieved:
- Best-in-class properties (Top 10%) command rates of $732+ per night, often due to premium features or locations.
- Strong performing properties (Top 25%) achieve nightly rates of $488 or more.
- Typical properties (Median) charge around $325 per night.
- Entry-level properties (Bottom 25%) earn around $214 per night.
Average Daily Rate (ADR) Trend by Month in Sedona
Get Live Sedona Market Intelligence 👇

Explore Real-time Analytics
Airbnb Seasonality Analysis & Trends in Sedona (2026)
Peak Season (March, April, October)
- Revenue averages $9,536 per month
- Occupancy rates average 68.2%
- Daily rates average $435
Shoulder Season
- Revenue averages $6,672 per month
- Occupancy maintains around 50.9%
- Daily rates hold near $412
Low Season (January, July, August)
- Revenue drops to average $4,870 per month
- Occupancy decreases to average 40.6%
- Daily rates adjust to average $367
Seasonality Insights for Sedona
- The Airbnb seasonality in Sedona shows highly seasonal trends requiring careful strategy. While the sections above show seasonal averages, it's also insightful to look at the extremes:
- During the high season, the absolute peak month showcases Sedona's highest earning potential, with monthly revenues capable of climbing to $10,094, occupancy reaching a high of 72.5%, and ADRs peaking at $463.
- Conversely, the slowest single month of the year, typically falling within the low season, marks the market's lowest point. In this month, revenue might dip to $4,531, occupancy could drop to 39.3%, and ADRs may adjust down to $342.
- Understanding both the seasonal averages and these monthly peaks and troughs in revenue, occupancy, and ADR is crucial for maximizing your Airbnb profit potential in Sedona.
Seasonal Strategies for Maximizing Profit
- Peak Season: Maximize revenue through premium pricing and potentially longer minimum stays. Ensure high availability.
- Low Season: Offer competitive pricing, special promotions (e.g., extended stay discounts), and flexible cancellation policies. Target off-season travelers like remote workers or budget-conscious guests.
- Shoulder Seasons: Implement dynamic pricing that balances peak and low rates. Target weekend travelers or specific events. Offer slightly more flexible terms than peak season.
- Regularly analyze your own performance against these Sedona seasonality benchmarks and adjust your pricing and availability strategy accordingly.
Best Areas for Airbnb Investment in Sedona (2026)
Exploring the top neighborhoods for short-term rentals in Sedona? This section highlights key areas, outlining why they are attractive for hosts and guests, along with notable local attractions. Consider these locations based on your target guest profile and investment strategy.
| Neighborhood / Area | Why Host Here? (Target Guests & Appeal) | Key Attractions & Landmarks |
|---|---|---|
| Uptown | Vibrant area known for its art galleries, shops, and cafes. A prime location for tourists looking to explore local culture and enjoy stunning views of Red Rock formations. | Chapel of the Holy Cross, Tlaquepaque Arts & Shopping Village, Sedona Art Center, Uptown Shopping District, Pink Jeep Tours |
| West Sedona | A beautiful residential area offering a mix of nature and community amenities. Ideal for families and nature lovers looking for a tranquil retreat. | Red Rock State Park, Coffee Pot Rock, Sedona Mountain Bike Festival, Oak Creek Canyon, Hiking Trails |
| Village of Oak Creek | A quiet community that boasts proximity to the golf courses and hiking trails. Great for those seeking a peaceful getaway with easy access to outdoor activities. | Bell Rock, Courthouse Butte Loop Trail, Oakcreek Country Club, Hiking and biking trails, Local dining options |
| Downtown Sedona | The heart of Sedona, with restaurants, shops, and galleries. It provides easy access to local attractions and is a hub for tourists. | Sedona Heritage Museum, Sedona Main Street, Art Galleries, Local Restaurants, Scenic Views |
| Sedona Red Rock District | Known for its stunning scenery and outdoor adventures, this area appeals to nature enthusiasts and those looking for a scenic retreat. | Cathedral Rock, Devil's Bridge Trail, Red Rock Scenic Byway, Hiking Trails, Photography Spots |
| Oak Creek Canyon | A scenic canyon that offers beautiful views and outdoor activities such as hiking, fishing, and picnicking. It attracts visitors looking to connect with nature. | Oak Creek Canyon Scenic Drive, Slide Rock State Park, Hiking Trails, Fishing Spots, Picnic Areas |
| Pine Valley | A lesser-known spot that offers serenity and breathtaking views, perfect for those looking to escape the crowds and enjoy nature. | Hiking Trails, Nature Photography, Peaceful Retreat, Wildlife Viewing, Scenic Overlooks |
| Red Rock Loop Road | A scenic drive that showcases some of the most famous geological formations of Sedona. Popular with tourists interested in photography and sightseeing. | Red Rock Scenic Byway, Photogenic Spots, Hiking Trails, Picnic Areas, Scenic Overlooks |
Understanding Airbnb License Requirements & STR Laws in Sedona (2026)
While Sedona, Arizona, United States currently shows low STR regulations, specific Airbnb license requirements might still exist or change. Always verify the latest short term rental regulations and Airbnb license requirements directly with local government authorities for Sedona to ensure full compliance before hosting.
(Source: AirROI data, 2026, based on 0% licensed listings)
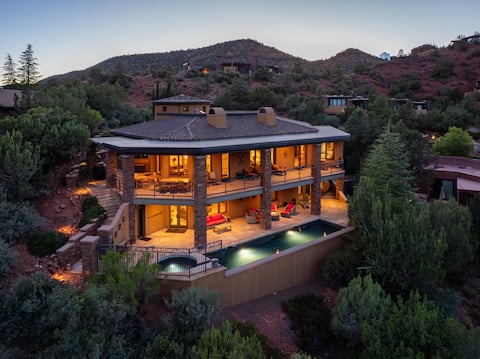
Top Performing Airbnb Properties in Sedona (2026)
Benchmark your potential! Explore examples of top-performing Airbnb properties in Sedonabased on Trailing Twelve Month (TTM) revenue. Analyze their characteristics, revenue, occupancy rate, and ADR to understand what drives success in this market.
Uptown EPIC! Wow 25Guest 2Homes 10Br 9Ba Pool 2Spa
Entire Place • 10 bedrooms
8-Bedrooms with Stunning Views & 75' Lap Pool
Entire Place • 8 bedrooms
4 homes on 4-acre GATED retreat - sleeps 30 people
Entire Place • 9 bedrooms
Grand Estate: 24 Guests* Pool* Tennis* Pickleball
Entire Place • 8 bedrooms
6,000 Sqft Uptown Gem*Heated Pool/Spa/Sauna/Decks
Entire Place • 5 bedrooms
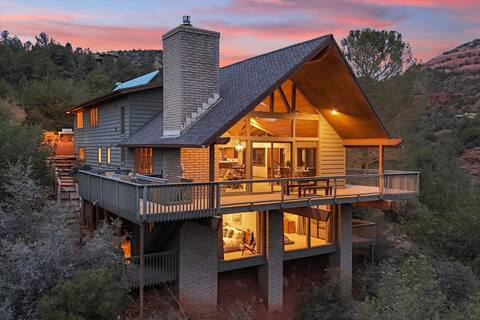
Luxury Cabin/Creek Access/Spa/EV Charger/Red Rocks
Entire Place • 5 bedrooms
Note: Performance varies based on location, size, amenities, seasonality, and management quality. Data reflects the past 12 months.
Top Performing Airbnb Hosts in Sedona (2026)
Learn from the best! This table showcases top-performing Airbnb hosts in Sedona based on the number of properties managed and estimated total revenue over the past year. Analyze their scale and performance metrics.
| Host Name | Properties | Grossing Revenue | Stay Reviews | Avg Rating |
|---|---|---|---|---|
| Sedona | 112 | $7,776,460 | 2115 | 4.89/5.0 |
| Clara | 44 | $7,155,043 | 2875 | 4.95/5.0 |
| Sedona Vacation Stays | 29 | $3,793,984 | 3931 | 4.93/5.0 |
| Victoria And Cameron | 31 | $3,337,258 | 4947 | 4.95/5.0 |
| Myrinn | 38 | $2,913,240 | 6993 | 4.88/5.0 |
| Foothills Property Management | 38 | $2,805,455 | 1933 | 4.81/5.0 |
| VacayAZ | 17 | $2,456,789 | 1009 | 4.90/5.0 |
| Mighty Tree Properties | 6 | $1,712,586 | 212 | 4.96/5.0 |
| Garrison | 4 | $1,565,734 | 235 | 4.99/5.0 |
| Porter | 12 | $1,175,720 | 826 | 4.82/5.0 |
Analyzing the strategies of top hosts, such as their property selection, pricing, and guest communication, can offer valuable lessons for optimizing your own Airbnb operations in Sedona.
Dive Deeper: Advanced Sedona STR Market Data (2026)
Ready to unlock more insights? AirROI provides access to advanced metrics and comprehensive Airbnb data for Sedona. Explore detailed analytics beyond this report to refine your investment strategy, optimize pricing, and maximize your vacation rental profits.
Explore Advanced MetricsSedona Short-Term Rental Market Composition (2026): Property & Room Types
Room Type Distribution
Property Type Distribution
Market Composition Insights for Sedona
- The Sedona Airbnb market composition is heavily skewed towards Entire Home/Apt listings, which make up 94.6% of the 1,658 active rentals. This indicates strong guest preference for privacy and space.
- Looking at the property type distribution in Sedona, House properties are the most common (66.4%), reflecting the local real estate landscape.
- Houses represent a significant 66.4% portion, catering likely to families or larger groups.
- The presence of 8% Hotel/Boutique listings indicates integration with traditional hospitality.
- Smaller segments like unique stays (combined 0.2%) offer potential for unique stay experiences.
Sedona Airbnb Room Capacity Analysis (2026): Bedroom Distribution
Distribution of Listings by Number of Bedrooms
Room Capacity Insights for Sedona
- The dominant room capacity in Sedona is 3 bedrooms listings, making up 30.1% of the market. This suggests a strong demand for properties suitable for families or small groups.
- Together, 3 bedrooms and 1 bedroom properties represent 55.1% of the active Airbnb listings in Sedona, indicating a high concentration in these sizes.
- A significant 47.3% of listings offer 3+ bedrooms, catering to larger groups and families seeking more space in Sedona.
Sedona Vacation Rental Guest Capacity Trends (2026)
Distribution of Listings by Guest Capacity
Guest Capacity Insights for Sedona
- The most common guest capacity trend in Sedona vacation rentals is listings accommodating 8+ guests (28.5%). This suggests the primary traveler segment is likely larger groups.
- Properties designed for 8+ guests and 6 guests dominate the Sedona STR market, accounting for 54.3% of listings.
- 56.9% of properties accommodate 6+ guests, serving the market segment for larger families or group travel in Sedona.
- On average, properties in Sedona are equipped to host 5.3 guests.
Sedona Airbnb Booking Patterns (2026): Available vs. Booked Days
Available Days Distribution
Booked Days Distribution
Booking Pattern Insights for Sedona
- The most common availability pattern in Sedona falls within the 181-270 days range, representing 32.5% of listings. This suggests many properties have significant open periods on their calendars.
- Approximately 57.4% of listings show high availability (181+ days open annually), indicating potential for increased bookings or specific owner usage patterns.
- For booked days, the 181-270 days range is most frequent in Sedona (32.5%), reflecting common guest stay durations or potential owner blocking patterns.
- A notable 44.1% of properties secure long booking periods (181+ days booked per year), highlighting successful long-term rental strategies or significant owner usage.
Sedona Airbnb Minimum Stay Requirements Analysis
Distribution of Listings by Minimum Night Requirement
1 Night
279 listings
16.8% of total
2 Nights
502 listings
30.3% of total
3 Nights
72 listings
4.3% of total
4-6 Nights
19 listings
1.1% of total
7-29 Nights
22 listings
1.3% of total
30+ Nights
763 listings
46% of total
Key Insights
- The most prevalent minimum stay requirement in Sedona is 30+ Nights, adopted by 46% of listings. This highlights the market's preference for longer commitments.
- A significant segment (46%) caters to monthly stays (30+ nights) in Sedona, pointing to opportunities in the extended-stay market.
Recommendations
- Align with the market by considering a 30+ Nights minimum stay, as 46% of Sedona hosts use this setting.
- If feasible, allowing 1-night stays, especially midweek or during low season, could capture last-minute bookings, as only 16.8% currently do.
- A 2-night minimum appears standard (30.3%). Consider this for weekends or peak periods.
- Explore offering discounts for stays of 30+ nights to attract the 46% of the market seeking extended stays.
- Adjust minimum nights based on seasonality – potentially shorter during low season and longer during peak demand periods in Sedona.
Sedona Airbnb Cancellation Policy Trends Analysis (2026)
Super Strict 30 Days
159 listings
9.6% of total
Super Strict 60 Days
38 listings
2.3% of total
Refundable
1 listings
0.1% of total
Non-refundable
1 listings
0.1% of total
Limited
111 listings
6.7% of total
Flexible
120 listings
7.2% of total
Moderate
381 listings
23% of total
Firm
631 listings
38.1% of total
Strict
215 listings
13% of total
Cancellation Policy Insights for Sedona
- The prevailing Airbnb cancellation policy trend in Sedona is Firm, used by 38.1% of listings.
- A majority (51.1%) of hosts in Sedona utilize Firm or Strict policies, indicating a market where hosts prioritize booking security.
Recommendations for Hosts
- Consider adopting a Firm policy to align with the 38.1% market standard in Sedona.
- Using a Strict policy might deter some guests, as only 13% of listings use it. Evaluate if potential revenue protection outweighs possible lower booking rates.
- Regularly review your cancellation policy against competitors and market demand shifts in Sedona.
Sedona STR Booking Lead Time Analysis (2026)
Average Booking Lead Time by Month
Booking Lead Time Insights for Sedona
- The overall average booking lead time for vacation rentals in Sedona is 54 days.
- Guests book furthest in advance for stays during October (average 75 days), likely coinciding with peak travel demand or local events.
- The shortest booking windows occur for stays in July (average 36 days), indicating more last-minute travel plans during this time.
- Seasonally, Fall (71 days avg.) sees the longest lead times, while Summer (41 days avg.) has the shortest, reflecting typical travel planning cycles.
Recommendations for Hosts
- Use the overall average lead time (54 days) as a baseline for your pricing and availability strategy in Sedona.
- For October stays, consider implementing length-of-stay discounts or slightly higher rates for bookings made less than 75 days out to capitalize on advance planning.
- Target marketing efforts for the Fall season well in advance (at least 71 days) to capture early planners.
- Monitor your own booking lead times against these Sedona averages to identify opportunities for dynamic pricing adjustments.
Popular & Essential Airbnb Amenities in Sedona (2026)
Amenity Prevalence
Amenity Insights for Sedona
- Essential amenities in Sedona that guests expect include: Air conditioning, Wifi, Smoke alarm, Heating, Free parking on premises. Lacking these (any) could significantly impact bookings.
- Popular amenities like TV, Coffee maker, Hot water are common but not universal. Offering these can provide a competitive edge.
Recommendations for Hosts
- Ensure your listing includes all essential amenities for Sedona: Air conditioning, Wifi, Smoke alarm, Heating, Free parking on premises.
- Prioritize adding missing essentials: Air conditioning, Wifi, Smoke alarm, Heating, Free parking on premises.
- Consider adding popular differentiators like TV or Coffee maker to increase appeal.
- Highlight unique or less common amenities you offer (e.g., hot tub, dedicated workspace, EV charger) in your listing description and photos.
- Regularly check competitor amenities in Sedona to stay competitive.
Sedona Airbnb Guest Demographics & Profile Analysis (2026)
Guest Profile Summary for Sedona
- The typical guest profile for Airbnb in Sedona consists of primarily domestic travelers (94%), often arriving from nearby Phoenix, typically belonging to the Post-2000s (Gen Z/Alpha) group (50%), primarily speaking English or Spanish.
- Domestic travelers account for 94.4% of guests.
- Key international markets include United States (94.4%) and Canada (1.8%).
- Top languages spoken are English (68.7%) followed by Spanish (14.5%).
- A significant demographic segment is the Post-2000s (Gen Z/Alpha) group, representing 50% of guests.
Recommendations for Hosts
- Target domestic marketing efforts towards travelers from Phoenix and New York.
- Tailor amenities and listing descriptions to appeal to the dominant Post-2000s (Gen Z/Alpha) demographic (e.g., highlight fast WiFi, smart home features, local guides).
- Highlight unique local experiences or amenities relevant to the primary guest profile.
- Consider seasonal promotions aligned with peak travel times for key origin markets.
Nearby Short-Term Rental Market Comparison
How does the Sedona Airbnb market stack up against its neighbors? Compare key performance metrics like average monthly revenue, ADR, and occupancy rates in surrounding areas to understand the broader regional STR landscape.
| Market | Active Properties | Monthly Revenue | Daily Rate | Avg. Occupancy |
|---|---|---|---|---|
| Paradise Valley | 67 | $10,566 | $1242.99 | 41% |
| Sedona City Limit | 372 | $4,884 | $333.39 | 51% |
| Fort Valley | 38 | $4,747 | $408.22 | 43% |
| Scottsdale | 4,331 | $4,202 | $370.53 | 47% |
| Doney Park | 17 | $4,085 | $299.83 | 54% |
| Carefree | 31 | $4,052 | $522.63 | 39% |
| Cave Creek | 132 | $4,016 | $399.83 | 42% |
| Red Lake | 12 | $3,899 | $257.65 | 54% |
| Kachina Village | 138 | $3,786 | $252.87 | 50% |
| Big Park | 427 | $3,618 | $294.75 | 47% |