Queen Creek Airbnb Market Analysis 2026: Short Term Rental Data & Vacation Rental Statistics in Arizona, United States
Is Airbnb profitable in Queen Creek in 2026? Explore comprehensive Airbnb analytics for Queen Creek, Arizona, United States to uncover income potential. This 2026 STR market report for Queen Creek, based on AirROI data from February 2025 to January 2026, reveals key trends in the niche market of 193 active listings.
Whether you're considering an Airbnb investment in Queen Creek, optimizing your existing vacation rental, or exploring rental arbitrage opportunities, understanding the Queen Creek Airbnb data is crucial. Leveraging the low regulation environment is key to maximizing your short term rental income potential. Let's dive into the specifics.
Key Queen Creek Airbnb Performance Metrics Overview
Monthly Airbnb Revenue Variations & Income Potential in Queen Creek (2026)
Understanding the monthly revenue variations for Airbnb listings in Queen Creek is key to maximizing your short term rental income potential. Seasonality significantly impacts earnings. Our analysis, based on data from the past 12 months, shows that the peak revenue month for STRs in Queen Creek is typically March, while September often presents the lowest earnings, highlighting opportunities for strategic pricing adjustments during shoulder and low seasons. Explore the typical Airbnb income in Queen Creek across different performance tiers:
- Best-in-class properties (Top 10%) achieve $6,677+ monthly, often utilizing dynamic pricing and superior guest experiences.
- Strong performing properties (Top 25%) earn $4,385 or more, indicating effective management and desirable locations/amenities.
- Typical properties (Median) generate around $2,532 per month, representing the average market performance.
- Entry-level properties (Bottom 25%) see earnings around $1,443, often with potential for optimization.
Average Monthly Airbnb Earnings Trend in Queen Creek
Queen Creek Airbnb Occupancy Rate Trends (2026)
Maximize your bookings by understanding the Queen Creek STR occupancy trends. Seasonal demand shifts significantly influence how often properties are booked. Typically, Marchsees the highest demand (peak season occupancy), while September experiences the lowest (low season). Effective strategies, like adjusting minimum stays or offering promotions, can boost occupancy during slower periods. Here's how different property tiers perform in Queen Creek:
- Best-in-class properties (Top 10%) achieve 81%+ occupancy, indicating high desirability and potentially optimized availability.
- Strong performing properties (Top 25%) maintain 66% or higher occupancy, suggesting good market fit and guest satisfaction.
- Typical properties (Median) have an occupancy rate around 48%.
- Entry-level properties (Bottom 25%) average 29% occupancy, potentially facing higher vacancy.
Average Monthly Occupancy Rate Trend in Queen Creek
Average Daily Rate (ADR) Airbnb Trends in Queen Creek (2026)
Effective short term rental pricing strategy in Queen Creek involves understanding monthly ADR fluctuations. The Average Daily Rate (ADR) for Airbnb in Queen Creek typically peaks in January and dips lowest during August. Leveraging Airbnb dynamic pricing tools or strategies based on this seasonality can significantly boost revenue. Here's a look at the typical nightly rates achieved:
- Best-in-class properties (Top 10%) command rates of $396+ per night, often due to premium features or locations.
- Strong performing properties (Top 25%) achieve nightly rates of $288 or more.
- Typical properties (Median) charge around $189 per night.
- Entry-level properties (Bottom 25%) earn around $115 per night.
Average Daily Rate (ADR) Trend by Month in Queen Creek
Get Live Queen Creek Market Intelligence 👇

Explore Real-time Analytics
Airbnb Seasonality Analysis & Trends in Queen Creek (2026)
Peak Season (March, February, November)
- Revenue averages $4,530 per month
- Occupancy rates average 63.5%
- Daily rates average $228
Shoulder Season
- Revenue averages $3,219 per month
- Occupancy maintains around 45.5%
- Daily rates hold near $222
Low Season (June, July, September)
- Revenue drops to average $2,312 per month
- Occupancy decreases to average 36.3%
- Daily rates adjust to average $209
Seasonality Insights for Queen Creek
- The Airbnb seasonality in Queen Creek shows highly seasonal trends requiring careful strategy. While the sections above show seasonal averages, it's also insightful to look at the extremes:
- During the high season, the absolute peak month showcases Queen Creek's highest earning potential, with monthly revenues capable of climbing to $5,241, occupancy reaching a high of 72.2%, and ADRs peaking at $241.
- Conversely, the slowest single month of the year, typically falling within the low season, marks the market's lowest point. In this month, revenue might dip to $2,057, occupancy could drop to 32.2%, and ADRs may adjust down to $203.
- Understanding both the seasonal averages and these monthly peaks and troughs in revenue, occupancy, and ADR is crucial for maximizing your Airbnb profit potential in Queen Creek.
Seasonal Strategies for Maximizing Profit
- Peak Season: Maximize revenue through premium pricing and potentially longer minimum stays. Ensure high availability.
- Low Season: Offer competitive pricing, special promotions (e.g., extended stay discounts), and flexible cancellation policies. Target off-season travelers like remote workers or budget-conscious guests.
- Shoulder Seasons: Implement dynamic pricing that balances peak and low rates. Target weekend travelers or specific events. Offer slightly more flexible terms than peak season.
- Regularly analyze your own performance against these Queen Creek seasonality benchmarks and adjust your pricing and availability strategy accordingly.
Best Areas for Airbnb Investment in Queen Creek (2026)
Exploring the top neighborhoods for short-term rentals in Queen Creek? This section highlights key areas, outlining why they are attractive for hosts and guests, along with notable local attractions. Consider these locations based on your target guest profile and investment strategy.
| Neighborhood / Area | Why Host Here? (Target Guests & Appeal) | Key Attractions & Landmarks |
|---|---|---|
| East Queen Creek | A growing community with new amenities and developments. Family-friendly and close to outdoor activities. Popular for those visiting San Tan Mountain Regional Park and nearby golf courses. | San Tan Mountain Regional Park, Queen Creek Olive Mill, Horseshoe Park & Equestrian Centre, Coolidge Historical Museum, Golf at San Tan Valley |
| Queen Creek Marketplace | A vibrant shopping and dining area that attracts visitors from around the region. Great for short stays due to its variety of shops, restaurants, and entertainment options. | Queen Creek Marketplace, Harkins Theatres Queen Creek, Local dining spots, Shops and boutiques, Children's Park |
| San Tan Heights | A residential area with stunning views of the San Tan Mountains. Increasingly popular among families and outdoor enthusiasts. | San Tan Mountains, Local parks and trails, Dirtbike and ATV parks, Family-friendly events, Community recreational activities |
| Circle Cross Ranch | An up-and-coming neighborhood with affordable housing and close proximity to schools and parks. Attractive for families and seasonal visitors. | Circle Cross Ranch Park, Veteran's Park, Local schools, Playgrounds, Community events |
| San Tan Valley | A large suburban area with a variety of amenities, ideal for families and those looking for affordable accommodations. Close to nature and recreation. | Pinal County Historical Museum, Golf courses, Local hiking and biking trails, Community events, Family-friendly facilities |
| Queen Creek Historical District | Rich in history and charm, this area attracts visitors interested in local culture and heritage. Features unique shops and heritage sites. | Queen Creek Museum, Local historic sites, Antique shopping, Cultural events, Art galleries |
| Verrado | A master-planned community known for its beautiful architecture and amenities. Suitable for those who appreciate a well-designed environment. | Golf at Verrado Golf Club, Community parks, Walking trails, Local dining and shopping, Community events |
| Cooley Station | A modern neighborhood with fast access to Queen Creek and Gilbert. Popular among younger families and those seeking new developments. | Community parks, Local shops, Dining options, Close to schools, Family-friendly activities |
Understanding Airbnb License Requirements & STR Laws in Queen Creek (2026)
While Queen Creek, Arizona, United States currently shows low STR regulations, specific Airbnb license requirements might still exist or change. Always verify the latest short term rental regulations and Airbnb license requirements directly with local government authorities for Queen Creek to ensure full compliance before hosting.
(Source: AirROI data, 2026, finding no licensed listings among those analyzed)
Top Performing Airbnb Properties in Queen Creek (2026)
Benchmark your potential! Explore examples of top-performing Airbnb properties in Queen Creekbased on Trailing Twelve Month (TTM) revenue. Analyze their characteristics, revenue, occupancy rate, and ADR to understand what drives success in this market.
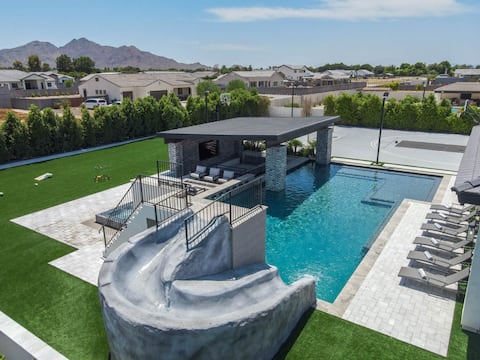
Lux Family Villa: Pool/Spa Basketball & Pickleball
Entire Place • 5 bedrooms
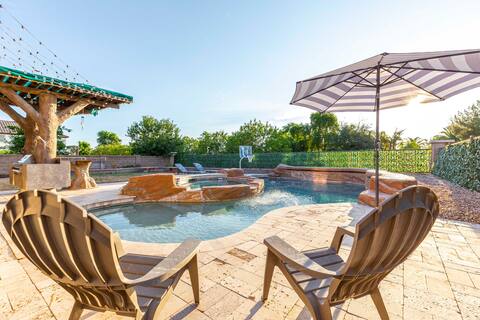
5 Bedroom Desert Family Oasis w/ Heated Pool
Entire Place • 5 bedrooms

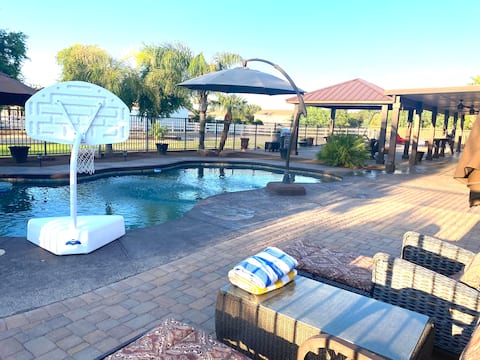
Piece of Paradise in the Valley with Amazing Pool!
Entire Place • 6 bedrooms
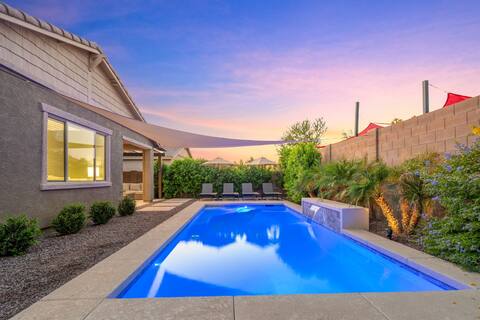
•Relaxing Queen Creek Getaway•
Entire Place • 5 bedrooms
Stunning 5BR Home w/ Heated Pool!
Entire Place • 5 bedrooms
Heated Pool/Spa. Putting. Family Fun in the Sun.
Entire Place • 4 bedrooms
Note: Performance varies based on location, size, amenities, seasonality, and management quality. Data reflects the past 12 months.
Top Performing Airbnb Hosts in Queen Creek (2026)
Learn from the best! This table showcases top-performing Airbnb hosts in Queen Creek based on the number of properties managed and estimated total revenue over the past year. Analyze their scale and performance metrics.
| Host Name | Properties | Grossing Revenue | Stay Reviews | Avg Rating |
|---|---|---|---|---|
| Pete & Maria | 2 | $280,876 | 24 | 4.95/5.0 |
| Elite Vacation Rentals | 7 | $245,638 | 165 | 4.71/5.0 |
| Evolve | 6 | $210,325 | 168 | 4.84/5.0 |
| Evolve | 5 | $176,027 | 63 | 4.84/5.0 |
| Jeremy | 1 | $109,922 | 103 | 4.98/5.0 |
| Shauna | 2 | $107,981 | 268 | 4.96/5.0 |
| Sheila | 1 | $104,168 | 66 | 4.71/5.0 |
| Allison | 1 | $101,415 | 35 | 4.91/5.0 |
| Vince | 1 | $97,591 | 81 | 5.00/5.0 |
| Morgan | 2 | $97,012 | 134 | 4.91/5.0 |
Analyzing the strategies of top hosts, such as their property selection, pricing, and guest communication, can offer valuable lessons for optimizing your own Airbnb operations in Queen Creek.
Dive Deeper: Advanced Queen Creek STR Market Data (2026)
Ready to unlock more insights? AirROI provides access to advanced metrics and comprehensive Airbnb data for Queen Creek. Explore detailed analytics beyond this report to refine your investment strategy, optimize pricing, and maximize your vacation rental profits.
Explore Advanced MetricsQueen Creek Short-Term Rental Market Composition (2026): Property & Room Types
Room Type Distribution
Property Type Distribution
Market Composition Insights for Queen Creek
- The Queen Creek Airbnb market composition is heavily skewed towards Entire Home/Apt listings, which make up 91.2% of the 193 active rentals. This indicates strong guest preference for privacy and space.
- Looking at the property type distribution in Queen Creek, House properties are the most common (68.9%), reflecting the local real estate landscape.
- Houses represent a significant 68.9% portion, catering likely to families or larger groups.
- The presence of 14.5% Hotel/Boutique listings indicates integration with traditional hospitality.
- Smaller segments like outdoor/unique, apartment/condo (combined 6.2%) offer potential for unique stay experiences.
Queen Creek Airbnb Room Capacity Analysis (2026): Bedroom Distribution
Distribution of Listings by Number of Bedrooms
Room Capacity Insights for Queen Creek
- The dominant room capacity in Queen Creek is 1 bedroom listings, making up 26.9% of the market. This suggests a strong demand for properties suitable for couples or solo travelers.
- Together, 1 bedroom and 4 bedrooms properties represent 49.2% of the active Airbnb listings in Queen Creek, indicating a high concentration in these sizes.
- A significant 56.5% of listings offer 3+ bedrooms, catering to larger groups and families seeking more space in Queen Creek.
Queen Creek Vacation Rental Guest Capacity Trends (2026)
Distribution of Listings by Guest Capacity
Guest Capacity Insights for Queen Creek
- The most common guest capacity trend in Queen Creek vacation rentals is listings accommodating 8+ guests (37.8%). This suggests the primary traveler segment is likely larger groups.
- Properties designed for 8+ guests and 2 guests dominate the Queen Creek STR market, accounting for 56.5% of listings.
- 55.9% of properties accommodate 6+ guests, serving the market segment for larger families or group travel in Queen Creek.
- On average, properties in Queen Creek are equipped to host 5.2 guests.
Queen Creek Airbnb Booking Patterns (2026): Available vs. Booked Days
Available Days Distribution
Booked Days Distribution
Booking Pattern Insights for Queen Creek
- The most common availability pattern in Queen Creek falls within the 271-366 days range, representing 37.8% of listings. This suggests many properties have significant open periods on their calendars.
- Approximately 71.0% of listings show high availability (181+ days open annually), indicating potential for increased bookings or specific owner usage patterns.
- For booked days, the 91-180 days range is most frequent in Queen Creek (33.2%), reflecting common guest stay durations or potential owner blocking patterns.
- A notable 30.0% of properties secure long booking periods (181+ days booked per year), highlighting successful long-term rental strategies or significant owner usage.
Queen Creek Airbnb Minimum Stay Requirements Analysis
Distribution of Listings by Minimum Night Requirement
1 Night
37 listings
19.2% of total
2 Nights
46 listings
23.8% of total
3 Nights
16 listings
8.3% of total
4-6 Nights
24 listings
12.4% of total
7-29 Nights
13 listings
6.7% of total
30+ Nights
57 listings
29.5% of total
Key Insights
- The most prevalent minimum stay requirement in Queen Creek is 30+ Nights, adopted by 29.5% of listings. This highlights the market's preference for longer commitments.
- A significant segment (29.5%) caters to monthly stays (30+ nights) in Queen Creek, pointing to opportunities in the extended-stay market.
Recommendations
- Align with the market by considering a 30+ Nights minimum stay, as 29.5% of Queen Creek hosts use this setting.
- If feasible, allowing 1-night stays, especially midweek or during low season, could capture last-minute bookings, as only 19.2% currently do.
- Explore offering discounts for stays of 30+ nights to attract the 29.5% of the market seeking extended stays.
- Adjust minimum nights based on seasonality – potentially shorter during low season and longer during peak demand periods in Queen Creek.
Queen Creek Airbnb Cancellation Policy Trends Analysis (2026)
Limited
5 listings
2.6% of total
Super Strict 60 Days
1 listings
0.5% of total
Super Strict 30 Days
5 listings
2.6% of total
Flexible
41 listings
21.4% of total
Moderate
39 listings
20.3% of total
Firm
72 listings
37.5% of total
Strict
29 listings
15.1% of total
Cancellation Policy Insights for Queen Creek
- The prevailing Airbnb cancellation policy trend in Queen Creek is Firm, used by 37.5% of listings.
- A majority (52.6%) of hosts in Queen Creek utilize Firm or Strict policies, indicating a market where hosts prioritize booking security.
Recommendations for Hosts
- Consider adopting a Firm policy to align with the 37.5% market standard in Queen Creek.
- Regularly review your cancellation policy against competitors and market demand shifts in Queen Creek.
Queen Creek STR Booking Lead Time Analysis (2026)
Average Booking Lead Time by Month
Booking Lead Time Insights for Queen Creek
- The overall average booking lead time for vacation rentals in Queen Creek is 52 days.
- Guests book furthest in advance for stays during February (average 76 days), likely coinciding with peak travel demand or local events.
- The shortest booking windows occur for stays in August (average 27 days), indicating more last-minute travel plans during this time.
- Seasonally, Winter (65 days avg.) sees the longest lead times, while Summer (30 days avg.) has the shortest, reflecting typical travel planning cycles.
Recommendations for Hosts
- Use the overall average lead time (52 days) as a baseline for your pricing and availability strategy in Queen Creek.
- For February stays, consider implementing length-of-stay discounts or slightly higher rates for bookings made less than 76 days out to capitalize on advance planning.
- Target marketing efforts for the Winter season well in advance (at least 65 days) to capture early planners.
- Monitor your own booking lead times against these Queen Creek averages to identify opportunities for dynamic pricing adjustments.
Popular & Essential Airbnb Amenities in Queen Creek (2026)
Amenity Prevalence
Amenity Insights for Queen Creek
- Essential amenities in Queen Creek that guests expect include: Air conditioning, Smoke alarm, Wifi, TV, Free parking on premises. Lacking these (any) could significantly impact bookings.
- Popular amenities like Heating, Hot water, Coffee maker are common but not universal. Offering these can provide a competitive edge.
Recommendations for Hosts
- Ensure your listing includes all essential amenities for Queen Creek: Air conditioning, Smoke alarm, Wifi, TV, Free parking on premises.
- Prioritize adding missing essentials: Smoke alarm, Wifi, TV, Free parking on premises.
- Consider adding popular differentiators like Heating or Hot water to increase appeal.
- Highlight unique or less common amenities you offer (e.g., hot tub, dedicated workspace, EV charger) in your listing description and photos.
- Regularly check competitor amenities in Queen Creek to stay competitive.
Queen Creek Airbnb Guest Demographics & Profile Analysis (2026)
Guest Profile Summary for Queen Creek
- The typical guest profile for Airbnb in Queen Creek consists of primarily domestic travelers (96%), often arriving from nearby Queen Creek, typically belonging to the Post-2000s (Gen Z/Alpha) group (50%), primarily speaking English or Spanish.
- Domestic travelers account for 96.2% of guests.
- Key international markets include United States (96.2%) and Canada (2.3%).
- Top languages spoken are English (74.9%) followed by Spanish (15.5%).
- A significant demographic segment is the Post-2000s (Gen Z/Alpha) group, representing 50% of guests.
Recommendations for Hosts
- Target domestic marketing efforts towards travelers from Queen Creek and Phoenix.
- Tailor amenities and listing descriptions to appeal to the dominant Post-2000s (Gen Z/Alpha) demographic (e.g., highlight fast WiFi, smart home features, local guides).
- Highlight unique local experiences or amenities relevant to the primary guest profile.
- Consider seasonal promotions aligned with peak travel times for key origin markets.
Nearby Short-Term Rental Market Comparison
How does the Queen Creek Airbnb market stack up against its neighbors? Compare key performance metrics like average monthly revenue, ADR, and occupancy rates in surrounding areas to understand the broader regional STR landscape.
| Market | Active Properties | Monthly Revenue | Daily Rate | Avg. Occupancy |
|---|---|---|---|---|
| Paradise Valley | 67 | $10,566 | $1242.99 | 41% |
| Sedona | 1,658 | $5,761 | $410.99 | 50% |
| Sedona City Limit | 372 | $4,884 | $333.39 | 51% |
| Scottsdale | 4,331 | $4,202 | $370.53 | 47% |
| Carefree | 31 | $4,052 | $522.63 | 39% |
| Cave Creek | 132 | $4,016 | $399.83 | 42% |
| Big Park | 427 | $3,618 | $294.75 | 47% |
| Fountain Hills | 215 | $3,506 | $356.69 | 45% |
| Star Valley | 12 | $3,374 | $279.20 | 43% |
| Payson town limits | 44 | $3,258 | $293.23 | 44% |