Phoenix Airbnb Market Analysis 2026: Short Term Rental Data & Vacation Rental Statistics in Arizona, United States
Is Airbnb profitable in Phoenix in 2026? Explore comprehensive Airbnb analytics for Phoenix, Arizona, United States to uncover income potential. This 2026 STR market report for Phoenix, based on AirROI data from February 2025 to January 2026, reveals key trends in the bustling market of 5,932 active listings.
Whether you're considering an Airbnb investment in Phoenix, optimizing your existing vacation rental, or exploring rental arbitrage opportunities, understanding the Phoenix Airbnb data is crucial. Leveraging the low regulation environment is key to maximizing your short term rental income potential. Let's dive into the specifics.
Key Phoenix Airbnb Performance Metrics Overview
Monthly Airbnb Revenue Variations & Income Potential in Phoenix (2026)
Understanding the monthly revenue variations for Airbnb listings in Phoenix is key to maximizing your short term rental income potential. Seasonality significantly impacts earnings. Our analysis, based on data from the past 12 months, shows that the peak revenue month for STRs in Phoenix is typically March, while September often presents the lowest earnings, highlighting opportunities for strategic pricing adjustments during shoulder and low seasons. Explore the typical Airbnb income in Phoenix across different performance tiers:
- Best-in-class properties (Top 10%) achieve $9,027+ monthly, often utilizing dynamic pricing and superior guest experiences.
- Strong performing properties (Top 25%) earn $5,220 or more, indicating effective management and desirable locations/amenities.
- Typical properties (Median) generate around $2,840 per month, representing the average market performance.
- Entry-level properties (Bottom 25%) see earnings around $1,401, often with potential for optimization.
Average Monthly Airbnb Earnings Trend in Phoenix
Phoenix Airbnb Occupancy Rate Trends (2026)
Maximize your bookings by understanding the Phoenix STR occupancy trends. Seasonal demand shifts significantly influence how often properties are booked. Typically, Marchsees the highest demand (peak season occupancy), while September experiences the lowest (low season). Effective strategies, like adjusting minimum stays or offering promotions, can boost occupancy during slower periods. Here's how different property tiers perform in Phoenix:
- Best-in-class properties (Top 10%) achieve 84%+ occupancy, indicating high desirability and potentially optimized availability.
- Strong performing properties (Top 25%) maintain 70% or higher occupancy, suggesting good market fit and guest satisfaction.
- Typical properties (Median) have an occupancy rate around 50%.
- Entry-level properties (Bottom 25%) average 29% occupancy, potentially facing higher vacancy.
Average Monthly Occupancy Rate Trend in Phoenix
Average Daily Rate (ADR) Airbnb Trends in Phoenix (2026)
Effective short term rental pricing strategy in Phoenix involves understanding monthly ADR fluctuations. The Average Daily Rate (ADR) for Airbnb in Phoenix typically peaks in February and dips lowest during July. Leveraging Airbnb dynamic pricing tools or strategies based on this seasonality can significantly boost revenue. Here's a look at the typical nightly rates achieved:
- Best-in-class properties (Top 10%) command rates of $500+ per night, often due to premium features or locations.
- Strong performing properties (Top 25%) achieve nightly rates of $308 or more.
- Typical properties (Median) charge around $181 per night.
- Entry-level properties (Bottom 25%) earn around $110 per night.
Average Daily Rate (ADR) Trend by Month in Phoenix
Get Live Phoenix Market Intelligence 👇

Explore Real-time Analytics
Airbnb Seasonality Analysis & Trends in Phoenix (2026)
Peak Season (March, February, April)
- Revenue averages $5,878 per month
- Occupancy rates average 62.2%
- Daily rates average $283
Shoulder Season
- Revenue averages $3,992 per month
- Occupancy maintains around 46.7%
- Daily rates hold near $266
Low Season (July, August, September)
- Revenue drops to average $2,971 per month
- Occupancy decreases to average 42.3%
- Daily rates adjust to average $234
Seasonality Insights for Phoenix
- The Airbnb seasonality in Phoenix shows highly seasonal trends requiring careful strategy. While the sections above show seasonal averages, it's also insightful to look at the extremes:
- During the high season, the absolute peak month showcases Phoenix's highest earning potential, with monthly revenues capable of climbing to $7,141, occupancy reaching a high of 69.3%, and ADRs peaking at $300.
- Conversely, the slowest single month of the year, typically falling within the low season, marks the market's lowest point. In this month, revenue might dip to $2,952, occupancy could drop to 40.7%, and ADRs may adjust down to $227.
- Understanding both the seasonal averages and these monthly peaks and troughs in revenue, occupancy, and ADR is crucial for maximizing your Airbnb profit potential in Phoenix.
Seasonal Strategies for Maximizing Profit
- Peak Season: Maximize revenue through premium pricing and potentially longer minimum stays. Ensure high availability.
- Low Season: Offer competitive pricing, special promotions (e.g., extended stay discounts), and flexible cancellation policies. Target off-season travelers like remote workers or budget-conscious guests.
- Shoulder Seasons: Implement dynamic pricing that balances peak and low rates. Target weekend travelers or specific events. Offer slightly more flexible terms than peak season.
- Regularly analyze your own performance against these Phoenix seasonality benchmarks and adjust your pricing and availability strategy accordingly.
Best Areas for Airbnb Investment in Phoenix (2026)
Exploring the top neighborhoods for short-term rentals in Phoenix? This section highlights key areas, outlining why they are attractive for hosts and guests, along with notable local attractions. Consider these locations based on your target guest profile and investment strategy.
| Neighborhood / Area | Why Host Here? (Target Guests & Appeal) | Key Attractions & Landmarks |
|---|---|---|
| Downtown Phoenix | The vibrant heart of the city, known for its arts, culture, and nightlife. Ideal for tourists who want to experience the urban lifestyle and close proximity to sporting events, dining, and entertainment. | Phoenix Art Museum, Chase Field, Footprint Center, Heritage Square, Arizona Science Center |
| Old Town Scottsdale | A prime destination for nightlife and dining, famous for its Western-style boutiques and art galleries. A popular area for visitors seeking an upscale experience with a Scottsdale flair. | Scottsdale Waterfront, Old Town Scottsdale, Scottsdale Museum of Contemporary Art, ArtWalk, Golf courses |
| Tempe | Home to Arizona State University, Tempe has a youthful energy and a great selection of eateries and entertainment options. A great location for hosting students and university visitors. | Tempe Town Lake, ASU Campus, Mill Avenue District, Tempe Marketplace, Sun Devil Stadium |
| Arcadia | A residential neighborhood famous for its charming homes and proximity to natural attractions and upscale shopping. Appeals to families and those looking for a quieter stay while still close to attractions. | Phoenix Zoo, Desert Botanical Garden, Celebrity Theatre, Arcadia Park, Local cafes and shops |
| North Mountain | Offers a more suburban feel with access to hiking trails and nature. Ideal for those looking to escape the city bustle while still being a short drive away from downtown. | North Mountain Park, Piestewa Peak, Scorpion Gulch, Hiking Trails, Outdoor Recreation |
| Ahwatukee | A family-friendly area that provides a suburban atmosphere with beautiful mountain views. Perfect for visitors looking for a peaceful retreat while having access to urban amenities. | South Mountain Park, Ahwatukee Foothills, Local Shopping Centers, Parks and Trails, Golf Courses |
| Biltmore | Known for its luxury hotels and high-end shopping, the Biltmore area attracts visitors seeking an upscale experience with proximity to golf courses and gourmet dining. | Arizona Biltmore Resort, Biltmore Fashion Park, Golf Courses, Local Fine Dining, Hiking Trails |
| Cave Creek | A picturesque area that offers a taste of the Old West with its saloons and unique shops. Attracts those looking for a more rustic Arizona experience, away from the hustle and bustle. | Cave Creek Regional Park, Historic Town of Cave Creek, Sahuaro Ranch Park, Shopping and Art Galleries, Nature Trails |
Understanding Airbnb License Requirements & STR Laws in Phoenix (2026)
While Phoenix, Arizona, United States currently shows low STR regulations, specific Airbnb license requirements might still exist or change. Always verify the latest short term rental regulations and Airbnb license requirements directly with local government authorities for Phoenix to ensure full compliance before hosting.
(Source: AirROI data, 2026, based on 0% licensed listings)
Top Performing Airbnb Properties in Phoenix (2026)
Benchmark your potential! Explore examples of top-performing Airbnb properties in Phoenixbased on Trailing Twelve Month (TTM) revenue. Analyze their characteristics, revenue, occupancy rate, and ADR to understand what drives success in this market.
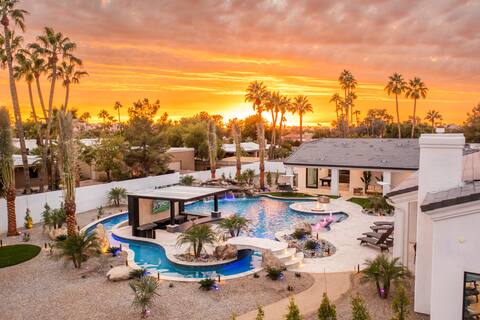
HÓZHÓ on the River | Lazy River | Pool | Theatre
Entire Place • 9 bedrooms
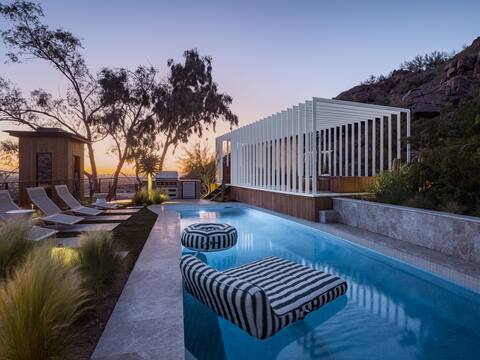
Skyeview - Award-Winning Mountaintop Oasis
Entire Place • 4 bedrooms

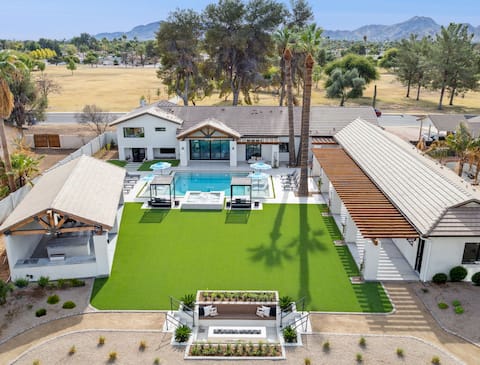
Mountain Mansion - Golf, Heated Pool, Game Room
Entire Place • 9 bedrooms
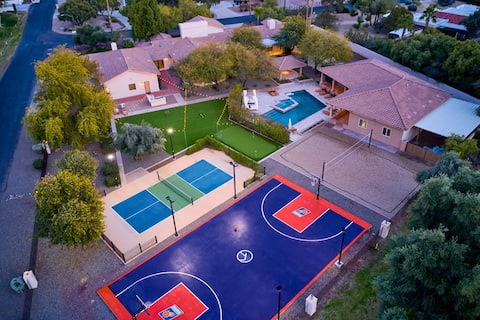
2 Homes in 1 | Pickleball Court + Hidden Speakeasy
Entire Place • 8 bedrooms
Luxury Estate Acre Lot-Pickleball-Pool-Spa-Gym
Entire Place • 8 bedrooms

HÓZHÓ on the Course | Pool | Tennis | Pickleball
Entire Place • 9 bedrooms
Note: Performance varies based on location, size, amenities, seasonality, and management quality. Data reflects the past 12 months.
Top Performing Airbnb Hosts in Phoenix (2026)
Learn from the best! This table showcases top-performing Airbnb hosts in Phoenix based on the number of properties managed and estimated total revenue over the past year. Analyze their scale and performance metrics.
| Host Name | Properties | Grossing Revenue | Stay Reviews | Avg Rating |
|---|---|---|---|---|
| Travli Hospitality | 31 | $3,181,855 | 2420 | 4.91/5.0 |
| List My Rental Home | 18 | $2,947,598 | 1009 | 4.90/5.0 |
| Manor Retreats | 7 | $2,765,895 | 337 | 4.99/5.0 |
| Sabrina | 19 | $2,544,766 | 1789 | 4.73/5.0 |
| Bart | 45 | $2,153,064 | 2437 | 4.76/5.0 |
| Jeff And Bridget | 16 | $2,137,724 | 593 | 4.95/5.0 |
| Sacha | 30 | $2,132,258 | 4550 | 4.83/5.0 |
| Porter | 22 | $2,131,129 | 882 | 4.80/5.0 |
| Evolve | 75 | $1,936,732 | 867 | 4.65/5.0 |
| Evolve | 47 | $1,700,154 | 1616 | 4.79/5.0 |
Analyzing the strategies of top hosts, such as their property selection, pricing, and guest communication, can offer valuable lessons for optimizing your own Airbnb operations in Phoenix.
Dive Deeper: Advanced Phoenix STR Market Data (2026)
Ready to unlock more insights? AirROI provides access to advanced metrics and comprehensive Airbnb data for Phoenix. Explore detailed analytics beyond this report to refine your investment strategy, optimize pricing, and maximize your vacation rental profits.
Explore Advanced MetricsPhoenix Short-Term Rental Market Composition (2026): Property & Room Types
Room Type Distribution
Property Type Distribution
Market Composition Insights for Phoenix
- The Phoenix Airbnb market composition is heavily skewed towards Entire Home/Apt listings, which make up 89.4% of the 5,932 active rentals. This indicates strong guest preference for privacy and space.
- Looking at the property type distribution in Phoenix, House properties are the most common (63.6%), reflecting the local real estate landscape.
- Houses represent a significant 63.6% portion, catering likely to families or larger groups.
- The presence of 8.1% Hotel/Boutique listings indicates integration with traditional hospitality.
- Smaller segments like others, outdoor/unique, unique stays (combined 4.0%) offer potential for unique stay experiences.
Phoenix Airbnb Room Capacity Analysis (2026): Bedroom Distribution
Distribution of Listings by Number of Bedrooms
Room Capacity Insights for Phoenix
- The dominant room capacity in Phoenix is 1 bedroom listings, making up 23.1% of the market. This suggests a strong demand for properties suitable for couples or solo travelers.
- Together, 1 bedroom and 3 bedrooms properties represent 43.0% of the active Airbnb listings in Phoenix, indicating a high concentration in these sizes.
- A significant 45.0% of listings offer 3+ bedrooms, catering to larger groups and families seeking more space in Phoenix.
Phoenix Vacation Rental Guest Capacity Trends (2026)
Distribution of Listings by Guest Capacity
Guest Capacity Insights for Phoenix
- The most common guest capacity trend in Phoenix vacation rentals is listings accommodating 8+ guests (32.4%). This suggests the primary traveler segment is likely larger groups.
- Properties designed for 8+ guests and 4 guests dominate the Phoenix STR market, accounting for 50.2% of listings.
- 49.3% of properties accommodate 6+ guests, serving the market segment for larger families or group travel in Phoenix.
- On average, properties in Phoenix are equipped to host 5.0 guests.
Phoenix Airbnb Booking Patterns (2026): Available vs. Booked Days
Available Days Distribution
Booked Days Distribution
Booking Pattern Insights for Phoenix
- The most common availability pattern in Phoenix falls within the 271-366 days range, representing 39.7% of listings. This suggests many properties have significant open periods on their calendars.
- Approximately 70.5% of listings show high availability (181+ days open annually), indicating potential for increased bookings or specific owner usage patterns.
- For booked days, the 91-180 days range is most frequent in Phoenix (31.1%), reflecting common guest stay durations or potential owner blocking patterns.
- A notable 30.6% of properties secure long booking periods (181+ days booked per year), highlighting successful long-term rental strategies or significant owner usage.
Phoenix Airbnb Minimum Stay Requirements Analysis
Distribution of Listings by Minimum Night Requirement
1 Night
1068 listings
18% of total
2 Nights
1217 listings
20.5% of total
3 Nights
480 listings
8.1% of total
4-6 Nights
291 listings
4.9% of total
7-29 Nights
644 listings
10.9% of total
30+ Nights
2230 listings
37.6% of total
Key Insights
- The most prevalent minimum stay requirement in Phoenix is 30+ Nights, adopted by 37.6% of listings. This highlights the market's preference for longer commitments.
- A significant segment (37.6%) caters to monthly stays (30+ nights) in Phoenix, pointing to opportunities in the extended-stay market.
Recommendations
- Align with the market by considering a 30+ Nights minimum stay, as 37.6% of Phoenix hosts use this setting.
- If feasible, allowing 1-night stays, especially midweek or during low season, could capture last-minute bookings, as only 18% currently do.
- Explore offering discounts for stays of 30+ nights to attract the 37.6% of the market seeking extended stays.
- Adjust minimum nights based on seasonality – potentially shorter during low season and longer during peak demand periods in Phoenix.
Phoenix Airbnb Cancellation Policy Trends Analysis (2026)
Limited
129 listings
2.2% of total
Super Strict 30 Days
158 listings
2.7% of total
Super Strict 60 Days
76 listings
1.3% of total
Flexible
930 listings
15.7% of total
Moderate
1413 listings
23.9% of total
Firm
2279 listings
38.5% of total
Strict
931 listings
15.7% of total
Cancellation Policy Insights for Phoenix
- The prevailing Airbnb cancellation policy trend in Phoenix is Firm, used by 38.5% of listings.
- A majority (54.2%) of hosts in Phoenix utilize Firm or Strict policies, indicating a market where hosts prioritize booking security.
Recommendations for Hosts
- Consider adopting a Firm policy to align with the 38.5% market standard in Phoenix.
- Regularly review your cancellation policy against competitors and market demand shifts in Phoenix.
Phoenix STR Booking Lead Time Analysis (2026)
Average Booking Lead Time by Month
Booking Lead Time Insights for Phoenix
- The overall average booking lead time for vacation rentals in Phoenix is 42 days.
- Guests book furthest in advance for stays during March (average 56 days), likely coinciding with peak travel demand or local events.
- The shortest booking windows occur for stays in August (average 30 days), indicating more last-minute travel plans during this time.
- Seasonally, Winter (48 days avg.) sees the longest lead times, while Summer (30 days avg.) has the shortest, reflecting typical travel planning cycles.
Recommendations for Hosts
- Use the overall average lead time (42 days) as a baseline for your pricing and availability strategy in Phoenix.
- For March stays, consider implementing length-of-stay discounts or slightly higher rates for bookings made less than 56 days out to capitalize on advance planning.
- Target marketing efforts for the Winter season well in advance (at least 48 days) to capture early planners.
- Monitor your own booking lead times against these Phoenix averages to identify opportunities for dynamic pricing adjustments.
Popular & Essential Airbnb Amenities in Phoenix (2026)
Amenity Prevalence
Amenity Insights for Phoenix
- Essential amenities in Phoenix that guests expect include: Air conditioning, Wifi, TV, Smoke alarm. Lacking these (any) could significantly impact bookings.
- Popular amenities like Heating, Kitchen, Free parking on premises are common but not universal. Offering these can provide a competitive edge.
Recommendations for Hosts
- Ensure your listing includes all essential amenities for Phoenix: Air conditioning, Wifi, TV, Smoke alarm.
- Prioritize adding missing essentials: Air conditioning, Wifi, TV, Smoke alarm.
- Consider adding popular differentiators like Heating or Kitchen to increase appeal.
- Highlight unique or less common amenities you offer (e.g., hot tub, dedicated workspace, EV charger) in your listing description and photos.
- Regularly check competitor amenities in Phoenix to stay competitive.
Phoenix Airbnb Guest Demographics & Profile Analysis (2026)
Guest Profile Summary for Phoenix
- The typical guest profile for Airbnb in Phoenix consists of primarily domestic travelers (93%), often arriving from nearby Phoenix, typically belonging to the Post-2000s (Gen Z/Alpha) group (50%), primarily speaking English or Spanish.
- Domestic travelers account for 92.9% of guests.
- Key international markets include United States (92.9%) and Canada (3.1%).
- Top languages spoken are English (70%) followed by Spanish (17.4%).
- A significant demographic segment is the Post-2000s (Gen Z/Alpha) group, representing 50% of guests.
Recommendations for Hosts
- Target domestic marketing efforts towards travelers from Phoenix and Tucson.
- Tailor amenities and listing descriptions to appeal to the dominant Post-2000s (Gen Z/Alpha) demographic (e.g., highlight fast WiFi, smart home features, local guides).
- Highlight unique local experiences or amenities relevant to the primary guest profile.
- Consider seasonal promotions aligned with peak travel times for key origin markets.
Nearby Short-Term Rental Market Comparison
How does the Phoenix Airbnb market stack up against its neighbors? Compare key performance metrics like average monthly revenue, ADR, and occupancy rates in surrounding areas to understand the broader regional STR landscape.
| Market | Active Properties | Monthly Revenue | Daily Rate | Avg. Occupancy |
|---|---|---|---|---|
| Paradise Valley | 67 | $10,566 | $1242.99 | 41% |
| Sedona | 1,658 | $5,761 | $410.99 | 50% |
| Sedona City Limit | 372 | $4,884 | $333.39 | 51% |
| Scottsdale | 4,331 | $4,202 | $370.53 | 47% |
| Carefree | 31 | $4,052 | $522.63 | 39% |
| Cave Creek | 132 | $4,016 | $399.83 | 42% |
| Big Park | 427 | $3,618 | $294.75 | 47% |
| Fountain Hills | 215 | $3,506 | $356.69 | 45% |
| Star Valley | 12 | $3,374 | $279.20 | 43% |
| Payson town limits | 44 | $3,258 | $293.23 | 44% |