Parker Airbnb Market Analysis 2026: Short Term Rental Data & Vacation Rental Statistics in Arizona, United States
Is Airbnb profitable in Parker in 2026? Explore comprehensive Airbnb analytics for Parker, Arizona, United States to uncover income potential. This 2026 STR market report for Parker, based on AirROI data from February 2025 to January 2026, reveals key trends in the niche market of 25 active listings.
Whether you're considering an Airbnb investment in Parker, optimizing your existing vacation rental, or exploring rental arbitrage opportunities, understanding the Parker Airbnb data is crucial. Leveraging the low regulation environment is key to maximizing your short term rental income potential. Let's dive into the specifics.
Key Parker Airbnb Performance Metrics Overview
Monthly Airbnb Revenue Variations & Income Potential in Parker (2026)
Understanding the monthly revenue variations for Airbnb listings in Parker is key to maximizing your short term rental income potential. Seasonality significantly impacts earnings. Our analysis, based on data from the past 12 months, shows that the peak revenue month for STRs in Parker is typically August, while May often presents the lowest earnings, highlighting opportunities for strategic pricing adjustments during shoulder and low seasons. Explore the typical Airbnb income in Parker across different performance tiers:
- Best-in-class properties (Top 10%) achieve $5,869+ monthly, often utilizing dynamic pricing and superior guest experiences.
- Strong performing properties (Top 25%) earn $3,888 or more, indicating effective management and desirable locations/amenities.
- Typical properties (Median) generate around $2,345 per month, representing the average market performance.
- Entry-level properties (Bottom 25%) see earnings around $1,508, often with potential for optimization.
Average Monthly Airbnb Earnings Trend in Parker
Parker Airbnb Occupancy Rate Trends (2026)
Maximize your bookings by understanding the Parker STR occupancy trends. Seasonal demand shifts significantly influence how often properties are booked. Typically, Marchsees the highest demand (peak season occupancy), while May experiences the lowest (low season). Effective strategies, like adjusting minimum stays or offering promotions, can boost occupancy during slower periods. Here's how different property tiers perform in Parker:
- Best-in-class properties (Top 10%) achieve 58%+ occupancy, indicating high desirability and potentially optimized availability.
- Strong performing properties (Top 25%) maintain 45% or higher occupancy, suggesting good market fit and guest satisfaction.
- Typical properties (Median) have an occupancy rate around 27%.
- Entry-level properties (Bottom 25%) average 15% occupancy, potentially facing higher vacancy.
Average Monthly Occupancy Rate Trend in Parker
Average Daily Rate (ADR) Airbnb Trends in Parker (2026)
Effective short term rental pricing strategy in Parker involves understanding monthly ADR fluctuations. The Average Daily Rate (ADR) for Airbnb in Parker typically peaks in November and dips lowest during August. Leveraging Airbnb dynamic pricing tools or strategies based on this seasonality can significantly boost revenue. Here's a look at the typical nightly rates achieved:
- Best-in-class properties (Top 10%) command rates of $615+ per night, often due to premium features or locations.
- Strong performing properties (Top 25%) achieve nightly rates of $439 or more.
- Typical properties (Median) charge around $352 per night.
- Entry-level properties (Bottom 25%) earn around $188 per night.
Average Daily Rate (ADR) Trend by Month in Parker
Get Live Parker Market Intelligence 👇
Explore Real-time Analytics
Airbnb Seasonality Analysis & Trends in Parker (2026)
Peak Season (August, July, June)
- Revenue averages $4,473 per month
- Occupancy rates average 36.6%
- Daily rates average $342
Shoulder Season
- Revenue averages $3,104 per month
- Occupancy maintains around 33.7%
- Daily rates hold near $391
Low Season (February, May, December)
- Revenue drops to average $1,996 per month
- Occupancy decreases to average 27.0%
- Daily rates adjust to average $370
Seasonality Insights for Parker
- The Airbnb seasonality in Parker shows highly seasonal trends requiring careful strategy. While the sections above show seasonal averages, it's also insightful to look at the extremes:
- During the high season, the absolute peak month showcases Parker's highest earning potential, with monthly revenues capable of climbing to $5,092, occupancy reaching a high of 65.6%, and ADRs peaking at $427.
- Conversely, the slowest single month of the year, typically falling within the low season, marks the market's lowest point. In this month, revenue might dip to $1,784, occupancy could drop to 16.2%, and ADRs may adjust down to $325.
- Understanding both the seasonal averages and these monthly peaks and troughs in revenue, occupancy, and ADR is crucial for maximizing your Airbnb profit potential in Parker.
Seasonal Strategies for Maximizing Profit
- Peak Season: Maximize revenue through premium pricing and potentially longer minimum stays. Ensure high availability.
- Low Season: Offer competitive pricing, special promotions (e.g., extended stay discounts), and flexible cancellation policies. Target off-season travelers like remote workers or budget-conscious guests.
- Shoulder Seasons: Implement dynamic pricing that balances peak and low rates. Target weekend travelers or specific events. Offer slightly more flexible terms than peak season.
- Regularly analyze your own performance against these Parker seasonality benchmarks and adjust your pricing and availability strategy accordingly.
Best Areas for Airbnb Investment in Parker (2026)
Exploring the top neighborhoods for short-term rentals in Parker? This section highlights key areas, outlining why they are attractive for hosts and guests, along with notable local attractions. Consider these locations based on your target guest profile and investment strategy.
| Neighborhood / Area | Why Host Here? (Target Guests & Appeal) | Key Attractions & Landmarks |
|---|---|---|
| Parker Strip | A popular water recreation area along the Colorado River, known for boating, fishing, and water sports. This location attracts numerous tourists during the summer months looking for water-based activities. | Colorado River, Lake Havasu City, Bouse Fisherman's Park, Buckskin Mountain State Park, California Bonny Bell Campground |
| Parker Dam | Home to the Parker Dam, which creates Lake Havasu. This area is ideal for those seeking an outdoor experience with scenic views and opportunities for fishing and camping. | Parker Dam, Lake Havasu, Bill Williams River National Wildlife Refuge, Saguaro Lake, Cattail Cove State Park |
| Parker | The town of Parker offers a blend of small-town charm and access to the nearby river and recreational activities. It's a good spot for families and visitors looking for local culture and events. | Parker Pioneer Historical Society, BlueWater Resort & Casino, Parker Golf Course, Parker Public Library, Parker 4th of July Celebration |
| Sacatone | Known for its beautiful desert landscapes and proximity to outdoor adventures, Sacatone is a great spot for nature lovers and those looking to escape the hustle and bustle. | Sacatone Wash, Sonoran Desert Hiking, Parker Valley, Colorado River Views, Wildlife Viewing |
| La Paz County Park | A quiet and friendly park along the Colorado River that offers camping and outdoor activities, perfect for families and adventurers. | La Paz County Park Beach, Fishing Spots, Playground Areas, Picnic Sites, Nature Trails |
| Buckskin Mountain State Park | This state park features stunning views of the Colorado River and is a prime spot for camping, hiking, and outdoor activities, appealing to nature enthusiasts. | Camping Facilities, Hiking Trails, Picnic Areas, Desert Wildlife, River Access |
| Havasu National Wildlife Refuge | The refuge is a haven for wildlife and offers many recreational opportunities including hiking and bird watching. It's great for those wanting to connect with nature. | Wildlife Viewing, Hiking Trails, Fishing Spots, Scenic Views, Kayaking |
| Quartzsite | Known for its gem shows and vibrant desert community, Quartzsite attracts travelers looking for unique experiences and local events, especially in the winter months. | Quartzsite Gem Show, Potato Chip Rock, Scenic Desert Art, Local Markets, Junction of I-10 and Highway 95 |
Understanding Airbnb License Requirements & STR Laws in Parker (2026)
While Parker, Arizona, United States currently shows low STR regulations, specific Airbnb license requirements might still exist or change. Always verify the latest short term rental regulations and Airbnb license requirements directly with local government authorities for Parker to ensure full compliance before hosting.
(Source: AirROI data, 2026, finding no licensed listings among those analyzed)
Top Performing Airbnb Properties in Parker (2026)
Benchmark your potential! Explore examples of top-performing Airbnb properties in Parkerbased on Trailing Twelve Month (TTM) revenue. Analyze their characteristics, revenue, occupancy rate, and ADR to understand what drives success in this market.
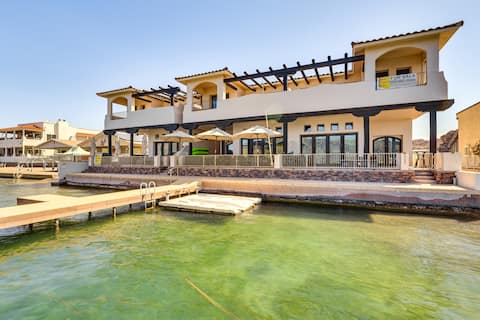
Game Room + Dock: Riverfront Escape in Parker!
Entire Place • 5 bedrooms
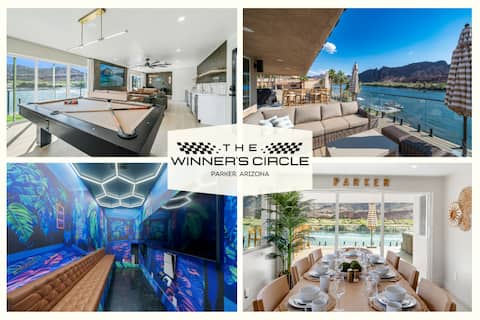
New Luxe Riverfront Home: Launch & Dock, Gamerooms
Entire Place • 5 bedrooms
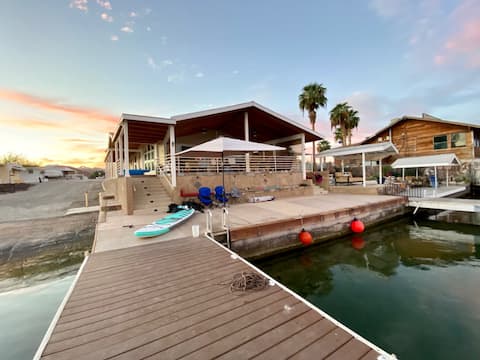
River Front-RdRunner next door-Parker Centered
Entire Place • 3 bedrooms

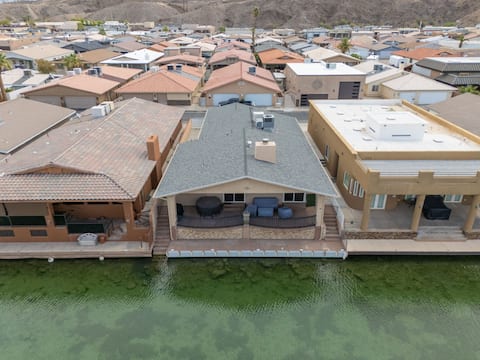
Sunkissed Hideaway, Front Row Roadrunner Resort
Entire Place • 2 bedrooms
Apache Fyre, Canal Front Dock, Moovlaya Keys
Entire Place • 3 bedrooms
Livin' the dream, Front Row! Roadrunner Resort
Entire Place ��• 2 bedrooms
Note: Performance varies based on location, size, amenities, seasonality, and management quality. Data reflects the past 12 months.
Top Performing Airbnb Hosts in Parker (2026)
Learn from the best! This table showcases top-performing Airbnb hosts in Parker based on the number of properties managed and estimated total revenue over the past year. Analyze their scale and performance metrics.
| Host Name | Properties | Grossing Revenue | Stay Reviews | Avg Rating |
|---|---|---|---|---|
| Roadrunner Barefoot Beach Club | 13 | $286,090 | 48 | 4.88/5.0 |
| Brant | 3 | $80,456 | 34 | 4.59/5.0 |
| Evolve | 1 | $73,810 | 1 | Not Rated |
| Luis | 1 | $72,562 | 19 | 5.00/5.0 |
| Albert | 1 | $51,865 | 116 | 4.97/5.0 |
| Robert & Lynn | 1 | $27,057 | 127 | 4.94/5.0 |
| Troy | 1 | $15,126 | 11 | 5.00/5.0 |
| Branton | 1 | $14,840 | 35 | 4.94/5.0 |
| Kristie | 1 | $8,977 | 5 | 5.00/5.0 |
| Layla | 1 | $5,450 | 1 | Not Rated |
Analyzing the strategies of top hosts, such as their property selection, pricing, and guest communication, can offer valuable lessons for optimizing your own Airbnb operations in Parker.
Dive Deeper: Advanced Parker STR Market Data (2026)
Ready to unlock more insights? AirROI provides access to advanced metrics and comprehensive Airbnb data for Parker. Explore detailed analytics beyond this report to refine your investment strategy, optimize pricing, and maximize your vacation rental profits.
Explore Advanced MetricsParker Short-Term Rental Market Composition (2026): Property & Room Types
Room Type Distribution
Property Type Distribution
Market Composition Insights for Parker
- The Parker Airbnb market composition is heavily skewed towards Entire Home/Apt listings, which make up 100% of the 25 active rentals. This indicates strong guest preference for privacy and space.
- Looking at the property type distribution in Parker, House properties are the most common (92%), reflecting the local real estate landscape.
- Houses represent a significant 92% portion, catering likely to families or larger groups.
Parker Airbnb Room Capacity Analysis (2026): Bedroom Distribution
Distribution of Listings by Number of Bedrooms
Room Capacity Insights for Parker
- The dominant room capacity in Parker is 2 bedrooms listings, making up 60% of the market. This suggests a strong demand for properties suitable for couples or solo travelers.
- Together, 2 bedrooms and 1 bedroom properties represent 76.0% of the active Airbnb listings in Parker, indicating a high concentration in these sizes.
- A significant 24.0% of listings offer 3+ bedrooms, catering to larger groups and families seeking more space in Parker.
Parker Vacation Rental Guest Capacity Trends (2026)
Distribution of Listings by Guest Capacity
Guest Capacity Insights for Parker
- The most common guest capacity trend in Parker vacation rentals is listings accommodating 8+ guests (64%). This suggests the primary traveler segment is likely larger groups.
- Properties designed for 8+ guests and 6 guests dominate the Parker STR market, accounting for 80.0% of listings.
- 80.0% of properties accommodate 6+ guests, serving the market segment for larger families or group travel in Parker.
- On average, properties in Parker are equipped to host 6.8 guests.
Parker Airbnb Booking Patterns (2026): Available vs. Booked Days
Available Days Distribution
Booked Days Distribution
Booking Pattern Insights for Parker
- The most common availability pattern in Parker falls within the 271-366 days range, representing 84% of listings. This suggests many properties have significant open periods on their calendars.
- Approximately 100.0% of listings show high availability (181+ days open annually), indicating potential for increased bookings or specific owner usage patterns.
- For booked days, the 31-90 days range is most frequent in Parker (72%), reflecting common guest stay durations or potential owner blocking patterns.
Parker Airbnb Minimum Stay Requirements Analysis
Distribution of Listings by Minimum Night Requirement
1 Night
1 listings
4% of total
2 Nights
17 listings
68% of total
3 Nights
2 listings
8% of total
7-29 Nights
1 listings
4% of total
30+ Nights
4 listings
16% of total
Key Insights
- The most prevalent minimum stay requirement in Parker is 2 Nights, adopted by 68% of listings. This highlights the market's preference for shorter, flexible bookings.
- A strong majority (72.0%) of the Parker Airbnb data shows acceptance of very short stays (1-2 nights), indicating a dynamic, high-turnover market.
- A significant segment (16%) caters to monthly stays (30+ nights) in Parker, pointing to opportunities in the extended-stay market.
Recommendations
- Align with the market by considering a 2 Nights minimum stay, as 68% of Parker hosts use this setting.
- If feasible, allowing 1-night stays, especially midweek or during low season, could capture last-minute bookings, as only 4% currently do.
- A 2-night minimum appears standard (68%). Consider this for weekends or peak periods.
- Explore offering discounts for stays of 30+ nights to attract the 16% of the market seeking extended stays.
- Adjust minimum nights based on seasonality – potentially shorter during low season and longer during peak demand periods in Parker.
Parker Airbnb Cancellation Policy Trends Analysis (2026)
Limited
1 listings
4% of total
Flexible
1 listings
4% of total
Moderate
7 listings
28% of total
Firm
14 listings
56% of total
Strict
2 listings
8% of total
Cancellation Policy Insights for Parker
- The prevailing Airbnb cancellation policy trend in Parker is Firm, used by 56% of listings.
- A majority (64.0%) of hosts in Parker utilize Firm or Strict policies, indicating a market where hosts prioritize booking security.
- Strict cancellation policies are quite rare (8%), potentially making listings with this policy less competitive unless justified by high demand or property type.
Recommendations for Hosts
- Consider adopting a Firm policy to align with the 56% market standard in Parker.
- Using a Strict policy might deter some guests, as only 8% of listings use it. Evaluate if potential revenue protection outweighs possible lower booking rates.
- Regularly review your cancellation policy against competitors and market demand shifts in Parker.
Parker STR Booking Lead Time Analysis (2026)
Average Booking Lead Time by Month
Booking Lead Time Insights for Parker
- The overall average booking lead time for vacation rentals in Parker is 30 days.
- Guests book furthest in advance for stays during March (average 78 days), likely coinciding with peak travel demand or local events.
- The shortest booking windows occur for stays in May (average 12 days), indicating more last-minute travel plans during this time.
- Seasonally, Spring (39 days avg.) sees the longest lead times, while Winter (22 days avg.) has the shortest, reflecting typical travel planning cycles.
Recommendations for Hosts
- Use the overall average lead time (30 days) as a baseline for your pricing and availability strategy in Parker.
- For March stays, consider implementing length-of-stay discounts or slightly higher rates for bookings made less than 78 days out to capitalize on advance planning.
- During May, focus on last-minute booking availability and promotions, as guests book with very short notice (12 days avg.).
- Target marketing efforts for the Spring season well in advance (at least 39 days) to capture early planners.
- Monitor your own booking lead times against these Parker averages to identify opportunities for dynamic pricing adjustments.
Popular & Essential Airbnb Amenities in Parker (2026)
Amenity Prevalence
Amenity Insights for Parker
- Popular amenities like Pets allowed, Hot water, Coffee are common but not universal. Offering these can provide a competitive edge.
Recommendations for Hosts
- Consider adding popular differentiators like Pets allowed or Hot water to increase appeal.
- Highlight unique or less common amenities you offer (e.g., hot tub, dedicated workspace, EV charger) in your listing description and photos.
- Regularly check competitor amenities in Parker to stay competitive.
Parker Airbnb Guest Demographics & Profile Analysis (2026)
Guest Profile Summary for Parker
- The typical guest profile for Airbnb in Parker consists of primarily domestic travelers (97%), often arriving from nearby Phoenix, typically belonging to the Post-2000s (Gen Z/Alpha) group (50%), primarily speaking English or Spanish.
- Domestic travelers account for 97.0% of guests.
- Key international markets include United States (97%) and Mexico (1.5%).
- Top languages spoken are English (85.7%) followed by Spanish (14.3%).
- A significant demographic segment is the Post-2000s (Gen Z/Alpha) group, representing 50% of guests.
Recommendations for Hosts
- Target domestic marketing efforts towards travelers from Phoenix and Huntington Beach.
- Tailor amenities and listing descriptions to appeal to the dominant Post-2000s (Gen Z/Alpha) demographic (e.g., highlight fast WiFi, smart home features, local guides).
- Highlight unique local experiences or amenities relevant to the primary guest profile.
- Consider seasonal promotions aligned with peak travel times for key origin markets.
Nearby Short-Term Rental Market Comparison
How does the Parker Airbnb market stack up against its neighbors? Compare key performance metrics like average monthly revenue, ADR, and occupancy rates in surrounding areas to understand the broader regional STR landscape.
| Market | Active Properties | Monthly Revenue | Daily Rate | Avg. Occupancy |
|---|---|---|---|---|
| Parker Strip | 117 | $3,152 | $393.31 | 33% |
| Needles | 29 | $2,795 | $342.20 | 31% |
| Lake Havasu City | 1,391 | $2,497 | $292.66 | 38% |
| Boulder City | 14 | $1,974 | $255.55 | 48% |
| Ehrenberg | 29 | $1,972 | $180.28 | 42% |
| Bullhead City | 412 | $1,963 | $264.33 | 35% |
| Fort Mohave | 11 | $1,844 | $269.69 | 39% |
| Mohave Valley | 88 | $1,775 | $257.47 | 35% |
| Havasu Lake | 10 | $1,746 | $298.52 | 28% |
| Blythe | 14 | $1,652 | $157.40 | 37% |