New River Airbnb Market Analysis 2026: Short Term Rental Data & Vacation Rental Statistics in Arizona, United States
Is Airbnb profitable in New River in 2026? Explore comprehensive Airbnb analytics for New River, Arizona, United States to uncover income potential. This 2026 STR market report for New River, based on AirROI data from February 2025 to January 2026, reveals key trends in the niche market of 26 active listings.
Whether you're considering an Airbnb investment in New River, optimizing your existing vacation rental, or exploring rental arbitrage opportunities, understanding the New River Airbnb data is crucial. Leveraging the low regulation environment is key to maximizing your short term rental income potential. Let's dive into the specifics.
Key New River Airbnb Performance Metrics Overview
Monthly Airbnb Revenue Variations & Income Potential in New River (2026)
Understanding the monthly revenue variations for Airbnb listings in New River is key to maximizing your short term rental income potential. Seasonality significantly impacts earnings. Our analysis, based on data from the past 12 months, shows that the peak revenue month for STRs in New River is typically March, while August often presents the lowest earnings, highlighting opportunities for strategic pricing adjustments during shoulder and low seasons. Explore the typical Airbnb income in New River across different performance tiers:
- Best-in-class properties (Top 10%) achieve $5,408+ monthly, often utilizing dynamic pricing and superior guest experiences.
- Strong performing properties (Top 25%) earn $3,805 or more, indicating effective management and desirable locations/amenities.
- Typical properties (Median) generate around $1,968 per month, representing the average market performance.
- Entry-level properties (Bottom 25%) see earnings around $1,080, often with potential for optimization.
Average Monthly Airbnb Earnings Trend in New River
New River Airbnb Occupancy Rate Trends (2026)
Maximize your bookings by understanding the New River STR occupancy trends. Seasonal demand shifts significantly influence how often properties are booked. Typically, Marchsees the highest demand (peak season occupancy), while June experiences the lowest (low season). Effective strategies, like adjusting minimum stays or offering promotions, can boost occupancy during slower periods. Here's how different property tiers perform in New River:
- Best-in-class properties (Top 10%) achieve 78%+ occupancy, indicating high desirability and potentially optimized availability.
- Strong performing properties (Top 25%) maintain 64% or higher occupancy, suggesting good market fit and guest satisfaction.
- Typical properties (Median) have an occupancy rate around 38%.
- Entry-level properties (Bottom 25%) average 22% occupancy, potentially facing higher vacancy.
Average Monthly Occupancy Rate Trend in New River
Average Daily Rate (ADR) Airbnb Trends in New River (2026)
Effective short term rental pricing strategy in New River involves understanding monthly ADR fluctuations. The Average Daily Rate (ADR) for Airbnb in New River typically peaks in January and dips lowest during July. Leveraging Airbnb dynamic pricing tools or strategies based on this seasonality can significantly boost revenue. Here's a look at the typical nightly rates achieved:
- Best-in-class properties (Top 10%) command rates of $450+ per night, often due to premium features or locations.
- Strong performing properties (Top 25%) achieve nightly rates of $216 or more.
- Typical properties (Median) charge around $158 per night.
- Entry-level properties (Bottom 25%) earn around $115 per night.
Average Daily Rate (ADR) Trend by Month in New River
Get Live New River Market Intelligence 👇

Explore Real-time Analytics
Airbnb Seasonality Analysis & Trends in New River (2026)
Peak Season (March, February, October)
- Revenue averages $4,470 per month
- Occupancy rates average 58.5%
- Daily rates average $212
Shoulder Season
- Revenue averages $3,140 per month
- Occupancy maintains around 42.8%
- Daily rates hold near $211
Low Season (June, August, September)
- Revenue drops to average $1,886 per month
- Occupancy decreases to average 29.0%
- Daily rates adjust to average $210
Seasonality Insights for New River
- The Airbnb seasonality in New River shows highly seasonal trends requiring careful strategy. While the sections above show seasonal averages, it's also insightful to look at the extremes:
- During the high season, the absolute peak month showcases New River's highest earning potential, with monthly revenues capable of climbing to $5,144, occupancy reaching a high of 64.8%, and ADRs peaking at $222.
- Conversely, the slowest single month of the year, typically falling within the low season, marks the market's lowest point. In this month, revenue might dip to $1,410, occupancy could drop to 26.0%, and ADRs may adjust down to $203.
- Understanding both the seasonal averages and these monthly peaks and troughs in revenue, occupancy, and ADR is crucial for maximizing your Airbnb profit potential in New River.
Seasonal Strategies for Maximizing Profit
- Peak Season: Maximize revenue through premium pricing and potentially longer minimum stays. Ensure high availability.
- Low Season: Offer competitive pricing, special promotions (e.g., extended stay discounts), and flexible cancellation policies. Target off-season travelers like remote workers or budget-conscious guests.
- Shoulder Seasons: Implement dynamic pricing that balances peak and low rates. Target weekend travelers or specific events. Offer slightly more flexible terms than peak season.
- Regularly analyze your own performance against these New River seasonality benchmarks and adjust your pricing and availability strategy accordingly.
Best Areas for Airbnb Investment in New River (2026)
Exploring the top neighborhoods for short-term rentals in New River? This section highlights key areas, outlining why they are attractive for hosts and guests, along with notable local attractions. Consider these locations based on your target guest profile and investment strategy.
| Neighborhood / Area | Why Host Here? (Target Guests & Appeal) | Key Attractions & Landmarks |
|---|---|---|
| New River | A picturesque area offering a peaceful desert environment with nearby hiking trails and outdoor recreational activities. Ideal for travelers looking to escape the hustle and bustle of city life while still being close to Phoenix. | Lake Pleasant Regional Park, 55th Avenue Trailhead, Cave Creek Regional Park, Deer Valley Petroglyph Preserve, Sonoran Desert National Monument |
| Anthem | A master-planned community known for its family-friendly atmosphere, parks, and amenities. Perfect for families vacationing in the Phoenix area, with access to shopping and outdoor activities. | Anthem Community Park, Anthem Outlets, Daisy Mountain Trailhead, Anthem Veterans Memorial, The Golf Club at Anthem |
| Cave Creek | A charming town with a rich western history, known for its art galleries, shops, and restaurants. Attracts visitors looking for a unique Arizona experience. | Cave Creek Regional Park, Horseback riding tours, Cave Creek Museum, Old West-style shops, Scenic drives through desert landscapes |
| Carefree | Known for its upscale living and beautiful desert scenery, Carefree offers luxury homes and a tranquil environment. Great for renters seeking an upscale getaway. | Carefree Desert Gardens, Boulders Resort & Spa, Carefree’s art galleries, Downtown Carefree shopping and dining, Nearby hiking trails |
| Desert Hills | A serene residential area surrounded by stunning desert landscapes. Appeals to nature lovers and those seeking peace and quiet. | Desert Hills Trailhead, Sunset Trail, Sonoran Preserve, Nearby hiking and biking trails, Scenic vistas |
| Glendale | Close to Phoenix and popular for sports lovers, Glendale features stadiums, shopping, and a lively atmosphere. Suitable for guests attending events or enjoying urban amenities. | State Farm Stadium, Westgate Entertainment District, Desert Diamond Casino, Sahuaro Ranch Park, Glendale Historic District |
| Peoria | Offering a mix of suburban comfort and outdoor recreation, Peoria is quickly growing in popularity, especially with families and travelers seeking convenience to Phoenix. | Lake Pleasant, Peoria Sports Complex, Rio Vista Community Park, P83 Entertainment District, Nearby hiking and biking trails |
| Phoenix Mountains Preserve | A scenic natural area with hiking trails and stunning views, attracting outdoor enthusiasts and those who want to experience Arizona's natural beauty. | Camelback Mountain, Piestewa Peak, Hiking trails, Scenic picnicking areas, Wildlife viewing opportunities |
Understanding Airbnb License Requirements & STR Laws in New River (2026)
While New River, Arizona, United States currently shows low STR regulations, specific Airbnb license requirements might still exist or change. Always verify the latest short term rental regulations and Airbnb license requirements directly with local government authorities for New River to ensure full compliance before hosting.
(Source: AirROI data, 2026, finding no licensed listings among those analyzed)
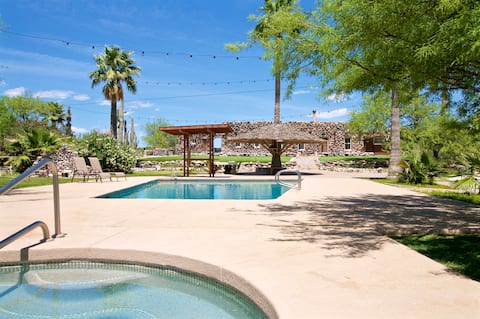
Top Performing Airbnb Properties in New River (2026)
Benchmark your potential! Explore examples of top-performing Airbnb properties in New Riverbased on Trailing Twelve Month (TTM) revenue. Analyze their characteristics, revenue, occupancy rate, and ADR to understand what drives success in this market.
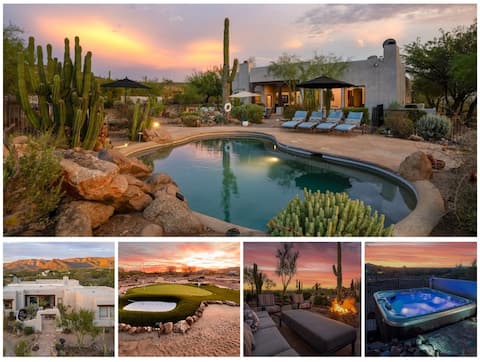
6‑Hole Golf Retreat w/ Heated Pool & Hot Tub
Entire Place • 5 bedrooms

Private Desert Retreat with Pool, Spa & Views
Entire Place • 1 bedroom
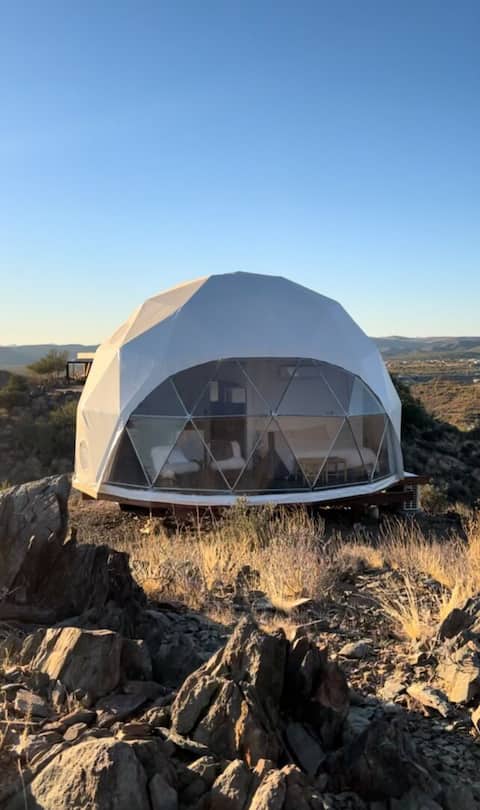
Glamping Dome W/Hotub Projector Deck
Entire Place • 1 bedroom

Floating House W/Swinging Bed Outdoor Projector
Entire Place • 2 bedrooms
Wranglers Roost Stagecoach Stop
Entire Place • 5 bedrooms

Luxe Casita on Hobby Farm~Goats~Hot tub
Entire Place • 1 bedroom
Note: Performance varies based on location, size, amenities, seasonality, and management quality. Data reflects the past 12 months.
Top Performing Airbnb Hosts in New River (2026)
Learn from the best! This table showcases top-performing Airbnb hosts in New River based on the number of properties managed and estimated total revenue over the past year. Analyze their scale and performance metrics.
| Host Name | Properties | Grossing Revenue | Stay Reviews | Avg Rating |
|---|---|---|---|---|
| Kimberly | 1 | $194,744 | 92 | 4.97/5.0 |
| Stephanie | 2 | $86,453 | 53 | 4.96/5.0 |
| Susan | 1 | $52,651 | 361 | 5.00/5.0 |
| Heidi | 1 | $34,561 | 33 | 4.82/5.0 |
| Michele | 1 | $30,358 | 409 | 4.98/5.0 |
| Simon | 1 | $26,883 | 10 | 5.00/5.0 |
| Mark Anthony | 1 | $24,072 | 19 | 4.79/5.0 |
| Robbie | 1 | $21,104 | 29 | 5.00/5.0 |
| Margie | 1 | $20,855 | 2 | Not Rated |
| Jesse | 1 | $19,873 | 8 | 4.88/5.0 |
Analyzing the strategies of top hosts, such as their property selection, pricing, and guest communication, can offer valuable lessons for optimizing your own Airbnb operations in New River.
Dive Deeper: Advanced New River STR Market Data (2026)
Ready to unlock more insights? AirROI provides access to advanced metrics and comprehensive Airbnb data for New River. Explore detailed analytics beyond this report to refine your investment strategy, optimize pricing, and maximize your vacation rental profits.
Explore Advanced MetricsNew River Short-Term Rental Market Composition (2026): Property & Room Types
Room Type Distribution
Property Type Distribution
Market Composition Insights for New River
- The New River Airbnb market composition is heavily skewed towards Entire Home/Apt listings, which make up 96.2% of the 26 active rentals. This indicates strong guest preference for privacy and space.
- Looking at the property type distribution in New River, House properties are the most common (65.4%), reflecting the local real estate landscape.
- Houses represent a significant 65.4% portion, catering likely to families or larger groups.
- The presence of 11.5% Hotel/Boutique listings indicates integration with traditional hospitality.
- Smaller segments like outdoor/unique, unique stays (combined 7.6%) offer potential for unique stay experiences.
New River Airbnb Room Capacity Analysis (2026): Bedroom Distribution
Distribution of Listings by Number of Bedrooms
Room Capacity Insights for New River
- The dominant room capacity in New River is 1 bedroom listings, making up 34.6% of the market. This suggests a strong demand for properties suitable for couples or solo travelers.
- Together, 1 bedroom and 3 bedrooms properties represent 61.5% of the active Airbnb listings in New River, indicating a high concentration in these sizes.
- A significant 34.6% of listings offer 3+ bedrooms, catering to larger groups and families seeking more space in New River.
New River Vacation Rental Guest Capacity Trends (2026)
Distribution of Listings by Guest Capacity
Guest Capacity Insights for New River
- The most common guest capacity trend in New River vacation rentals is listings accommodating 4 guests (26.9%). This suggests the primary traveler segment is likely small families or groups.
- Properties designed for 4 guests and 2 guests dominate the New River STR market, accounting for 53.8% of listings.
- 34.6% of properties accommodate 6+ guests, serving the market segment for larger families or group travel in New River.
- On average, properties in New River are equipped to host 4.2 guests.
New River Airbnb Booking Patterns (2026): Available vs. Booked Days
Available Days Distribution
Booked Days Distribution
Booking Pattern Insights for New River
- The most common availability pattern in New River falls within the 271-366 days range, representing 50% of listings. This suggests many properties have significant open periods on their calendars.
- Approximately 84.6% of listings show high availability (181+ days open annually), indicating potential for increased bookings or specific owner usage patterns.
- For booked days, the 31-90 days range is most frequent in New River (38.5%), reflecting common guest stay durations or potential owner blocking patterns.
- A notable 19.2% of properties secure long booking periods (181+ days booked per year), highlighting successful long-term rental strategies or significant owner usage.
New River Airbnb Minimum Stay Requirements Analysis
Distribution of Listings by Minimum Night Requirement
1 Night
8 listings
30.8% of total
2 Nights
1 listings
3.8% of total
7-29 Nights
4 listings
15.4% of total
30+ Nights
13 listings
50% of total
Key Insights
- The most prevalent minimum stay requirement in New River is 30+ Nights, adopted by 50% of listings. This highlights the market's preference for longer commitments.
- A significant segment (50%) caters to monthly stays (30+ nights) in New River, pointing to opportunities in the extended-stay market.
Recommendations
- Align with the market by considering a 30+ Nights minimum stay, as 50% of New River hosts use this setting.
- Explore offering discounts for stays of 30+ nights to attract the 50% of the market seeking extended stays.
- Adjust minimum nights based on seasonality – potentially shorter during low season and longer during peak demand periods in New River.
New River Airbnb Cancellation Policy Trends Analysis (2026)
Limited
2 listings
7.7% of total
Super Strict 30 Days
1 listings
3.8% of total
Flexible
3 listings
11.5% of total
Moderate
9 listings
34.6% of total
Firm
7 listings
26.9% of total
Strict
4 listings
15.4% of total
Cancellation Policy Insights for New River
- The prevailing Airbnb cancellation policy trend in New River is Moderate, used by 34.6% of listings.
- There's a relatively balanced mix between guest-friendly (46.1%) and stricter (42.3%) policies, offering choices for different guest needs.
Recommendations for Hosts
- Consider adopting a Moderate policy to align with the 34.6% market standard in New River.
- Regularly review your cancellation policy against competitors and market demand shifts in New River.
New River STR Booking Lead Time Analysis (2026)
Average Booking Lead Time by Month
Booking Lead Time Insights for New River
- The overall average booking lead time for vacation rentals in New River is 58 days.
- Guests book furthest in advance for stays during March (average 75 days), likely coinciding with peak travel demand or local events.
- The shortest booking windows occur for stays in June (average 27 days), indicating more last-minute travel plans during this time.
- Seasonally, Spring (62 days avg.) sees the longest lead times, while Summer (43 days avg.) has the shortest, reflecting typical travel planning cycles.
Recommendations for Hosts
- Use the overall average lead time (58 days) as a baseline for your pricing and availability strategy in New River.
- For March stays, consider implementing length-of-stay discounts or slightly higher rates for bookings made less than 75 days out to capitalize on advance planning.
- Target marketing efforts for the Spring season well in advance (at least 62 days) to capture early planners.
- Monitor your own booking lead times against these New River averages to identify opportunities for dynamic pricing adjustments.
Popular & Essential Airbnb Amenities in New River (2026)
Amenity Prevalence
Amenity Insights for New River
- Essential amenities in New River that guests expect include: Air conditioning, Smoke alarm. Lacking these (any) could significantly impact bookings.
- Popular amenities like Wifi, TV, Heating are common but not universal. Offering these can provide a competitive edge.
- Warning: Wifi is not universally provided but is considered essential globally. Ensure reliable Wifi is offered.
Recommendations for Hosts
- Ensure your listing includes all essential amenities for New River: Air conditioning, Smoke alarm.
- Prioritize adding missing essentials: Smoke alarm.
- Consider adding popular differentiators like Wifi or TV to increase appeal.
- Highlight unique or less common amenities you offer (e.g., hot tub, dedicated workspace, EV charger) in your listing description and photos.
- Regularly check competitor amenities in New River to stay competitive.
New River Airbnb Guest Demographics & Profile Analysis (2026)
Guest Profile Summary for New River
- The typical guest profile for Airbnb in New River consists of primarily domestic travelers (90%), often arriving from nearby Phoenix, typically belonging to the Post-2000s (Gen Z/Alpha) group (50%), primarily speaking English or Spanish.
- Domestic travelers account for 90.4% of guests.
- Key international markets include United States (90.4%) and Canada (5.1%).
- Top languages spoken are English (65.9%) followed by Spanish (12.1%).
- A significant demographic segment is the Post-2000s (Gen Z/Alpha) group, representing 50% of guests.
Recommendations for Hosts
- Target domestic marketing efforts towards travelers from Phoenix and Prescott.
- Tailor amenities and listing descriptions to appeal to the dominant Post-2000s (Gen Z/Alpha) demographic (e.g., highlight fast WiFi, smart home features, local guides).
- Highlight unique local experiences or amenities relevant to the primary guest profile.
- Consider seasonal promotions aligned with peak travel times for key origin markets.
Nearby Short-Term Rental Market Comparison
How does the New River Airbnb market stack up against its neighbors? Compare key performance metrics like average monthly revenue, ADR, and occupancy rates in surrounding areas to understand the broader regional STR landscape.
| Market | Active Properties | Monthly Revenue | Daily Rate | Avg. Occupancy |
|---|---|---|---|---|
| Paradise Valley | 67 | $10,566 | $1242.99 | 41% |
| Sedona | 1,658 | $5,761 | $410.99 | 50% |
| Sedona City Limit | 372 | $4,884 | $333.39 | 51% |
| Scottsdale | 4,331 | $4,202 | $370.53 | 47% |
| Carefree | 31 | $4,052 | $522.63 | 39% |
| Cave Creek | 132 | $4,016 | $399.83 | 42% |
| Big Park | 427 | $3,618 | $294.75 | 47% |
| Fountain Hills | 215 | $3,506 | $356.69 | 45% |
| Star Valley | 12 | $3,374 | $279.20 | 43% |
| Payson town limits | 44 | $3,258 | $293.23 | 44% |