Mohave Valley Airbnb Market Analysis 2026: Short Term Rental Data & Vacation Rental Statistics in Arizona, United States
Is Airbnb profitable in Mohave Valley in 2026? Explore comprehensive Airbnb analytics for Mohave Valley, Arizona, United States to uncover income potential. This 2026 STR market report for Mohave Valley, based on AirROI data from February 2025 to January 2026, reveals key trends in the niche market of 88 active listings.
Whether you're considering an Airbnb investment in Mohave Valley, optimizing your existing vacation rental, or exploring rental arbitrage opportunities, understanding the Mohave Valley Airbnb data is crucial. Leveraging the low regulation environment is key to maximizing your short term rental income potential. Let's dive into the specifics.
Key Mohave Valley Airbnb Performance Metrics Overview
Monthly Airbnb Revenue Variations & Income Potential in Mohave Valley (2026)
Understanding the monthly revenue variations for Airbnb listings in Mohave Valley is key to maximizing your short term rental income potential. Seasonality significantly impacts earnings. Our analysis, based on data from the past 12 months, shows that the peak revenue month for STRs in Mohave Valley is typically August, while January often presents the lowest earnings, highlighting opportunities for strategic pricing adjustments during shoulder and low seasons. Explore the typical Airbnb income in Mohave Valley across different performance tiers:
- Best-in-class properties (Top 10%) achieve $5,241+ monthly, often utilizing dynamic pricing and superior guest experiences.
- Strong performing properties (Top 25%) earn $3,277 or more, indicating effective management and desirable locations/amenities.
- Typical properties (Median) generate around $1,927 per month, representing the average market performance.
- Entry-level properties (Bottom 25%) see earnings around $967, often with potential for optimization.
Average Monthly Airbnb Earnings Trend in Mohave Valley
Mohave Valley Airbnb Occupancy Rate Trends (2026)
Maximize your bookings by understanding the Mohave Valley STR occupancy trends. Seasonal demand shifts significantly influence how often properties are booked. Typically, Februarysees the highest demand (peak season occupancy), while September experiences the lowest (low season). Effective strategies, like adjusting minimum stays or offering promotions, can boost occupancy during slower periods. Here's how different property tiers perform in Mohave Valley:
- Best-in-class properties (Top 10%) achieve 75%+ occupancy, indicating high desirability and potentially optimized availability.
- Strong performing properties (Top 25%) maintain 52% or higher occupancy, suggesting good market fit and guest satisfaction.
- Typical properties (Median) have an occupancy rate around 29%.
- Entry-level properties (Bottom 25%) average 14% occupancy, potentially facing higher vacancy.
Average Monthly Occupancy Rate Trend in Mohave Valley
Average Daily Rate (ADR) Airbnb Trends in Mohave Valley (2026)
Effective short term rental pricing strategy in Mohave Valley involves understanding monthly ADR fluctuations. The Average Daily Rate (ADR) for Airbnb in Mohave Valley typically peaks in July and dips lowest during February. Leveraging Airbnb dynamic pricing tools or strategies based on this seasonality can significantly boost revenue. Here's a look at the typical nightly rates achieved:
- Best-in-class properties (Top 10%) command rates of $339+ per night, often due to premium features or locations.
- Strong performing properties (Top 25%) achieve nightly rates of $255 or more.
- Typical properties (Median) charge around $202 per night.
- Entry-level properties (Bottom 25%) earn around $163 per night.
Average Daily Rate (ADR) Trend by Month in Mohave Valley
Get Live Mohave Valley Market Intelligence 👇

Explore Real-time Analytics
Airbnb Seasonality Analysis & Trends in Mohave Valley (2026)
Peak Season (August, July, June)
- Revenue averages $3,533 per month
- Occupancy rates average 37.3%
- Daily rates average $273
Shoulder Season
- Revenue averages $2,425 per month
- Occupancy maintains around 35.5%
- Daily rates hold near $250
Low Season (January, May, December)
- Revenue drops to average $2,130 per month
- Occupancy decreases to average 32.2%
- Daily rates adjust to average $264
Seasonality Insights for Mohave Valley
- The Airbnb seasonality in Mohave Valley shows moderate seasonality with distinct peak and low periods. While the sections above show seasonal averages, it's also insightful to look at the extremes:
- During the high season, the absolute peak month showcases Mohave Valley's highest earning potential, with monthly revenues capable of climbing to $3,653, occupancy reaching a high of 46.5%, and ADRs peaking at $274.
- Conversely, the slowest single month of the year, typically falling within the low season, marks the market's lowest point. In this month, revenue might dip to $1,977, occupancy could drop to 27.6%, and ADRs may adjust down to $231.
- Understanding both the seasonal averages and these monthly peaks and troughs in revenue, occupancy, and ADR is crucial for maximizing your Airbnb profit potential in Mohave Valley.
Seasonal Strategies for Maximizing Profit
- Peak Season: Maximize revenue through premium pricing and potentially longer minimum stays. Ensure high availability.
- Low Season: Offer competitive pricing, special promotions (e.g., extended stay discounts), and flexible cancellation policies. Target off-season travelers like remote workers or budget-conscious guests.
- Shoulder Seasons: Implement dynamic pricing that balances peak and low rates. Target weekend travelers or specific events. Offer slightly more flexible terms than peak season.
- Regularly analyze your own performance against these Mohave Valley seasonality benchmarks and adjust your pricing and availability strategy accordingly.
Best Areas for Airbnb Investment in Mohave Valley (2026)
Exploring the top neighborhoods for short-term rentals in Mohave Valley? This section highlights key areas, outlining why they are attractive for hosts and guests, along with notable local attractions. Consider these locations based on your target guest profile and investment strategy.
| Neighborhood / Area | Why Host Here? (Target Guests & Appeal) | Key Attractions & Landmarks |
|---|---|---|
| Lake Havasu City | A popular tourist destination known for its beautiful lakeside views, outdoor recreation, and the iconic London Bridge. Ideal for hosting travelers seeking water activities and a relaxing getaway. | Lake Havasu State Park, London Bridge, Havasu Falls, SARA Park, Lake Havasu Marina |
| Bullhead City | Located along the Colorado River, Bullhead City attracts visitors looking for water sports and casino entertainment. Great for travelers seeking a vibrant atmosphere and nightlife. | Colorado River, Mojave National Preserve, Edgewater Casino, Bullhead Community Park |
| Kingman | Known as the Heart of Historic Route 66, Kingman offers attractions related to the iconic highway history. It's perfect for those wanting a retro experience and access to scenic drives. | Route 66 Museum, Locomotive Park, Hualapai Mountain Park, Kingman Railroad Museum |
| Oatman | A historic ghost town and former mining town that attracts tourists with its Old West charm and wild burros roaming the streets. Ideal for a unique, nostalgic experience. | Oatman Ghost Town, Historic Route 66, Wild Burros, Golden Nugget Saloon |
| Fort Mohave | A quieter residential area near the Colorado River, suitable for families seeking a peaceful retreat. Nearby attractions offer access to nature and outdoor leisure activities. | Rio Vista Park, Desert Lakes Golf Course, Colorado River |
| Laughlin | A lively resort town known for its casinos and entertainment. Attracts visitors looking for nightlife and gaming options, especially those who enjoy a riverside experience. | Laughlin Riverwalk, Laughlin Convention Center, Casino Drive, Colorado River |
| Topock | A small community with access to the Colorado River, ideal for those looking for a quiet retreat or outdoor activities like fishing and boating in a natural setting. | Topock Gorge, River Access, Wildlife Viewing |
| Needles | A city known for its historic significance along the Colorado River and Route 66, offering a blend of history and outdoor adventure. Perfect for those seeking unique attractions and activities. | Needles Regional Museum, Historic Route 66, Colorado River, Giant Indian |
Understanding Airbnb License Requirements & STR Laws in Mohave Valley (2026)
While Mohave Valley, Arizona, United States currently shows low STR regulations, specific Airbnb license requirements might still exist or change. Always verify the latest short term rental regulations and Airbnb license requirements directly with local government authorities for Mohave Valley to ensure full compliance before hosting.
(Source: AirROI data, 2026, finding no licensed listings among those analyzed)
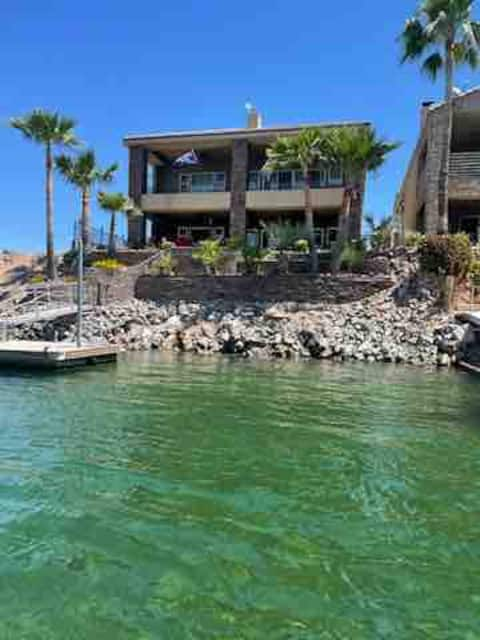
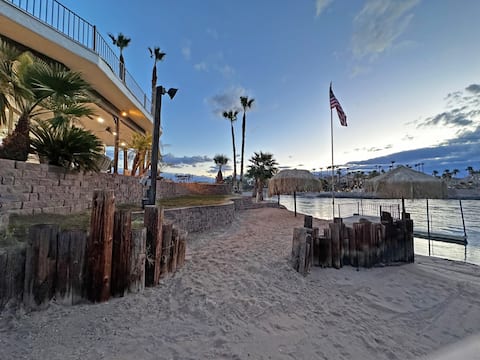
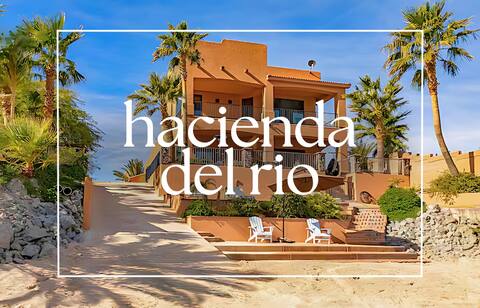
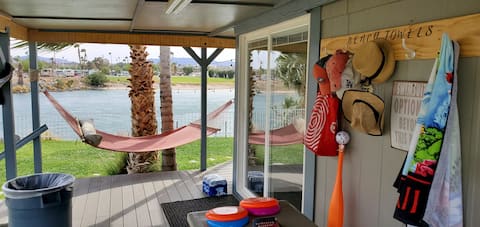
Top Performing Airbnb Properties in Mohave Valley (2026)
Benchmark your potential! Explore examples of top-performing Airbnb properties in Mohave Valleybased on Trailing Twelve Month (TTM) revenue. Analyze their characteristics, revenue, occupancy rate, and ADR to understand what drives success in this market.
Cheerful 5 bedroom home on the river
Entire Place • 5 bedrooms
Tranquil Riverfront Luxury Home!
Entire Place • 4 bedrooms
Stunning Villa | Private Beach & Launch | 5bd
Entire Place • 5 bedrooms

“The One More” a riverfront lot, beach, & launch
Entire Place • 4 bedrooms
Colorado River Cottage & Dock on Colorado River
Entire Place • 4 bedrooms

Centrally Located River Home with Mountain Views!
Entire Place • 3 bedrooms
Note: Performance varies based on location, size, amenities, seasonality, and management quality. Data reflects the past 12 months.
Top Performing Airbnb Hosts in Mohave Valley (2026)
Learn from the best! This table showcases top-performing Airbnb hosts in Mohave Valley based on the number of properties managed and estimated total revenue over the past year. Analyze their scale and performance metrics.
| Host Name | Properties | Grossing Revenue | Stay Reviews | Avg Rating |
|---|---|---|---|---|
| Ryan | 9 | $256,634 | 279 | 4.87/5.0 |
| Rose | 1 | $139,186 | 7 | 5.00/5.0 |
| David | 1 | $96,247 | 18 | 4.89/5.0 |
| Joleen | 3 | $93,565 | 44 | 4.91/5.0 |
| Christopher Francis | 1 | $54,214 | 62 | 4.94/5.0 |
| Evolve | 2 | $47,693 | 172 | 4.80/5.0 |
| Tammy | 1 | $47,538 | 74 | 4.99/5.0 |
| Stephanie | 1 | $42,202 | 135 | 4.97/5.0 |
| Lindsey | 1 | $40,690 | 29 | 4.97/5.0 |
| Alba | 1 | $39,557 | 33 | 4.97/5.0 |
Analyzing the strategies of top hosts, such as their property selection, pricing, and guest communication, can offer valuable lessons for optimizing your own Airbnb operations in Mohave Valley.
Dive Deeper: Advanced Mohave Valley STR Market Data (2026)
Ready to unlock more insights? AirROI provides access to advanced metrics and comprehensive Airbnb data for Mohave Valley. Explore detailed analytics beyond this report to refine your investment strategy, optimize pricing, and maximize your vacation rental profits.
Explore Advanced MetricsMohave Valley Short-Term Rental Market Composition (2026): Property & Room Types
Room Type Distribution
Property Type Distribution
Market Composition Insights for Mohave Valley
- The Mohave Valley Airbnb market composition is heavily skewed towards Entire Home/Apt listings, which make up 100% of the 88 active rentals. This indicates strong guest preference for privacy and space.
- Looking at the property type distribution in Mohave Valley, House properties are the most common (96.6%), reflecting the local real estate landscape.
- Houses represent a significant 96.6% portion, catering likely to families or larger groups.
- Smaller segments like hotel/boutique, unique stays (combined 3.4%) offer potential for unique stay experiences.
Mohave Valley Airbnb Room Capacity Analysis (2026): Bedroom Distribution
Distribution of Listings by Number of Bedrooms
Room Capacity Insights for Mohave Valley
- The dominant room capacity in Mohave Valley is 3 bedrooms listings, making up 70.5% of the market. This suggests a strong demand for properties suitable for families or small groups.
- Together, 3 bedrooms and 4 bedrooms properties represent 86.4% of the active Airbnb listings in Mohave Valley, indicating a high concentration in these sizes.
- A significant 88.7% of listings offer 3+ bedrooms, catering to larger groups and families seeking more space in Mohave Valley.
Mohave Valley Vacation Rental Guest Capacity Trends (2026)
Distribution of Listings by Guest Capacity
Guest Capacity Insights for Mohave Valley
- The most common guest capacity trend in Mohave Valley vacation rentals is listings accommodating 8+ guests (47.7%). This suggests the primary traveler segment is likely larger groups.
- Properties designed for 8+ guests and 6 guests dominate the Mohave Valley STR market, accounting for 82.9% of listings.
- 93.1% of properties accommodate 6+ guests, serving the market segment for larger families or group travel in Mohave Valley.
- On average, properties in Mohave Valley are equipped to host 6.9 guests.
Mohave Valley Airbnb Booking Patterns (2026): Available vs. Booked Days
Available Days Distribution
Booked Days Distribution
Booking Pattern Insights for Mohave Valley
- The most common availability pattern in Mohave Valley falls within the 271-366 days range, representing 58% of listings. This suggests many properties have significant open periods on their calendars.
- Approximately 92.1% of listings show high availability (181+ days open annually), indicating potential for increased bookings or specific owner usage patterns.
- For booked days, the 91-180 days range is most frequent in Mohave Valley (37.5%), reflecting common guest stay durations or potential owner blocking patterns.
- A notable 8.0% of properties secure long booking periods (181+ days booked per year), highlighting successful long-term rental strategies or significant owner usage.
Mohave Valley Airbnb Minimum Stay Requirements Analysis
Distribution of Listings by Minimum Night Requirement
1 Night
13 listings
14.8% of total
2 Nights
47 listings
53.4% of total
3 Nights
8 listings
9.1% of total
4-6 Nights
2 listings
2.3% of total
7-29 Nights
3 listings
3.4% of total
30+ Nights
15 listings
17% of total
Key Insights
- The most prevalent minimum stay requirement in Mohave Valley is 2 Nights, adopted by 53.4% of listings. This highlights the market's preference for shorter, flexible bookings.
- A strong majority (68.2%) of the Mohave Valley Airbnb data shows acceptance of very short stays (1-2 nights), indicating a dynamic, high-turnover market.
- A significant segment (17%) caters to monthly stays (30+ nights) in Mohave Valley, pointing to opportunities in the extended-stay market.
Recommendations
- Align with the market by considering a 2 Nights minimum stay, as 53.4% of Mohave Valley hosts use this setting.
- If feasible, allowing 1-night stays, especially midweek or during low season, could capture last-minute bookings, as only 14.8% currently do.
- A 2-night minimum appears standard (53.4%). Consider this for weekends or peak periods.
- Explore offering discounts for stays of 30+ nights to attract the 17% of the market seeking extended stays.
- Adjust minimum nights based on seasonality – potentially shorter during low season and longer during peak demand periods in Mohave Valley.
Mohave Valley Airbnb Cancellation Policy Trends Analysis (2026)
Limited
1 listings
1.1% of total
Flexible
18 listings
20.5% of total
Moderate
25 listings
28.4% of total
Firm
31 listings
35.2% of total
Strict
13 listings
14.8% of total
Cancellation Policy Insights for Mohave Valley
- The prevailing Airbnb cancellation policy trend in Mohave Valley is Firm, used by 35.2% of listings.
- There's a relatively balanced mix between guest-friendly (48.9%) and stricter (50.0%) policies, offering choices for different guest needs.
Recommendations for Hosts
- Consider adopting a Firm policy to align with the 35.2% market standard in Mohave Valley.
- Using a Strict policy might deter some guests, as only 14.8% of listings use it. Evaluate if potential revenue protection outweighs possible lower booking rates.
- Regularly review your cancellation policy against competitors and market demand shifts in Mohave Valley.
Mohave Valley STR Booking Lead Time Analysis (2026)
Average Booking Lead Time by Month
Booking Lead Time Insights for Mohave Valley
- The overall average booking lead time for vacation rentals in Mohave Valley is 33 days.
- Guests book furthest in advance for stays during March (average 50 days), likely coinciding with peak travel demand or local events.
- The shortest booking windows occur for stays in September (average 24 days), indicating more last-minute travel plans during this time.
- Seasonally, Winter (39 days avg.) sees the longest lead times, while Fall (32 days avg.) has the shortest, reflecting typical travel planning cycles.
Recommendations for Hosts
- Use the overall average lead time (33 days) as a baseline for your pricing and availability strategy in Mohave Valley.
- For March stays, consider implementing length-of-stay discounts or slightly higher rates for bookings made less than 50 days out to capitalize on advance planning.
- Target marketing efforts for the Winter season well in advance (at least 39 days) to capture early planners.
- Monitor your own booking lead times against these Mohave Valley averages to identify opportunities for dynamic pricing adjustments.
Popular & Essential Airbnb Amenities in Mohave Valley (2026)
Amenity Prevalence
Amenity Insights for Mohave Valley
- Essential amenities in Mohave Valley that guests expect include: Air conditioning, TV, Wifi, Smoke alarm, Kitchen, Free parking on premises. Lacking these (any) could significantly impact bookings.
- Popular amenities like Washer, Dishes and silverware, Heating are common but not universal. Offering these can provide a competitive edge.
Recommendations for Hosts
- Ensure your listing includes all essential amenities for Mohave Valley: Air conditioning, TV, Wifi, Smoke alarm, Kitchen, Free parking on premises.
- Prioritize adding missing essentials: Kitchen, Free parking on premises.
- Consider adding popular differentiators like Washer or Dishes and silverware to increase appeal.
- Highlight unique or less common amenities you offer (e.g., hot tub, dedicated workspace, EV charger) in your listing description and photos.
- Regularly check competitor amenities in Mohave Valley to stay competitive.
Mohave Valley Airbnb Guest Demographics & Profile Analysis (2026)
Guest Profile Summary for Mohave Valley
- The typical guest profile for Airbnb in Mohave Valley consists of primarily domestic travelers (92%), often arriving from nearby Los Angeles, typically belonging to the Post-2000s (Gen Z/Alpha) group (50%), primarily speaking English or Spanish.
- Domestic travelers account for 91.8% of guests.
- Key international markets include United States (91.8%) and Germany (1.9%).
- Top languages spoken are English (70.4%) followed by Spanish (20.8%).
- A significant demographic segment is the Post-2000s (Gen Z/Alpha) group, representing 50% of guests.
Recommendations for Hosts
- Target domestic marketing efforts towards travelers from Los Angeles and Las Vegas.
- Tailor amenities and listing descriptions to appeal to the dominant Post-2000s (Gen Z/Alpha) demographic (e.g., highlight fast WiFi, smart home features, local guides).
- Highlight unique local experiences or amenities relevant to the primary guest profile.
- Consider seasonal promotions aligned with peak travel times for key origin markets.
Nearby Short-Term Rental Market Comparison
How does the Mohave Valley Airbnb market stack up against its neighbors? Compare key performance metrics like average monthly revenue, ADR, and occupancy rates in surrounding areas to understand the broader regional STR landscape.
| Market | Active Properties | Monthly Revenue | Daily Rate | Avg. Occupancy |
|---|---|---|---|---|
| Parker Strip | 117 | $3,152 | $393.31 | 33% |
| Needles | 29 | $2,795 | $342.20 | 31% |
| Lake Havasu City | 1,391 | $2,497 | $292.66 | 38% |
| Parker | 25 | $2,132 | $395.50 | 27% |
| Boulder City | 14 | $1,974 | $255.55 | 48% |
| Ehrenberg | 29 | $1,972 | $180.28 | 42% |
| Bullhead City | 412 | $1,963 | $264.33 | 35% |
| Fort Mohave | 11 | $1,844 | $269.69 | 39% |
| Havasu Lake | 10 | $1,746 | $298.52 | 28% |
| Blythe | 14 | $1,652 | $157.40 | 37% |