Mesa Airbnb Market Analysis 2026: Short Term Rental Data & Vacation Rental Statistics in Arizona, United States
Is Airbnb profitable in Mesa in 2026? Explore comprehensive Airbnb analytics for Mesa, Arizona, United States to uncover income potential. This 2026 STR market report for Mesa, based on AirROI data from February 2025 to January 2026, reveals key trends in the bustling market of 1,220 active listings.
Whether you're considering an Airbnb investment in Mesa, optimizing your existing vacation rental, or exploring rental arbitrage opportunities, understanding the Mesa Airbnb data is crucial. Leveraging the low regulation environment is key to maximizing your short term rental income potential. Let's dive into the specifics.
Key Mesa Airbnb Performance Metrics Overview
Monthly Airbnb Revenue Variations & Income Potential in Mesa (2026)
Understanding the monthly revenue variations for Airbnb listings in Mesa is key to maximizing your short term rental income potential. Seasonality significantly impacts earnings. Our analysis, based on data from the past 12 months, shows that the peak revenue month for STRs in Mesa is typically March, while September often presents the lowest earnings, highlighting opportunities for strategic pricing adjustments during shoulder and low seasons. Explore the typical Airbnb income in Mesa across different performance tiers:
- Best-in-class properties (Top 10%) achieve $7,736+ monthly, often utilizing dynamic pricing and superior guest experiences.
- Strong performing properties (Top 25%) earn $4,835 or more, indicating effective management and desirable locations/amenities.
- Typical properties (Median) generate around $2,731 per month, representing the average market performance.
- Entry-level properties (Bottom 25%) see earnings around $1,339, often with potential for optimization.
Average Monthly Airbnb Earnings Trend in Mesa
Mesa Airbnb Occupancy Rate Trends (2026)
Maximize your bookings by understanding the Mesa STR occupancy trends. Seasonal demand shifts significantly influence how often properties are booked. Typically, Marchsees the highest demand (peak season occupancy), while September experiences the lowest (low season). Effective strategies, like adjusting minimum stays or offering promotions, can boost occupancy during slower periods. Here's how different property tiers perform in Mesa:
- Best-in-class properties (Top 10%) achieve 84%+ occupancy, indicating high desirability and potentially optimized availability.
- Strong performing properties (Top 25%) maintain 69% or higher occupancy, suggesting good market fit and guest satisfaction.
- Typical properties (Median) have an occupancy rate around 49%.
- Entry-level properties (Bottom 25%) average 29% occupancy, potentially facing higher vacancy.
Average Monthly Occupancy Rate Trend in Mesa
Average Daily Rate (ADR) Airbnb Trends in Mesa (2026)
Effective short term rental pricing strategy in Mesa involves understanding monthly ADR fluctuations. The Average Daily Rate (ADR) for Airbnb in Mesa typically peaks in January and dips lowest during July. Leveraging Airbnb dynamic pricing tools or strategies based on this seasonality can significantly boost revenue. Here's a look at the typical nightly rates achieved:
- Best-in-class properties (Top 10%) command rates of $404+ per night, often due to premium features or locations.
- Strong performing properties (Top 25%) achieve nightly rates of $272 or more.
- Typical properties (Median) charge around $177 per night.
- Entry-level properties (Bottom 25%) earn around $108 per night.
Average Daily Rate (ADR) Trend by Month in Mesa
Get Live Mesa Market Intelligence 👇

Explore Real-time Analytics
Airbnb Seasonality Analysis & Trends in Mesa (2026)
Peak Season (March, February, December)
- Revenue averages $5,134 per month
- Occupancy rates average 62.3%
- Daily rates average $244
Shoulder Season
- Revenue averages $3,551 per month
- Occupancy maintains around 46.8%
- Daily rates hold near $224
Low Season (July, August, September)
- Revenue drops to average $2,565 per month
- Occupancy decreases to average 39.5%
- Daily rates adjust to average $203
Seasonality Insights for Mesa
- The Airbnb seasonality in Mesa shows highly seasonal trends requiring careful strategy. While the sections above show seasonal averages, it's also insightful to look at the extremes:
- During the high season, the absolute peak month showcases Mesa's highest earning potential, with monthly revenues capable of climbing to $6,236, occupancy reaching a high of 72.6%, and ADRs peaking at $251.
- Conversely, the slowest single month of the year, typically falling within the low season, marks the market's lowest point. In this month, revenue might dip to $2,514, occupancy could drop to 37.4%, and ADRs may adjust down to $199.
- Understanding both the seasonal averages and these monthly peaks and troughs in revenue, occupancy, and ADR is crucial for maximizing your Airbnb profit potential in Mesa.
Seasonal Strategies for Maximizing Profit
- Peak Season: Maximize revenue through premium pricing and potentially longer minimum stays. Ensure high availability.
- Low Season: Offer competitive pricing, special promotions (e.g., extended stay discounts), and flexible cancellation policies. Target off-season travelers like remote workers or budget-conscious guests.
- Shoulder Seasons: Implement dynamic pricing that balances peak and low rates. Target weekend travelers or specific events. Offer slightly more flexible terms than peak season.
- Regularly analyze your own performance against these Mesa seasonality benchmarks and adjust your pricing and availability strategy accordingly.
Best Areas for Airbnb Investment in Mesa (2026)
Exploring the top neighborhoods for short-term rentals in Mesa? This section highlights key areas, outlining why they are attractive for hosts and guests, along with notable local attractions. Consider these locations based on your target guest profile and investment strategy.
| Neighborhood / Area | Why Host Here? (Target Guests & Appeal) | Key Attractions & Landmarks |
|---|---|---|
| Downtown Mesa | The heart of the city, Downtown Mesa is bustling with restaurants, shopping, and cultural attractions. It's popular among travelers looking to experience the vibrant local scene and events throughout the year. | Mesa Arts Center, Mesa Historic Downtown, Arizona Museum of Natural History, i.d.e.a Museum, Mesa Farmers Market |
| Mesa Grande Cultural Park | This area features the impressive ruins of a prehistoric Hohokam village, attracting history enthusiasts and tourists interested in local heritage. It's a peaceful spot with beautiful parks and walking paths. | Mesa Grande, Hohokam ruins, Park trails, Cultural events and programs |
| Red Mountain | This area is known for its stunning natural landscapes and outdoor activities. It's ideal for guests who enjoy hiking, biking, and exploring the outdoors, along with nearby golf courses and parks. | Red Mountain Park, Usery Mountain Regional Park, Golf courses, Scenic views and trails |
| West Mesa | A diverse area with a mix of residential and commercial properties, West Mesa is appealing due to its proximity to attractions like shopping centers, parks, and local eateries. | Superstition Springs Center, Parks and recreation areas, Local dining establishments |
| Eastmark | A new, vibrant community that offers modern amenities and attractions. It's ideal for families and those looking for a more suburban experience, with close ties to outdoor activities and community events. | Eastmark Great Park, Community events, Family-friendly attractions |
| Southeast Mesa | This area is known for its suburban charm and quick access to nearby attractions such as the Superstition Mountains, making it a great base for explorers and tourists. | Superstition Mountain Museum, Nearby hiking and trails, Local restaurants |
| Apache Junction | Just outside Mesa, Apache Junction provides access to natural beauty and outdoor adventures, appealing to guests looking for unique desert experiences and proximity to the mountains. | Lost Dutchman State Park, Superstition Mountains, Historic Goldfield Ghost Town |
| Gilbert | A neighboring town with a family-friendly atmosphere and numerous parks and activities. It's suitable for guests who want a quieter setting while still being close to Mesa's attractions. | Downtown Gilbert, Freestone Park, Local festivals and markets |
Understanding Airbnb License Requirements & STR Laws in Mesa (2026)
While Mesa, Arizona, United States currently shows low STR regulations, specific Airbnb license requirements might still exist or change. Always verify the latest short term rental regulations and Airbnb license requirements directly with local government authorities for Mesa to ensure full compliance before hosting.
(Source: AirROI data, 2026, based on 1% licensed listings)
Top Performing Airbnb Properties in Mesa (2026)
Benchmark your potential! Explore examples of top-performing Airbnb properties in Mesabased on Trailing Twelve Month (TTM) revenue. Analyze their characteristics, revenue, occupancy rate, and ADR to understand what drives success in this market.
Sunset Greens - Golf Simulator, Putting Green, Gam
Entire Place • 8 bedrooms
The Wildflower - Waterslide, Theater, B-ball
Entire Place • 5 bedrooms

Luxury Resort Estate | Pool | Games | 8 Bedrooms
Entire Place • 6 bedrooms
Estate Living w/Pool, Dogs ok/Beach VB, Game Room!
Entire Place • 8 bedrooms

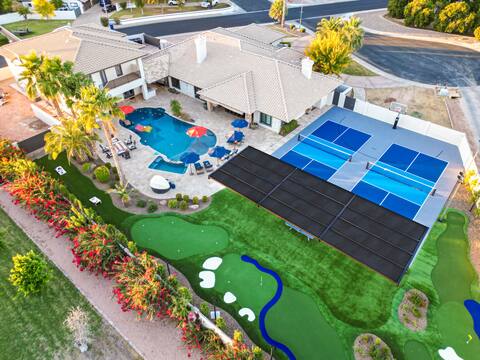
Mini Resort! Heated Pool and Spa, Pickleball
Entire Place • 7 bedrooms

Amazing Views- Luxury 7 Bedroom with Pool/SPA
Entire Place • 6 bedrooms
Note: Performance varies based on location, size, amenities, seasonality, and management quality. Data reflects the past 12 months.
Top Performing Airbnb Hosts in Mesa (2026)
Learn from the best! This table showcases top-performing Airbnb hosts in Mesa based on the number of properties managed and estimated total revenue over the past year. Analyze their scale and performance metrics.
| Host Name | Properties | Grossing Revenue | Stay Reviews | Avg Rating |
|---|---|---|---|---|
| Evolve | 24 | $778,843 | 783 | 4.71/5.0 |
| Evolve | 24 | $702,661 | 278 | 4.84/5.0 |
| Nathan | 2 | $693,963 | 159 | 5.00/5.0 |
| Elite Vacation Rentals | 18 | $675,897 | 335 | 4.81/5.0 |
| Kyle | 6 | $642,422 | 1058 | 4.99/5.0 |
| Josh | 4 | $590,696 | 353 | 4.98/5.0 |
| Sacha | 7 | $502,003 | 1161 | 4.84/5.0 |
| Scott | 3 | $399,620 | 146 | 4.92/5.0 |
| Arizona Vacation Home Rentals | 12 | $377,636 | 70 | 4.88/5.0 |
| Premier Pads | 8 | $377,458 | 118 | 4.49/5.0 |
Analyzing the strategies of top hosts, such as their property selection, pricing, and guest communication, can offer valuable lessons for optimizing your own Airbnb operations in Mesa.
Dive Deeper: Advanced Mesa STR Market Data (2026)
Ready to unlock more insights? AirROI provides access to advanced metrics and comprehensive Airbnb data for Mesa. Explore detailed analytics beyond this report to refine your investment strategy, optimize pricing, and maximize your vacation rental profits.
Explore Advanced MetricsMesa Short-Term Rental Market Composition (2026): Property & Room Types
Room Type Distribution
Property Type Distribution
Market Composition Insights for Mesa
- The Mesa Airbnb market composition is heavily skewed towards Entire Home/Apt listings, which make up 87.2% of the 1,220 active rentals. This indicates strong guest preference for privacy and space.
- Looking at the property type distribution in Mesa, House properties are the most common (73.6%), reflecting the local real estate landscape.
- Houses represent a significant 73.6% portion, catering likely to families or larger groups.
- The presence of 6.3% Hotel/Boutique listings indicates integration with traditional hospitality.
- Smaller segments like others, outdoor/unique, unique stays (combined 4.6%) offer potential for unique stay experiences.
Mesa Airbnb Room Capacity Analysis (2026): Bedroom Distribution
Distribution of Listings by Number of Bedrooms
Room Capacity Insights for Mesa
- The dominant room capacity in Mesa is 3 bedrooms listings, making up 25.7% of the market. This suggests a strong demand for properties suitable for families or small groups.
- Together, 3 bedrooms and 2 bedrooms properties represent 45.2% of the active Airbnb listings in Mesa, indicating a high concentration in these sizes.
- A significant 51.1% of listings offer 3+ bedrooms, catering to larger groups and families seeking more space in Mesa.
Mesa Vacation Rental Guest Capacity Trends (2026)
Distribution of Listings by Guest Capacity
Guest Capacity Insights for Mesa
- The most common guest capacity trend in Mesa vacation rentals is listings accommodating 8+ guests (33.3%). This suggests the primary traveler segment is likely larger groups.
- Properties designed for 8+ guests and 6 guests dominate the Mesa STR market, accounting for 51.1% of listings.
- 54.4% of properties accommodate 6+ guests, serving the market segment for larger families or group travel in Mesa.
- On average, properties in Mesa are equipped to host 5.1 guests.
Mesa Airbnb Booking Patterns (2026): Available vs. Booked Days
Available Days Distribution
Booked Days Distribution
Booking Pattern Insights for Mesa
- The most common availability pattern in Mesa falls within the 271-366 days range, representing 39.3% of listings. This suggests many properties have significant open periods on their calendars.
- Approximately 73.2% of listings show high availability (181+ days open annually), indicating potential for increased bookings or specific owner usage patterns.
- For booked days, the 91-180 days range is most frequent in Mesa (34.4%), reflecting common guest stay durations or potential owner blocking patterns.
- A notable 28.1% of properties secure long booking periods (181+ days booked per year), highlighting successful long-term rental strategies or significant owner usage.
Mesa Airbnb Minimum Stay Requirements Analysis
Distribution of Listings by Minimum Night Requirement
1 Night
187 listings
15.3% of total
2 Nights
243 listings
19.9% of total
3 Nights
119 listings
9.8% of total
4-6 Nights
70 listings
5.7% of total
7-29 Nights
148 listings
12.1% of total
30+ Nights
453 listings
37.1% of total
Key Insights
- The most prevalent minimum stay requirement in Mesa is 30+ Nights, adopted by 37.1% of listings. This highlights the market's preference for longer commitments.
- A significant segment (37.1%) caters to monthly stays (30+ nights) in Mesa, pointing to opportunities in the extended-stay market.
Recommendations
- Align with the market by considering a 30+ Nights minimum stay, as 37.1% of Mesa hosts use this setting.
- If feasible, allowing 1-night stays, especially midweek or during low season, could capture last-minute bookings, as only 15.3% currently do.
- Explore offering discounts for stays of 30+ nights to attract the 37.1% of the market seeking extended stays.
- Adjust minimum nights based on seasonality – potentially shorter during low season and longer during peak demand periods in Mesa.
Mesa Airbnb Cancellation Policy Trends Analysis (2026)
Limited
30 listings
2.5% of total
Super Strict 30 Days
36 listings
3% of total
Super Strict 60 Days
6 listings
0.5% of total
Flexible
215 listings
17.6% of total
Moderate
307 listings
25.2% of total
Firm
457 listings
37.5% of total
Strict
168 listings
13.8% of total
Cancellation Policy Insights for Mesa
- The prevailing Airbnb cancellation policy trend in Mesa is Firm, used by 37.5% of listings.
- A majority (51.3%) of hosts in Mesa utilize Firm or Strict policies, indicating a market where hosts prioritize booking security.
Recommendations for Hosts
- Consider adopting a Firm policy to align with the 37.5% market standard in Mesa.
- Using a Strict policy might deter some guests, as only 13.8% of listings use it. Evaluate if potential revenue protection outweighs possible lower booking rates.
- Regularly review your cancellation policy against competitors and market demand shifts in Mesa.
Mesa STR Booking Lead Time Analysis (2026)
Average Booking Lead Time by Month
Booking Lead Time Insights for Mesa
- The overall average booking lead time for vacation rentals in Mesa is 50 days.
- Guests book furthest in advance for stays during March (average 74 days), likely coinciding with peak travel demand or local events.
- The shortest booking windows occur for stays in June (average 29 days), indicating more last-minute travel plans during this time.
- Seasonally, Winter (62 days avg.) sees the longest lead times, while Summer (31 days avg.) has the shortest, reflecting typical travel planning cycles.
Recommendations for Hosts
- Use the overall average lead time (50 days) as a baseline for your pricing and availability strategy in Mesa.
- For March stays, consider implementing length-of-stay discounts or slightly higher rates for bookings made less than 74 days out to capitalize on advance planning.
- Target marketing efforts for the Winter season well in advance (at least 62 days) to capture early planners.
- Monitor your own booking lead times against these Mesa averages to identify opportunities for dynamic pricing adjustments.
Popular & Essential Airbnb Amenities in Mesa (2026)
Amenity Prevalence
Amenity Insights for Mesa
- Essential amenities in Mesa that guests expect include: Air conditioning, Wifi, TV, Smoke alarm, Free parking on premises. Lacking these (any) could significantly impact bookings.
- Popular amenities like Heating, Kitchen, Hot water are common but not universal. Offering these can provide a competitive edge.
Recommendations for Hosts
- Ensure your listing includes all essential amenities for Mesa: Air conditioning, Wifi, TV, Smoke alarm, Free parking on premises.
- Prioritize adding missing essentials: Air conditioning, Wifi, TV, Smoke alarm, Free parking on premises.
- Consider adding popular differentiators like Heating or Kitchen to increase appeal.
- Highlight unique or less common amenities you offer (e.g., hot tub, dedicated workspace, EV charger) in your listing description and photos.
- Regularly check competitor amenities in Mesa to stay competitive.
Mesa Airbnb Guest Demographics & Profile Analysis (2026)
Guest Profile Summary for Mesa
- The typical guest profile for Airbnb in Mesa consists of primarily domestic travelers (95%), often arriving from nearby Phoenix, typically belonging to the Post-2000s (Gen Z/Alpha) group (50%), primarily speaking English or Spanish.
- Domestic travelers account for 94.6% of guests.
- Key international markets include United States (94.6%) and Canada (2.7%).
- Top languages spoken are English (74.2%) followed by Spanish (14.5%).
- A significant demographic segment is the Post-2000s (Gen Z/Alpha) group, representing 50% of guests.
Recommendations for Hosts
- Target domestic marketing efforts towards travelers from Phoenix and Tucson.
- Tailor amenities and listing descriptions to appeal to the dominant Post-2000s (Gen Z/Alpha) demographic (e.g., highlight fast WiFi, smart home features, local guides).
- Highlight unique local experiences or amenities relevant to the primary guest profile.
- Consider seasonal promotions aligned with peak travel times for key origin markets.
Nearby Short-Term Rental Market Comparison
How does the Mesa Airbnb market stack up against its neighbors? Compare key performance metrics like average monthly revenue, ADR, and occupancy rates in surrounding areas to understand the broader regional STR landscape.
| Market | Active Properties | Monthly Revenue | Daily Rate | Avg. Occupancy |
|---|---|---|---|---|
| Paradise Valley | 67 | $10,566 | $1242.99 | 41% |
| Sedona | 1,658 | $5,761 | $410.99 | 50% |
| Sedona City Limit | 372 | $4,884 | $333.39 | 51% |
| Scottsdale | 4,331 | $4,202 | $370.53 | 47% |
| Carefree | 31 | $4,052 | $522.63 | 39% |
| Cave Creek | 132 | $4,016 | $399.83 | 42% |
| Big Park | 427 | $3,618 | $294.75 | 47% |
| Fountain Hills | 215 | $3,506 | $356.69 | 45% |
| Star Valley | 12 | $3,374 | $279.20 | 43% |
| Payson town limits | 44 | $3,258 | $293.23 | 44% |