Lake Havasu City Airbnb Market Analysis 2026: Short Term Rental Data & Vacation Rental Statistics in Arizona, United States
Is Airbnb profitable in Lake Havasu City in 2026? Explore comprehensive Airbnb analytics for Lake Havasu City, Arizona, United States to uncover income potential. This 2026 STR market report for Lake Havasu City, based on AirROI data from February 2025 to January 2026, reveals key trends in the bustling market of 1,391 active listings.
Whether you're considering an Airbnb investment in Lake Havasu City, optimizing your existing vacation rental, or exploring rental arbitrage opportunities, understanding the Lake Havasu City Airbnb data is crucial. Leveraging the low regulation environment is key to maximizing your short term rental income potential. Let's dive into the specifics.
Key Lake Havasu City Airbnb Performance Metrics Overview
Monthly Airbnb Revenue Variations & Income Potential in Lake Havasu City (2026)
Understanding the monthly revenue variations for Airbnb listings in Lake Havasu City is key to maximizing your short term rental income potential. Seasonality significantly impacts earnings. Our analysis, based on data from the past 12 months, shows that the peak revenue month for STRs in Lake Havasu City is typically March, while November often presents the lowest earnings, highlighting opportunities for strategic pricing adjustments during shoulder and low seasons. Explore the typical Airbnb income in Lake Havasu City across different performance tiers:
- Best-in-class properties (Top 10%) achieve $7,195+ monthly, often utilizing dynamic pricing and superior guest experiences.
- Strong performing properties (Top 25%) earn $4,698 or more, indicating effective management and desirable locations/amenities.
- Typical properties (Median) generate around $2,743 per month, representing the average market performance.
- Entry-level properties (Bottom 25%) see earnings around $1,448, often with potential for optimization.
Average Monthly Airbnb Earnings Trend in Lake Havasu City
Lake Havasu City Airbnb Occupancy Rate Trends (2026)
Maximize your bookings by understanding the Lake Havasu City STR occupancy trends. Seasonal demand shifts significantly influence how often properties are booked. Typically, Marchsees the highest demand (peak season occupancy), while December experiences the lowest (low season). Effective strategies, like adjusting minimum stays or offering promotions, can boost occupancy during slower periods. Here's how different property tiers perform in Lake Havasu City:
- Best-in-class properties (Top 10%) achieve 73%+ occupancy, indicating high desirability and potentially optimized availability.
- Strong performing properties (Top 25%) maintain 56% or higher occupancy, suggesting good market fit and guest satisfaction.
- Typical properties (Median) have an occupancy rate around 37%.
- Entry-level properties (Bottom 25%) average 20% occupancy, potentially facing higher vacancy.
Average Monthly Occupancy Rate Trend in Lake Havasu City
Average Daily Rate (ADR) Airbnb Trends in Lake Havasu City (2026)
Effective short term rental pricing strategy in Lake Havasu City involves understanding monthly ADR fluctuations. The Average Daily Rate (ADR) for Airbnb in Lake Havasu City typically peaks in January and dips lowest during February. Leveraging Airbnb dynamic pricing tools or strategies based on this seasonality can significantly boost revenue. Here's a look at the typical nightly rates achieved:
- Best-in-class properties (Top 10%) command rates of $464+ per night, often due to premium features or locations.
- Strong performing properties (Top 25%) achieve nightly rates of $338 or more.
- Typical properties (Median) charge around $250 per night.
- Entry-level properties (Bottom 25%) earn around $186 per night.
Average Daily Rate (ADR) Trend by Month in Lake Havasu City
Get Live Lake Havasu City Market Intelligence 👇

Explore Real-time Analytics
Airbnb Seasonality Analysis & Trends in Lake Havasu City (2026)
Peak Season (March, July, June)
- Revenue averages $4,796 per month
- Occupancy rates average 50.4%
- Daily rates average $287
Shoulder Season
- Revenue averages $3,458 per month
- Occupancy maintains around 38.9%
- Daily rates hold near $283
Low Season (September, November, December)
- Revenue drops to average $2,699 per month
- Occupancy decreases to average 28.8%
- Daily rates adjust to average $300
Seasonality Insights for Lake Havasu City
- The Airbnb seasonality in Lake Havasu City shows highly seasonal trends requiring careful strategy. While the sections above show seasonal averages, it's also insightful to look at the extremes:
- During the high season, the absolute peak month showcases Lake Havasu City's highest earning potential, with monthly revenues capable of climbing to $5,351, occupancy reaching a high of 63.2%, and ADRs peaking at $303.
- Conversely, the slowest single month of the year, typically falling within the low season, marks the market's lowest point. In this month, revenue might dip to $2,605, occupancy could drop to 28.3%, and ADRs may adjust down to $260.
- Understanding both the seasonal averages and these monthly peaks and troughs in revenue, occupancy, and ADR is crucial for maximizing your Airbnb profit potential in Lake Havasu City.
Seasonal Strategies for Maximizing Profit
- Peak Season: Maximize revenue through premium pricing and potentially longer minimum stays. Ensure high availability.
- Low Season: Offer competitive pricing, special promotions (e.g., extended stay discounts), and flexible cancellation policies. Target off-season travelers like remote workers or budget-conscious guests.
- Shoulder Seasons: Implement dynamic pricing that balances peak and low rates. Target weekend travelers or specific events. Offer slightly more flexible terms than peak season.
- Regularly analyze your own performance against these Lake Havasu City seasonality benchmarks and adjust your pricing and availability strategy accordingly.
Best Areas for Airbnb Investment in Lake Havasu City (2026)
Exploring the top neighborhoods for short-term rentals in Lake Havasu City? This section highlights key areas, outlining why they are attractive for hosts and guests, along with notable local attractions. Consider these locations based on your target guest profile and investment strategy.
| Neighborhood / Area | Why Host Here? (Target Guests & Appeal) | Key Attractions & Landmarks |
|---|---|---|
| London Bridge Beach | A popular destination for sunbathers and water sports enthusiasts, offering direct beach access and picturesque views. Ideal for families and tourists looking to enjoy outdoor activities. | London Bridge, Lake Havasu State Park, Rotary Park, Havasu Island, Watercraft rentals, Beachfront dining |
| North Beach | Known for its family-friendly atmosphere and ample recreational options. A great area for families and social gatherings, with nearby parks and facilities. | Havasu Falls, Lake Havasu City Parks, Public Beach, Water Sports Rentals, Picnic Areas |
| Downtown Lake Havasu | The bustling heart of Lake Havasu City, filled with restaurants, shops, and entertainment options. Perfect for visitors wanting to experience local culture and nightlife. | Lake Havasu Museum of History, London Bridge Shopping District, Restaurants and Nightlife, Walking Trails, Seasonal Events |
| Lake Havasu State Park | Offering attractions for both campers and day visitors, this area is perfect for nature lovers looking for outdoor adventure and scenic beauty. | Scenic Trails, Fishing Areas, Camping Facilities, Picnic Spots, Hiking Trails |
| Avi Resort and Casino Area | A great spot for those seeking entertainment and gaming options, located near the Colorado River. Ideal for visitors looking for a lively atmosphere. | Avi Resort Casino, Colorado River Activities, Dining and Entertainment, Water Sports |
| Havasu Heights | Offering panoramic views and a quieter atmosphere, this area is ideal for those looking for a peaceful retreat while still being close to the lake amenities. | Hiking and Biking Trails, Scenic Viewpoints, Wildlife Watching, Stargazing Spots |
| Cattail Cove State Park | An excellent location for camping and enjoying nature, popular among outdoor enthusiasts for its scenic views and recreational activities. | Camping Sites, Swimming Areas, Trails, Fishing Spots |
| Desert Hills | An area known for its desert landscape and proximity to outdoor activities. Ideal for those seeking adventure like off-road riding and hiking. | Hiking Trails, Off-road Biking, Desert Wildlife, Scenic Views |
Understanding Airbnb License Requirements & STR Laws in Lake Havasu City (2026)
While Lake Havasu City, Arizona, United States currently shows low STR regulations, specific Airbnb license requirements might still exist or change. Always verify the latest short term rental regulations and Airbnb license requirements directly with local government authorities for Lake Havasu City to ensure full compliance before hosting.
(Source: AirROI data, 2026, based on 0% licensed listings)
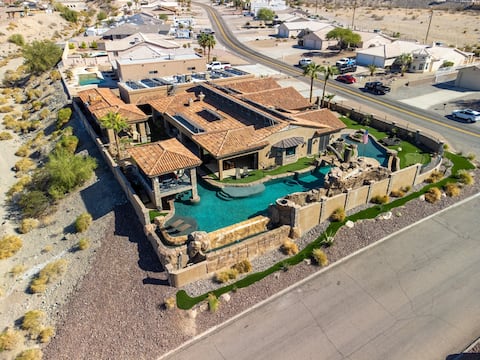
Top Performing Airbnb Properties in Lake Havasu City (2026)
Benchmark your potential! Explore examples of top-performing Airbnb properties in Lake Havasu Citybased on Trailing Twelve Month (TTM) revenue. Analyze their characteristics, revenue, occupancy rate, and ADR to understand what drives success in this market.
Iconic Views w/Pickleball & Gameroom | Pool & Spa
Entire Place • 7 bedrooms
7BR Pickleball Resort Near Marina | Pool & Spa
Entire Place • 7 bedrooms
2 Master Suites/2 Junior suites/2 RV bays & Cabana
Entire Place • 5 bedrooms
Epic Lake Views | Pool & Spa | Slps 20 Near Marina
Entire Place • 5 bedrooms
Lake Havasu Lagoon
Entire Place • 6 bedrooms
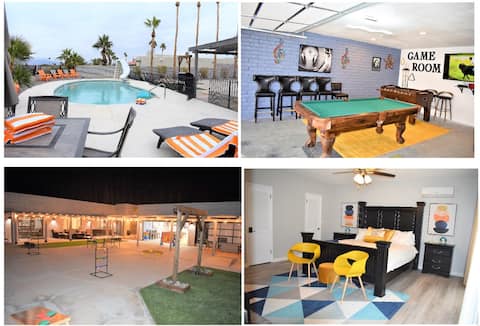
Mansion- Pool, Spa, Game Room, Casita, Fire Table
Entire Place • 6 bedrooms
Note: Performance varies based on location, size, amenities, seasonality, and management quality. Data reflects the past 12 months.
Top Performing Airbnb Hosts in Lake Havasu City (2026)
Learn from the best! This table showcases top-performing Airbnb hosts in Lake Havasu City based on the number of properties managed and estimated total revenue over the past year. Analyze their scale and performance metrics.
| Host Name | Properties | Grossing Revenue | Stay Reviews | Avg Rating |
|---|---|---|---|---|
| Kristi | 54 | $2,469,288 | 2224 | 4.90/5.0 |
| Evolve | 67 | $1,512,298 | 3543 | 4.77/5.0 |
| Evolve | 56 | $1,389,020 | 868 | 4.82/5.0 |
| Matt And Lisa | 9 | $1,343,283 | 335 | 5.00/5.0 |
| Lexis & Zach - Ready To Getawa | 29 | $885,237 | 971 | 4.87/5.0 |
| Freedom Point Property Managem | 16 | $763,177 | 598 | 4.92/5.0 |
| Evolve | 31 | $751,500 | 885 | 4.66/5.0 |
| Ryan | 22 | $700,195 | 842 | 4.89/5.0 |
| Layla | 14 | $400,428 | 255 | 4.84/5.0 |
| Jamie - Dube Vacation Rentals | 3 | $389,700 | 313 | 4.97/5.0 |
Analyzing the strategies of top hosts, such as their property selection, pricing, and guest communication, can offer valuable lessons for optimizing your own Airbnb operations in Lake Havasu City.
Dive Deeper: Advanced Lake Havasu City STR Market Data (2026)
Ready to unlock more insights? AirROI provides access to advanced metrics and comprehensive Airbnb data for Lake Havasu City. Explore detailed analytics beyond this report to refine your investment strategy, optimize pricing, and maximize your vacation rental profits.
Explore Advanced MetricsLake Havasu City Short-Term Rental Market Composition (2026): Property & Room Types
Room Type Distribution
Property Type Distribution
Market Composition Insights for Lake Havasu City
- The Lake Havasu City Airbnb market composition is heavily skewed towards Entire Home/Apt listings, which make up 98.4% of the 1,391 active rentals. This indicates strong guest preference for privacy and space.
- Looking at the property type distribution in Lake Havasu City, House properties are the most common (87.2%), reflecting the local real estate landscape.
- Houses represent a significant 87.2% portion, catering likely to families or larger groups.
- Smaller segments like hotel/boutique, others, outdoor/unique, unique stays (combined 3.5%) offer potential for unique stay experiences.
Lake Havasu City Airbnb Room Capacity Analysis (2026): Bedroom Distribution
Distribution of Listings by Number of Bedrooms
Room Capacity Insights for Lake Havasu City
- The dominant room capacity in Lake Havasu City is 3 bedrooms listings, making up 50.5% of the market. This suggests a strong demand for properties suitable for families or small groups.
- Together, 3 bedrooms and 4 bedrooms properties represent 68.5% of the active Airbnb listings in Lake Havasu City, indicating a high concentration in these sizes.
- A significant 76.0% of listings offer 3+ bedrooms, catering to larger groups and families seeking more space in Lake Havasu City.
Lake Havasu City Vacation Rental Guest Capacity Trends (2026)
Distribution of Listings by Guest Capacity
Guest Capacity Insights for Lake Havasu City
- The most common guest capacity trend in Lake Havasu City vacation rentals is listings accommodating 8+ guests (58.2%). This suggests the primary traveler segment is likely larger groups.
- Properties designed for 8+ guests and 6 guests dominate the Lake Havasu City STR market, accounting for 78.7% of listings.
- 84.5% of properties accommodate 6+ guests, serving the market segment for larger families or group travel in Lake Havasu City.
- On average, properties in Lake Havasu City are equipped to host 6.8 guests.
Lake Havasu City Airbnb Booking Patterns (2026): Available vs. Booked Days
Available Days Distribution
Booked Days Distribution
Booking Pattern Insights for Lake Havasu City
- The most common availability pattern in Lake Havasu City falls within the 271-366 days range, representing 49.5% of listings. This suggests many properties have significant open periods on their calendars.
- Approximately 88.0% of listings show high availability (181+ days open annually), indicating potential for increased bookings or specific owner usage patterns.
- For booked days, the 91-180 days range is most frequent in Lake Havasu City (39.8%), reflecting common guest stay durations or potential owner blocking patterns.
- A notable 13.0% of properties secure long booking periods (181+ days booked per year), highlighting successful long-term rental strategies or significant owner usage.
Lake Havasu City Airbnb Minimum Stay Requirements Analysis
Distribution of Listings by Minimum Night Requirement
1 Night
123 listings
8.8% of total
2 Nights
562 listings
40.4% of total
3 Nights
178 listings
12.8% of total
4-6 Nights
37 listings
2.7% of total
7-29 Nights
74 listings
5.3% of total
30+ Nights
416 listings
29.9% of total
Key Insights
- The most prevalent minimum stay requirement in Lake Havasu City is 2 Nights, adopted by 40.4% of listings. This highlights the market's preference for shorter, flexible bookings.
- A significant segment (29.9%) caters to monthly stays (30+ nights) in Lake Havasu City, pointing to opportunities in the extended-stay market.
Recommendations
- Align with the market by considering a 2 Nights minimum stay, as 40.4% of Lake Havasu City hosts use this setting.
- If feasible, allowing 1-night stays, especially midweek or during low season, could capture last-minute bookings, as only 8.8% currently do.
- A 2-night minimum appears standard (40.4%). Consider this for weekends or peak periods.
- Explore offering discounts for stays of 30+ nights to attract the 29.9% of the market seeking extended stays.
- Adjust minimum nights based on seasonality – potentially shorter during low season and longer during peak demand periods in Lake Havasu City.
Lake Havasu City Airbnb Cancellation Policy Trends Analysis (2026)
Limited
18 listings
1.3% of total
Super Strict 30 Days
26 listings
1.9% of total
Flexible
155 listings
11.2% of total
Moderate
337 listings
24.4% of total
Firm
522 listings
37.8% of total
Strict
324 listings
23.4% of total
Cancellation Policy Insights for Lake Havasu City
- The prevailing Airbnb cancellation policy trend in Lake Havasu City is Firm, used by 37.8% of listings.
- A majority (61.2%) of hosts in Lake Havasu City utilize Firm or Strict policies, indicating a market where hosts prioritize booking security.
Recommendations for Hosts
- Consider adopting a Firm policy to align with the 37.8% market standard in Lake Havasu City.
- Regularly review your cancellation policy against competitors and market demand shifts in Lake Havasu City.
Lake Havasu City STR Booking Lead Time Analysis (2026)
Average Booking Lead Time by Month
Booking Lead Time Insights for Lake Havasu City
- The overall average booking lead time for vacation rentals in Lake Havasu City is 53 days.
- Guests book furthest in advance for stays during February (average 94 days), likely coinciding with peak travel demand or local events.
- The shortest booking windows occur for stays in September (average 37 days), indicating more last-minute travel plans during this time.
- Seasonally, Winter (73 days avg.) sees the longest lead times, while Summer (41 days avg.) has the shortest, reflecting typical travel planning cycles.
Recommendations for Hosts
- Use the overall average lead time (53 days) as a baseline for your pricing and availability strategy in Lake Havasu City.
- For February stays, consider implementing length-of-stay discounts or slightly higher rates for bookings made less than 94 days out to capitalize on advance planning.
- Target marketing efforts for the Winter season well in advance (at least 73 days) to capture early planners.
- Monitor your own booking lead times against these Lake Havasu City averages to identify opportunities for dynamic pricing adjustments.
Popular & Essential Airbnb Amenities in Lake Havasu City (2026)
Amenity Prevalence
Amenity Insights for Lake Havasu City
- Essential amenities in Lake Havasu City that guests expect include: Air conditioning, Wifi, TV, Kitchen, Smoke alarm, Free parking on premises. Lacking these (any) could significantly impact bookings.
- Popular amenities like Refrigerator, Heating, Dishes and silverware are common but not universal. Offering these can provide a competitive edge.
Recommendations for Hosts
- Ensure your listing includes all essential amenities for Lake Havasu City: Air conditioning, Wifi, TV, Kitchen, Smoke alarm, Free parking on premises.
- Prioritize adding missing essentials: Air conditioning, Wifi, TV, Kitchen, Smoke alarm, Free parking on premises.
- Consider adding popular differentiators like Refrigerator or Heating to increase appeal.
- Highlight unique or less common amenities you offer (e.g., hot tub, dedicated workspace, EV charger) in your listing description and photos.
- Regularly check competitor amenities in Lake Havasu City to stay competitive.
Lake Havasu City Airbnb Guest Demographics & Profile Analysis (2026)
Guest Profile Summary for Lake Havasu City
- The typical guest profile for Airbnb in Lake Havasu City consists of primarily domestic travelers (98%), often arriving from nearby Las Vegas, typically belonging to the Post-2000s (Gen Z/Alpha) group (50%), primarily speaking English or Spanish.
- Domestic travelers account for 97.5% of guests.
- Key international markets include United States (97.5%) and Canada (0.9%).
- Top languages spoken are English (75.1%) followed by Spanish (17.6%).
- A significant demographic segment is the Post-2000s (Gen Z/Alpha) group, representing 50% of guests.
Recommendations for Hosts
- Target domestic marketing efforts towards travelers from Las Vegas and Los Angeles.
- Tailor amenities and listing descriptions to appeal to the dominant Post-2000s (Gen Z/Alpha) demographic (e.g., highlight fast WiFi, smart home features, local guides).
- Highlight unique local experiences or amenities relevant to the primary guest profile.
- Consider seasonal promotions aligned with peak travel times for key origin markets.
Nearby Short-Term Rental Market Comparison
How does the Lake Havasu City Airbnb market stack up against its neighbors? Compare key performance metrics like average monthly revenue, ADR, and occupancy rates in surrounding areas to understand the broader regional STR landscape.
| Market | Active Properties | Monthly Revenue | Daily Rate | Avg. Occupancy |
|---|---|---|---|---|
| Parker Strip | 117 | $3,152 | $393.31 | 33% |
| Needles | 29 | $2,795 | $342.20 | 31% |
| Parker | 25 | $2,132 | $395.50 | 27% |
| Boulder City | 14 | $1,974 | $255.55 | 48% |
| Ehrenberg | 29 | $1,972 | $180.28 | 42% |
| Bullhead City | 412 | $1,963 | $264.33 | 35% |
| Fort Mohave | 11 | $1,844 | $269.69 | 39% |
| Mohave Valley | 88 | $1,775 | $257.47 | 35% |
| Havasu Lake | 10 | $1,746 | $298.52 | 28% |
| Blythe | 14 | $1,652 | $157.40 | 37% |