Holbrook Airbnb Market Analysis 2026: Short Term Rental Data & Vacation Rental Statistics in Arizona, United States
Is Airbnb profitable in Holbrook in 2026? Explore comprehensive Airbnb analytics for Holbrook, Arizona, United States to uncover income potential. This 2026 STR market report for Holbrook, based on AirROI data from February 2025 to January 2026, reveals key trends in the niche market of 27 active listings.
Whether you're considering an Airbnb investment in Holbrook, optimizing your existing vacation rental, or exploring rental arbitrage opportunities, understanding the Holbrook Airbnb data is crucial. Leveraging the low regulation environment is key to maximizing your short term rental income potential. Let's dive into the specifics.
Key Holbrook Airbnb Performance Metrics Overview
Monthly Airbnb Revenue Variations & Income Potential in Holbrook (2026)
Understanding the monthly revenue variations for Airbnb listings in Holbrook is key to maximizing your short term rental income potential. Seasonality significantly impacts earnings. Our analysis, based on data from the past 12 months, shows that the peak revenue month for STRs in Holbrook is typically May, while August often presents the lowest earnings, highlighting opportunities for strategic pricing adjustments during shoulder and low seasons. Explore the typical Airbnb income in Holbrook across different performance tiers:
- Best-in-class properties (Top 10%) achieve $2,603+ monthly, often utilizing dynamic pricing and superior guest experiences.
- Strong performing properties (Top 25%) earn $2,090 or more, indicating effective management and desirable locations/amenities.
- Typical properties (Median) generate around $1,056 per month, representing the average market performance.
- Entry-level properties (Bottom 25%) see earnings around $348, often with potential for optimization.
Average Monthly Airbnb Earnings Trend in Holbrook
Holbrook Airbnb Occupancy Rate Trends (2026)
Maximize your bookings by understanding the Holbrook STR occupancy trends. Seasonal demand shifts significantly influence how often properties are booked. Typically, Maysees the highest demand (peak season occupancy), while August experiences the lowest (low season). Effective strategies, like adjusting minimum stays or offering promotions, can boost occupancy during slower periods. Here's how different property tiers perform in Holbrook:
- Best-in-class properties (Top 10%) achieve 78%+ occupancy, indicating high desirability and potentially optimized availability.
- Strong performing properties (Top 25%) maintain 66% or higher occupancy, suggesting good market fit and guest satisfaction.
- Typical properties (Median) have an occupancy rate around 42%.
- Entry-level properties (Bottom 25%) average 15% occupancy, potentially facing higher vacancy.
Average Monthly Occupancy Rate Trend in Holbrook
Average Daily Rate (ADR) Airbnb Trends in Holbrook (2026)
Effective short term rental pricing strategy in Holbrook involves understanding monthly ADR fluctuations. The Average Daily Rate (ADR) for Airbnb in Holbrook typically peaks in October and dips lowest during April. Leveraging Airbnb dynamic pricing tools or strategies based on this seasonality can significantly boost revenue. Here's a look at the typical nightly rates achieved:
- Best-in-class properties (Top 10%) command rates of $120+ per night, often due to premium features or locations.
- Strong performing properties (Top 25%) achieve nightly rates of $98 or more.
- Typical properties (Median) charge around $76 per night.
- Entry-level properties (Bottom 25%) earn around $63 per night.
Average Daily Rate (ADR) Trend by Month in Holbrook
Get Live Holbrook Market Intelligence 👇

Explore Real-time Analytics
Airbnb Seasonality Analysis & Trends in Holbrook (2026)
Peak Season (May, December, March)
- Revenue averages $1,537 per month
- Occupancy rates average 49.8%
- Daily rates average $80
Shoulder Season
- Revenue averages $1,267 per month
- Occupancy maintains around 42.5%
- Daily rates hold near $82
Low Season (July, August, September)
- Revenue drops to average $1,053 per month
- Occupancy decreases to average 34.7%
- Daily rates adjust to average $82
Seasonality Insights for Holbrook
- The Airbnb seasonality in Holbrook shows moderate seasonality with distinct peak and low periods. While the sections above show seasonal averages, it's also insightful to look at the extremes:
- During the high season, the absolute peak month showcases Holbrook's highest earning potential, with monthly revenues capable of climbing to $1,623, occupancy reaching a high of 50.7%, and ADRs peaking at $86.
- Conversely, the slowest single month of the year, typically falling within the low season, marks the market's lowest point. In this month, revenue might dip to $996, occupancy could drop to 33.0%, and ADRs may adjust down to $76.
- Understanding both the seasonal averages and these monthly peaks and troughs in revenue, occupancy, and ADR is crucial for maximizing your Airbnb profit potential in Holbrook.
Seasonal Strategies for Maximizing Profit
- Peak Season: Maximize revenue through premium pricing and potentially longer minimum stays. Ensure high availability.
- Low Season: Offer competitive pricing, special promotions (e.g., extended stay discounts), and flexible cancellation policies. Target off-season travelers like remote workers or budget-conscious guests.
- Shoulder Seasons: Implement dynamic pricing that balances peak and low rates. Target weekend travelers or specific events. Offer slightly more flexible terms than peak season.
- Regularly analyze your own performance against these Holbrook seasonality benchmarks and adjust your pricing and availability strategy accordingly.
Best Areas for Airbnb Investment in Holbrook (2026)
Exploring the top neighborhoods for short-term rentals in Holbrook? This section highlights key areas, outlining why they are attractive for hosts and guests, along with notable local attractions. Consider these locations based on your target guest profile and investment strategy.
| Neighborhood / Area | Why Host Here? (Target Guests & Appeal) | Key Attractions & Landmarks |
|---|---|---|
| Historic Holbrook | Known for its rich history and Route 66 heritage, this area attracts tourists all year round, especially those interested in the Wild West and classic Americana. | Route 66, Historic Holbrook Railway Station, Old West Navajo County Courthouse, Museum of Northern Arizona, Wild Horse Lake |
| Petrified Forest National Park | A stunning natural park featuring fossilized trees and unique geological formations. It's a popular destination for nature lovers and photographers. | Petrified Forest, Painted Desert, Blue Mesa, Agate Bridge, Historic Painted Desert Inn |
| Navajo County Fairgrounds | A hub for local events and fairs, this area attracts visitors during fair season and hosts various cultural events throughout the year. | Navajo County Fair, Various cultural festivals, Local farmers markets, Exotic car show |
| Lyman Lake State Park | A beautiful recreational area popular for water activities like fishing, boating, and camping, attracting families and outdoor enthusiasts. | Lyman Lake, Fishing and boating opportunities, Camping sites, Bird watching, Nature trails |
| Downtown Holbrook | The main commercial area with shops, restaurants, and local attractions, offering visitors a taste of the local culture and community. | Local shops, Restaurants, Community events, Art installations, Historic buildings |
| Painted Desert | Famous for its vibrant colors and breathtaking landscapes, this area draws visitors looking to experience unique natural wonders. | Scenic viewpoints, Photography spots, Nature walks, Visitor center, Wildlife viewing |
| Winslow, Arizona (Nearby) | Just a short drive from Holbrook, Winslow is famous for its iconic 'Standin' on the Corner' park, attracting fans of the Eagles and Route 66 enthusiasts. | Standin' on the Corner Park, Route 66 memorabilia, Historic downtown Winslow, Old Trails Museum |
| Little Colorado River Gorge | This natural gorge offers stunning views and hiking opportunities, popular among adventurous travelers and nature lovers. | Gorge viewpoints, Hiking trails, Wildlife viewing, Picnic areas, Photography spots |
Understanding Airbnb License Requirements & STR Laws in Holbrook (2026)
While Holbrook, Arizona, United States currently shows low STR regulations, specific Airbnb license requirements might still exist or change. Always verify the latest short term rental regulations and Airbnb license requirements directly with local government authorities for Holbrook to ensure full compliance before hosting.
(Source: AirROI data, 2026, finding no licensed listings among those analyzed)
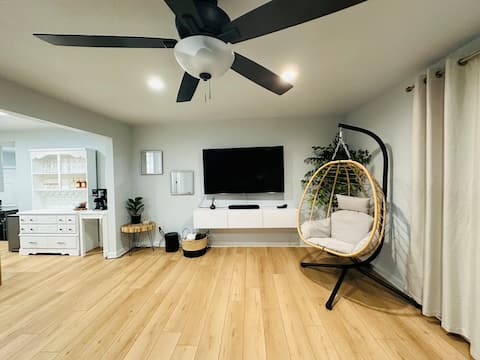
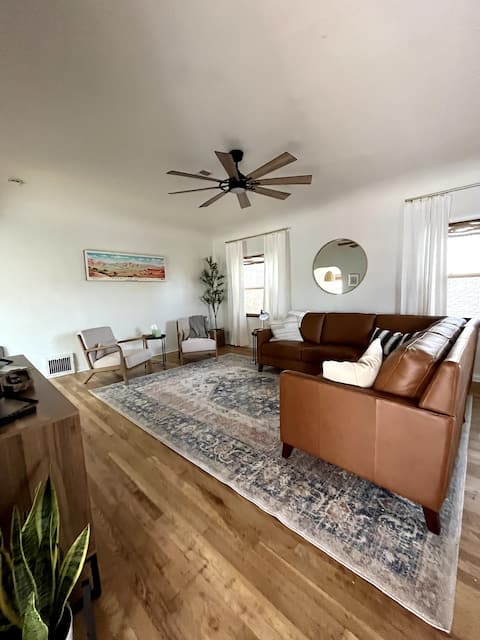
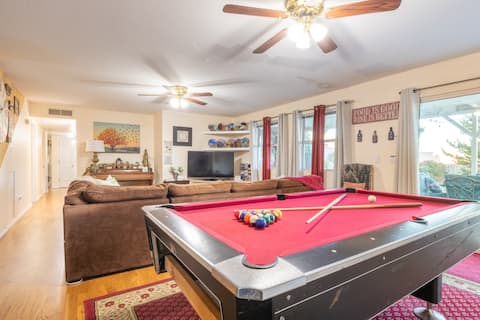
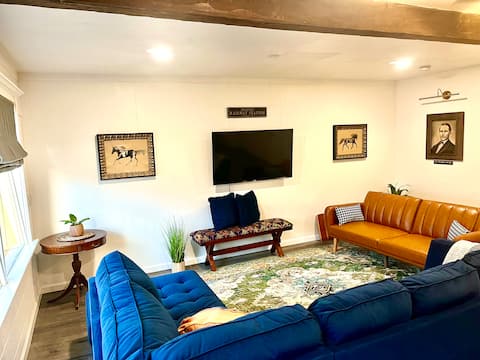
Top Performing Airbnb Properties in Holbrook (2026)
Benchmark your potential! Explore examples of top-performing Airbnb properties in Holbrookbased on Trailing Twelve Month (TTM) revenue. Analyze their characteristics, revenue, occupancy rate, and ADR to understand what drives success in this market.
Route 66 Retreat w/Tesla Charger
Entire Place • 3 bedrooms
• Holbrook Hub •
Entire Place • 4 bedrooms

Route 66 Bungalow
Entire Place • 2 bedrooms
High Desert Cottage
Entire Place • 2 bedrooms
The Birds Nest on Route 66
Entire Place • 3 bedrooms
Railway Stop - Stay in a piece of History
Entire Place • 2 bedrooms
Note: Performance varies based on location, size, amenities, seasonality, and management quality. Data reflects the past 12 months.
Top Performing Airbnb Hosts in Holbrook (2026)
Learn from the best! This table showcases top-performing Airbnb hosts in Holbrook based on the number of properties managed and estimated total revenue over the past year. Analyze their scale and performance metrics.
| Host Name | Properties | Grossing Revenue | Stay Reviews | Avg Rating |
|---|---|---|---|---|
| Meghan | 2 | $53,901 | 1258 | 4.90/5.0 |
| Tom | 1 | $43,474 | 134 | 4.99/5.0 |
| Judy | 2 | $37,927 | 1605 | 4.88/5.0 |
| Debbie | 1 | $32,954 | 218 | 4.90/5.0 |
| Karina | 4 | $26,924 | 1035 | 4.72/5.0 |
| Cynthia | 1 | $25,772 | 859 | 4.95/5.0 |
| Kellie | 1 | $22,293 | 472 | 4.85/5.0 |
| Ashley | 1 | $18,970 | 220 | 4.96/5.0 |
| Scott | 1 | $17,638 | 234 | 4.96/5.0 |
| Lara | 4 | $15,735 | 192 | 4.92/5.0 |
Analyzing the strategies of top hosts, such as their property selection, pricing, and guest communication, can offer valuable lessons for optimizing your own Airbnb operations in Holbrook.
Dive Deeper: Advanced Holbrook STR Market Data (2026)
Ready to unlock more insights? AirROI provides access to advanced metrics and comprehensive Airbnb data for Holbrook. Explore detailed analytics beyond this report to refine your investment strategy, optimize pricing, and maximize your vacation rental profits.
Explore Advanced MetricsHolbrook Short-Term Rental Market Composition (2026): Property & Room Types
Room Type Distribution
Property Type Distribution
Market Composition Insights for Holbrook
- The Holbrook Airbnb market composition is heavily skewed towards Entire Home/Apt listings, which make up 96.3% of the 27 active rentals. This indicates strong guest preference for privacy and space.
- Looking at the property type distribution in Holbrook, Outdoor/Unique properties are the most common (40.7%), reflecting the local real estate landscape.
- Houses represent a significant 29.6% portion, catering likely to families or larger groups.
- Smaller segments like hotel/boutique (combined 3.7%) offer potential for unique stay experiences.
Holbrook Airbnb Room Capacity Analysis (2026): Bedroom Distribution
Distribution of Listings by Number of Bedrooms
Room Capacity Insights for Holbrook
- The dominant room capacity in Holbrook is 1 bedroom listings, making up 44.4% of the market. This suggests a strong demand for properties suitable for couples or solo travelers.
- Together, 1 bedroom and 2 bedrooms properties represent 59.2% of the active Airbnb listings in Holbrook, indicating a high concentration in these sizes.
Holbrook Vacation Rental Guest Capacity Trends (2026)
Distribution of Listings by Guest Capacity
Guest Capacity Insights for Holbrook
- The most common guest capacity trend in Holbrook vacation rentals is listings accommodating 4 guests (37%). This suggests the primary traveler segment is likely small families or groups.
- Properties designed for 4 guests and 2 guests dominate the Holbrook STR market, accounting for 74.0% of listings.
- 22.2% of properties accommodate 6+ guests, serving the market segment for larger families or group travel in Holbrook.
- On average, properties in Holbrook are equipped to host 3.9 guests.
Holbrook Airbnb Booking Patterns (2026): Available vs. Booked Days
Available Days Distribution
Booked Days Distribution
Booking Pattern Insights for Holbrook
- The most common availability pattern in Holbrook falls within the 271-366 days range, representing 44.4% of listings. This suggests many properties have significant open periods on their calendars.
- Approximately 66.6% of listings show high availability (181+ days open annually), indicating potential for increased bookings or specific owner usage patterns.
- For booked days, the 1-30 days range is most frequent in Holbrook (29.6%), reflecting common guest stay durations or potential owner blocking patterns.
- A notable 33.3% of properties secure long booking periods (181+ days booked per year), highlighting successful long-term rental strategies or significant owner usage.
Holbrook Airbnb Minimum Stay Requirements Analysis
Distribution of Listings by Minimum Night Requirement
1 Night
27 listings
100% of total
Key Insights
- The most prevalent minimum stay requirement in Holbrook is 1 Night, adopted by 100% of listings. This highlights the market's preference for shorter, flexible bookings.
- A strong majority (100.0%) of the Holbrook Airbnb data shows acceptance of very short stays (1-2 nights), indicating a dynamic, high-turnover market.
Recommendations
- Align with the market by considering a 1 Night minimum stay, as 100% of Holbrook hosts use this setting.
- Adjust minimum nights based on seasonality – potentially shorter during low season and longer during peak demand periods in Holbrook.
Holbrook Airbnb Cancellation Policy Trends Analysis (2026)
Flexible
13 listings
48.1% of total
Moderate
11 listings
40.7% of total
Firm
3 listings
11.1% of total
Cancellation Policy Insights for Holbrook
- The prevailing Airbnb cancellation policy trend in Holbrook is Flexible, used by 48.1% of listings.
- The market strongly favors guest-friendly terms, with 88.8% of listings offering Flexible or Moderate policies. This suggests guests in Holbrook may expect booking flexibility.
Recommendations for Hosts
- Consider adopting a Flexible policy to align with the 48.1% market standard in Holbrook.
- Regularly review your cancellation policy against competitors and market demand shifts in Holbrook.
Holbrook STR Booking Lead Time Analysis (2026)
Average Booking Lead Time by Month
Booking Lead Time Insights for Holbrook
- The overall average booking lead time for vacation rentals in Holbrook is 34 days.
- Guests book furthest in advance for stays during April (average 54 days), likely coinciding with peak travel demand or local events.
- The shortest booking windows occur for stays in January (average 24 days), indicating more last-minute travel plans during this time.
- Seasonally, Spring (40 days avg.) sees the longest lead times, while Winter (30 days avg.) has the shortest, reflecting typical travel planning cycles.
Recommendations for Hosts
- Use the overall average lead time (34 days) as a baseline for your pricing and availability strategy in Holbrook.
- For April stays, consider implementing length-of-stay discounts or slightly higher rates for bookings made less than 54 days out to capitalize on advance planning.
- Target marketing efforts for the Spring season well in advance (at least 40 days) to capture early planners.
- Monitor your own booking lead times against these Holbrook averages to identify opportunities for dynamic pricing adjustments.
Popular & Essential Airbnb Amenities in Holbrook (2026)
Amenity Prevalence
Amenity Insights for Holbrook
- Essential amenities in Holbrook that guests expect include: Free parking on premises. Lacking these (this) could significantly impact bookings.
- Popular amenities like Carbon monoxide alarm, Heating, Dining table are common but not universal. Offering these can provide a competitive edge.
Recommendations for Hosts
- Ensure your listing includes all essential amenities for Holbrook: Free parking on premises.
- Prioritize adding missing essentials: Free parking on premises.
- Consider adding popular differentiators like Carbon monoxide alarm or Heating to increase appeal.
- Highlight unique or less common amenities you offer (e.g., hot tub, dedicated workspace, EV charger) in your listing description and photos.
- Regularly check competitor amenities in Holbrook to stay competitive.
Holbrook Airbnb Guest Demographics & Profile Analysis (2026)
Guest Profile Summary for Holbrook
- The typical guest profile for Airbnb in Holbrook consists of primarily domestic travelers (95%), often arriving from nearby Phoenix, typically belonging to the Post-2000s (Gen Z/Alpha) group (50%), primarily speaking English or Spanish.
- Domestic travelers account for 94.5% of guests.
- Key international markets include United States (94.5%) and United Kingdom (1.2%).
- Top languages spoken are English (69.9%) followed by Spanish (10.4%).
- A significant demographic segment is the Post-2000s (Gen Z/Alpha) group, representing 50% of guests.
Recommendations for Hosts
- Target domestic marketing efforts towards travelers from Phoenix and Los Angeles.
- Tailor amenities and listing descriptions to appeal to the dominant Post-2000s (Gen Z/Alpha) demographic (e.g., highlight fast WiFi, smart home features, local guides).
- Highlight unique local experiences or amenities relevant to the primary guest profile.
- Consider seasonal promotions aligned with peak travel times for key origin markets.
Nearby Short-Term Rental Market Comparison
How does the Holbrook Airbnb market stack up against its neighbors? Compare key performance metrics like average monthly revenue, ADR, and occupancy rates in surrounding areas to understand the broader regional STR landscape.
| Market | Active Properties | Monthly Revenue | Daily Rate | Avg. Occupancy |
|---|---|---|---|---|
| Paradise Valley | 67 | $10,566 | $1242.99 | 41% |
| Sedona | 1,658 | $5,761 | $410.99 | 50% |
| Sedona City Limit | 372 | $4,884 | $333.39 | 51% |
| Fort Valley | 38 | $4,747 | $408.22 | 43% |
| Scottsdale | 4,331 | $4,202 | $370.53 | 47% |
| Doney Park | 17 | $4,085 | $299.83 | 54% |
| Carefree | 31 | $4,052 | $522.63 | 39% |
| Cave Creek | 132 | $4,016 | $399.83 | 42% |
| Kachina Village | 138 | $3,786 | $252.87 | 50% |
| Big Park | 427 | $3,618 | $294.75 | 47% |