Greer Airbnb Market Analysis 2026: Short Term Rental Data & Vacation Rental Statistics in Arizona, United States
Is Airbnb profitable in Greer in 2026? Explore comprehensive Airbnb analytics for Greer, Arizona, United States to uncover income potential. This 2026 STR market report for Greer, based on AirROI data from February 2025 to January 2026, reveals key trends in the niche market of 119 active listings.
Whether you're considering an Airbnb investment in Greer, optimizing your existing vacation rental, or exploring rental arbitrage opportunities, understanding the Greer Airbnb data is crucial. Leveraging the low regulation environment is key to maximizing your short term rental income potential. Let's dive into the specifics.
Key Greer Airbnb Performance Metrics Overview
Monthly Airbnb Revenue Variations & Income Potential in Greer (2026)
Understanding the monthly revenue variations for Airbnb listings in Greer is key to maximizing your short term rental income potential. Seasonality significantly impacts earnings. Our analysis, based on data from the past 12 months, shows that the peak revenue month for STRs in Greer is typically July, while April often presents the lowest earnings, highlighting opportunities for strategic pricing adjustments during shoulder and low seasons. Explore the typical Airbnb income in Greer across different performance tiers:
- Best-in-class properties (Top 10%) achieve $4,550+ monthly, often utilizing dynamic pricing and superior guest experiences.
- Strong performing properties (Top 25%) earn $3,299 or more, indicating effective management and desirable locations/amenities.
- Typical properties (Median) generate around $2,100 per month, representing the average market performance.
- Entry-level properties (Bottom 25%) see earnings around $1,242, often with potential for optimization.
Average Monthly Airbnb Earnings Trend in Greer
Greer Airbnb Occupancy Rate Trends (2026)
Maximize your bookings by understanding the Greer STR occupancy trends. Seasonal demand shifts significantly influence how often properties are booked. Typically, Julysees the highest demand (peak season occupancy), while April experiences the lowest (low season). Effective strategies, like adjusting minimum stays or offering promotions, can boost occupancy during slower periods. Here's how different property tiers perform in Greer:
- Best-in-class properties (Top 10%) achieve 58%+ occupancy, indicating high desirability and potentially optimized availability.
- Strong performing properties (Top 25%) maintain 46% or higher occupancy, suggesting good market fit and guest satisfaction.
- Typical properties (Median) have an occupancy rate around 31%.
- Entry-level properties (Bottom 25%) average 18% occupancy, potentially facing higher vacancy.
Average Monthly Occupancy Rate Trend in Greer
Average Daily Rate (ADR) Airbnb Trends in Greer (2026)
Effective short term rental pricing strategy in Greer involves understanding monthly ADR fluctuations. The Average Daily Rate (ADR) for Airbnb in Greer typically peaks in December and dips lowest during March. Leveraging Airbnb dynamic pricing tools or strategies based on this seasonality can significantly boost revenue. Here's a look at the typical nightly rates achieved:
- Best-in-class properties (Top 10%) command rates of $423+ per night, often due to premium features or locations.
- Strong performing properties (Top 25%) achieve nightly rates of $313 or more.
- Typical properties (Median) charge around $230 per night.
- Entry-level properties (Bottom 25%) earn around $170 per night.
Average Daily Rate (ADR) Trend by Month in Greer
Get Live Greer Market Intelligence 👇

Explore Real-time Analytics
Airbnb Seasonality Analysis & Trends in Greer (2026)
Peak Season (July, August, June)
- Revenue averages $3,720 per month
- Occupancy rates average 49.5%
- Daily rates average $272
Shoulder Season
- Revenue averages $2,341 per month
- Occupancy maintains around 29.7%
- Daily rates hold near $276
Low Season (February, March, April)
- Revenue drops to average $1,572 per month
- Occupancy decreases to average 23.5%
- Daily rates adjust to average $231
Seasonality Insights for Greer
- The Airbnb seasonality in Greer shows highly seasonal trends requiring careful strategy. While the sections above show seasonal averages, it's also insightful to look at the extremes:
- During the high season, the absolute peak month showcases Greer's highest earning potential, with monthly revenues capable of climbing to $4,394, occupancy reaching a high of 56.9%, and ADRs peaking at $294.
- Conversely, the slowest single month of the year, typically falling within the low season, marks the market's lowest point. In this month, revenue might dip to $1,418, occupancy could drop to 22.2%, and ADRs may adjust down to $229.
- Understanding both the seasonal averages and these monthly peaks and troughs in revenue, occupancy, and ADR is crucial for maximizing your Airbnb profit potential in Greer.
Seasonal Strategies for Maximizing Profit
- Peak Season: Maximize revenue through premium pricing and potentially longer minimum stays. Ensure high availability.
- Low Season: Offer competitive pricing, special promotions (e.g., extended stay discounts), and flexible cancellation policies. Target off-season travelers like remote workers or budget-conscious guests.
- Shoulder Seasons: Implement dynamic pricing that balances peak and low rates. Target weekend travelers or specific events. Offer slightly more flexible terms than peak season.
- Regularly analyze your own performance against these Greer seasonality benchmarks and adjust your pricing and availability strategy accordingly.
Best Areas for Airbnb Investment in Greer (2026)
Exploring the top neighborhoods for short-term rentals in Greer? This section highlights key areas, outlining why they are attractive for hosts and guests, along with notable local attractions. Consider these locations based on your target guest profile and investment strategy.
| Neighborhood / Area | Why Host Here? (Target Guests & Appeal) | Key Attractions & Landmarks |
|---|---|---|
| Downtown Greer | Charming small-town atmosphere with local shops and restaurants. Close to outdoor activities and perfect for travelers looking for a peaceful retreat with city conveniences. | Greer Historical Museum, Greer Lake, local craft shops, community events, nature parks |
| Greer Lakes | Scenic area focused on outdoor recreation, particularly fishing and hiking. Ideal for guests wanting to escape the hustle and bustle and immerse in nature. | Fool Hollow Lake, Rainbow Lake, hiking trails, fishing spots, picnic areas |
| White Mountain Apache Reservation | Cultural experiences and stunning natural beauty. Attracts visitors interested in Native American culture and outdoor activities. | Canyon Lake, Cibecue Falls, apache cultural events, nature trails, bird watching |
| Pinetop-Lakeside | Neighboring town with a rustic charm and cooler temperatures. Popular for those seeking a mountain getaway with access to skiing in the winter. | Lakeside Park, Woods Canyon Lake, ski resorts, shopping and dining, outdoor festivals |
| Show Low | A larger neighboring city with more amenities. Attractive for guests looking for a blend of outdoor activities and urban convenience. | Show Low City Park, local dining options, golf courses, fishing spots, shopping outlets |
| Heber-Overgaard | A quiet mountain community known for its lush forests and lakes. Perfect for guests looking for a relaxing and serene retreat. | Heber Wild Horse Complex, Overgaard community events, nature trails, lakes for fishing, cabin rentals |
| Lakeside | A beautiful lakeside community offering various outdoor recreational activities and summer events, popular among families and groups. | Lakeside Park, fishing and boating, summer arts festivals, local market, community gatherings |
| Happy Jack | A serene area known for its stunning landscapes, hiking trails, and wildlife. Ideal for guests wanting a peaceful, nature-based experience. | Coconino National Forest, hiking trails, camping sites, wildlife viewing, scenic drives |
Understanding Airbnb License Requirements & STR Laws in Greer (2026)
While Greer, Arizona, United States currently shows low STR regulations, specific Airbnb license requirements might still exist or change. Always verify the latest short term rental regulations and Airbnb license requirements directly with local government authorities for Greer to ensure full compliance before hosting.
(Source: AirROI data, 2026, finding no licensed listings among those analyzed)
Top Performing Airbnb Properties in Greer (2026)
Benchmark your potential! Explore examples of top-performing Airbnb properties in Greerbased on Trailing Twelve Month (TTM) revenue. Analyze their characteristics, revenue, occupancy rate, and ADR to understand what drives success in this market.
HoKiTa Mountain Lodge GREER AZ
Entire Place • 5 bedrooms

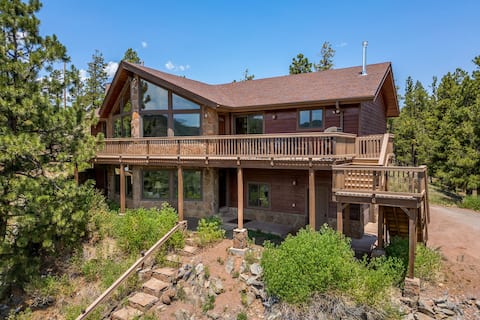
Beautiful Mountain Lodge (7,000 Sq. Ft) W/ Pond
Entire Place • 5 bedrooms
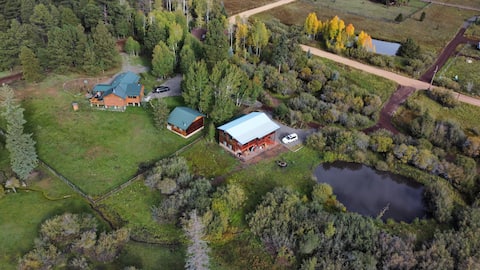
3 Cabins, Sleeps 20, Private Pond, 2 Acres
Entire Place • 7 bedrooms

Greer Ranch Retreat
Entire Place • 3 bedrooms

Riverfront Retreat (Cabin 100)
Entire Place • 2 bedrooms
Antler Ridge Ridgehouse
Entire Place • 5 bedrooms
Note: Performance varies based on location, size, amenities, seasonality, and management quality. Data reflects the past 12 months.
Top Performing Airbnb Hosts in Greer (2026)
Learn from the best! This table showcases top-performing Airbnb hosts in Greer based on the number of properties managed and estimated total revenue over the past year. Analyze their scale and performance metrics.
| Host Name | Properties | Grossing Revenue | Stay Reviews | Avg Rating |
|---|---|---|---|---|
| Tami | 39 | $1,124,397 | 1008 | 4.78/5.0 |
| Cabin | 35 | $439,905 | 322 | 4.58/5.0 |
| Kristi | 7 | $255,698 | 185 | 4.98/5.0 |
| Jimmy& Alicia | 9 | $195,363 | 1298 | 4.92/5.0 |
| Jon | 3 | $137,147 | 130 | 4.98/5.0 |
| Anna | 8 | $121,641 | 826 | 4.90/5.0 |
| Evolve | 4 | $97,479 | 139 | 4.62/5.0 |
| Chris | 2 | $66,849 | 230 | 4.91/5.0 |
| Dawson | 1 | $62,869 | 12 | 4.92/5.0 |
| Ben | 1 | $45,964 | 64 | 4.91/5.0 |
Analyzing the strategies of top hosts, such as their property selection, pricing, and guest communication, can offer valuable lessons for optimizing your own Airbnb operations in Greer.
Dive Deeper: Advanced Greer STR Market Data (2026)
Ready to unlock more insights? AirROI provides access to advanced metrics and comprehensive Airbnb data for Greer. Explore detailed analytics beyond this report to refine your investment strategy, optimize pricing, and maximize your vacation rental profits.
Explore Advanced MetricsGreer Short-Term Rental Market Composition (2026): Property & Room Types
Room Type Distribution
Property Type Distribution
Market Composition Insights for Greer
- The Greer Airbnb market composition is heavily skewed towards Entire Home/Apt listings, which make up 94.1% of the 119 active rentals. This indicates strong guest preference for privacy and space.
- Looking at the property type distribution in Greer, Outdoor/Unique properties are the most common (88.2%), reflecting the local real estate landscape.
- Smaller segments like apartment/condo (combined 0.8%) offer potential for unique stay experiences.
Greer Airbnb Room Capacity Analysis (2026): Bedroom Distribution
Distribution of Listings by Number of Bedrooms
Room Capacity Insights for Greer
- The dominant room capacity in Greer is 2 bedrooms listings, making up 47.1% of the market. This suggests a strong demand for properties suitable for couples or solo travelers.
- Together, 2 bedrooms and 3 bedrooms properties represent 71.5% of the active Airbnb listings in Greer, indicating a high concentration in these sizes.
- A significant 40.4% of listings offer 3+ bedrooms, catering to larger groups and families seeking more space in Greer.
Greer Vacation Rental Guest Capacity Trends (2026)
Distribution of Listings by Guest Capacity
Guest Capacity Insights for Greer
- The most common guest capacity trend in Greer vacation rentals is listings accommodating 8+ guests (44.5%). This suggests the primary traveler segment is likely larger groups.
- Properties designed for 8+ guests and 6 guests dominate the Greer STR market, accounting for 70.6% of listings.
- 73.1% of properties accommodate 6+ guests, serving the market segment for larger families or group travel in Greer.
- On average, properties in Greer are equipped to host 6.3 guests.
Greer Airbnb Booking Patterns (2026): Available vs. Booked Days
Available Days Distribution
Booked Days Distribution
Booking Pattern Insights for Greer
- The most common availability pattern in Greer falls within the 271-366 days range, representing 52.1% of listings. This suggests many properties have significant open periods on their calendars.
- Approximately 91.6% of listings show high availability (181+ days open annually), indicating potential for increased bookings or specific owner usage patterns.
- For booked days, the 91-180 days range is most frequent in Greer (42.9%), reflecting common guest stay durations or potential owner blocking patterns.
- A notable 9.2% of properties secure long booking periods (181+ days booked per year), highlighting successful long-term rental strategies or significant owner usage.
Greer Airbnb Minimum Stay Requirements Analysis
Distribution of Listings by Minimum Night Requirement
1 Night
2 listings
1.7% of total
2 Nights
66 listings
55.5% of total
3 Nights
3 listings
2.5% of total
30+ Nights
48 listings
40.3% of total
Key Insights
- The most prevalent minimum stay requirement in Greer is 2 Nights, adopted by 55.5% of listings. This highlights the market's preference for shorter, flexible bookings.
- A significant segment (40.3%) caters to monthly stays (30+ nights) in Greer, pointing to opportunities in the extended-stay market.
Recommendations
- Align with the market by considering a 2 Nights minimum stay, as 55.5% of Greer hosts use this setting.
- If feasible, allowing 1-night stays, especially midweek or during low season, could capture last-minute bookings, as only 1.7% currently do.
- A 2-night minimum appears standard (55.5%). Consider this for weekends or peak periods.
- Explore offering discounts for stays of 30+ nights to attract the 40.3% of the market seeking extended stays.
- Adjust minimum nights based on seasonality – potentially shorter during low season and longer during peak demand periods in Greer.
Greer Airbnb Cancellation Policy Trends Analysis (2026)
Limited
5 listings
4.2% of total
Super Strict 30 Days
1 listings
0.8% of total
Flexible
5 listings
4.2% of total
Moderate
8 listings
6.7% of total
Firm
78 listings
65.5% of total
Strict
22 listings
18.5% of total
Cancellation Policy Insights for Greer
- The prevailing Airbnb cancellation policy trend in Greer is Firm, used by 65.5% of listings.
- A majority (84.0%) of hosts in Greer utilize Firm or Strict policies, indicating a market where hosts prioritize booking security.
Recommendations for Hosts
- Consider adopting a Firm policy to align with the 65.5% market standard in Greer.
- Regularly review your cancellation policy against competitors and market demand shifts in Greer.
Greer STR Booking Lead Time Analysis (2026)
Average Booking Lead Time by Month
Booking Lead Time Insights for Greer
- The overall average booking lead time for vacation rentals in Greer is 67 days.
- Guests book furthest in advance for stays during June (average 104 days), likely coinciding with peak travel demand or local events.
- The shortest booking windows occur for stays in March (average 26 days), indicating more last-minute travel plans during this time.
- Seasonally, Summer (95 days avg.) sees the longest lead times, while Spring (43 days avg.) has the shortest, reflecting typical travel planning cycles.
Recommendations for Hosts
- Use the overall average lead time (67 days) as a baseline for your pricing and availability strategy in Greer.
- For June stays, consider implementing length-of-stay discounts or slightly higher rates for bookings made less than 104 days out to capitalize on advance planning.
- Target marketing efforts for the Summer season well in advance (at least 95 days) to capture early planners.
- Monitor your own booking lead times against these Greer averages to identify opportunities for dynamic pricing adjustments.
Popular & Essential Airbnb Amenities in Greer (2026)
Amenity Prevalence
Amenity Insights for Greer
- Essential amenities in Greer that guests expect include: Kitchen, TV. Lacking these (any) could significantly impact bookings.
- Popular amenities like Refrigerator, Wifi, Coffee maker are common but not universal. Offering these can provide a competitive edge.
- Warning: Wifi is not universally provided but is considered essential globally. Ensure reliable Wifi is offered.
Recommendations for Hosts
- Ensure your listing includes all essential amenities for Greer: Kitchen, TV.
- Prioritize adding missing essentials: Kitchen, TV.
- Consider adding popular differentiators like Refrigerator or Wifi to increase appeal.
- Highlight unique or less common amenities you offer (e.g., hot tub, dedicated workspace, EV charger) in your listing description and photos.
- Regularly check competitor amenities in Greer to stay competitive.
Greer Airbnb Guest Demographics & Profile Analysis (2026)
Guest Profile Summary for Greer
- The typical guest profile for Airbnb in Greer consists of primarily domestic travelers (98%), often arriving from nearby Phoenix, typically belonging to the Post-2000s (Gen Z/Alpha) group (50%), primarily speaking English or Spanish.
- Domestic travelers account for 98.0% of guests.
- Key international markets include United States (98%) and Mexico (1.2%).
- Top languages spoken are English (69.9%) followed by Spanish (16.8%).
- A significant demographic segment is the Post-2000s (Gen Z/Alpha) group, representing 50% of guests.
Recommendations for Hosts
- Target domestic marketing efforts towards travelers from Phoenix and Tucson.
- Tailor amenities and listing descriptions to appeal to the dominant Post-2000s (Gen Z/Alpha) demographic (e.g., highlight fast WiFi, smart home features, local guides).
- Highlight unique local experiences or amenities relevant to the primary guest profile.
- Consider seasonal promotions aligned with peak travel times for key origin markets.
Nearby Short-Term Rental Market Comparison
How does the Greer Airbnb market stack up against its neighbors? Compare key performance metrics like average monthly revenue, ADR, and occupancy rates in surrounding areas to understand the broader regional STR landscape.
| Market | Active Properties | Monthly Revenue | Daily Rate | Avg. Occupancy |
|---|---|---|---|---|
| Coconino County | 27 | $2,634 | $269.48 | 33% |
| Show Low | 320 | $2,237 | $265.05 | 34% |
| Lake of the Woods | 101 | $2,214 | $195.22 | 43% |
| Pinetop-Lakeside | 298 | $2,064 | $250.23 | 31% |
| Heber-Overgaard | 96 | $1,904 | $205.77 | 36% |
| Pinetop Country Club | 184 | $1,899 | $244.69 | 32% |
| Wagon Wheel | 23 | $1,804 | $221.29 | 35% |
| Navajo County | 161 | $1,700 | $226.92 | 31% |
| Alpine | 27 | $1,626 | $197.65 | 36% |
| Young | 15 | $1,545 | $247.77 | 32% |