Greenehaven Airbnb Market Analysis 2026: Short Term Rental Data & Vacation Rental Statistics in Arizona, United States
Is Airbnb profitable in Greenehaven in 2026? Explore comprehensive Airbnb analytics for Greenehaven, Arizona, United States to uncover income potential. This 2026 STR market report for Greenehaven, based on AirROI data from February 2025 to January 2026, reveals key trends in the niche market of 48 active listings.
Whether you're considering an Airbnb investment in Greenehaven, optimizing your existing vacation rental, or exploring rental arbitrage opportunities, understanding the Greenehaven Airbnb data is crucial. Leveraging the low regulation environment is key to maximizing your short term rental income potential. Let's dive into the specifics.
Key Greenehaven Airbnb Performance Metrics Overview
Monthly Airbnb Revenue Variations & Income Potential in Greenehaven (2026)
Understanding the monthly revenue variations for Airbnb listings in Greenehaven is key to maximizing your short term rental income potential. Seasonality significantly impacts earnings. Our analysis, based on data from the past 12 months, shows that the peak revenue month for STRs in Greenehaven is typically July, while February often presents the lowest earnings, highlighting opportunities for strategic pricing adjustments during shoulder and low seasons. Explore the typical Airbnb income in Greenehaven across different performance tiers:
- Best-in-class properties (Top 10%) achieve $8,683+ monthly, often utilizing dynamic pricing and superior guest experiences.
- Strong performing properties (Top 25%) earn $6,050 or more, indicating effective management and desirable locations/amenities.
- Typical properties (Median) generate around $3,924 per month, representing the average market performance.
- Entry-level properties (Bottom 25%) see earnings around $2,126, often with potential for optimization.
Average Monthly Airbnb Earnings Trend in Greenehaven
Greenehaven Airbnb Occupancy Rate Trends (2026)
Maximize your bookings by understanding the Greenehaven STR occupancy trends. Seasonal demand shifts significantly influence how often properties are booked. Typically, Julysees the highest demand (peak season occupancy), while December experiences the lowest (low season). Effective strategies, like adjusting minimum stays or offering promotions, can boost occupancy during slower periods. Here's how different property tiers perform in Greenehaven:
- Best-in-class properties (Top 10%) achieve 76%+ occupancy, indicating high desirability and potentially optimized availability.
- Strong performing properties (Top 25%) maintain 64% or higher occupancy, suggesting good market fit and guest satisfaction.
- Typical properties (Median) have an occupancy rate around 45%.
- Entry-level properties (Bottom 25%) average 26% occupancy, potentially facing higher vacancy.
Average Monthly Occupancy Rate Trend in Greenehaven
Average Daily Rate (ADR) Airbnb Trends in Greenehaven (2026)
Effective short term rental pricing strategy in Greenehaven involves understanding monthly ADR fluctuations. The Average Daily Rate (ADR) for Airbnb in Greenehaven typically peaks in June and dips lowest during February. Leveraging Airbnb dynamic pricing tools or strategies based on this seasonality can significantly boost revenue. Here's a look at the typical nightly rates achieved:
- Best-in-class properties (Top 10%) command rates of $570+ per night, often due to premium features or locations.
- Strong performing properties (Top 25%) achieve nightly rates of $407 or more.
- Typical properties (Median) charge around $287 per night.
- Entry-level properties (Bottom 25%) earn around $221 per night.
Average Daily Rate (ADR) Trend by Month in Greenehaven
Get Live Greenehaven Market Intelligence 👇

Explore Real-time Analytics
Airbnb Seasonality Analysis & Trends in Greenehaven (2026)
Peak Season (July, June, May)
- Revenue averages $6,515 per month
- Occupancy rates average 57.5%
- Daily rates average $370
Shoulder Season
- Revenue averages $4,416 per month
- Occupancy maintains around 45.9%
- Daily rates hold near $329
Low Season (January, February, November)
- Revenue drops to average $2,738 per month
- Occupancy decreases to average 32.6%
- Daily rates adjust to average $298
Seasonality Insights for Greenehaven
- The Airbnb seasonality in Greenehaven shows highly seasonal trends requiring careful strategy. While the sections above show seasonal averages, it's also insightful to look at the extremes:
- During the high season, the absolute peak month showcases Greenehaven's highest earning potential, with monthly revenues capable of climbing to $7,146, occupancy reaching a high of 58.9%, and ADRs peaking at $385.
- Conversely, the slowest single month of the year, typically falling within the low season, marks the market's lowest point. In this month, revenue might dip to $2,179, occupancy could drop to 30.0%, and ADRs may adjust down to $257.
- Understanding both the seasonal averages and these monthly peaks and troughs in revenue, occupancy, and ADR is crucial for maximizing your Airbnb profit potential in Greenehaven.
Seasonal Strategies for Maximizing Profit
- Peak Season: Maximize revenue through premium pricing and potentially longer minimum stays. Ensure high availability.
- Low Season: Offer competitive pricing, special promotions (e.g., extended stay discounts), and flexible cancellation policies. Target off-season travelers like remote workers or budget-conscious guests.
- Shoulder Seasons: Implement dynamic pricing that balances peak and low rates. Target weekend travelers or specific events. Offer slightly more flexible terms than peak season.
- Regularly analyze your own performance against these Greenehaven seasonality benchmarks and adjust your pricing and availability strategy accordingly.
Best Areas for Airbnb Investment in Greenehaven (2026)
Exploring the top neighborhoods for short-term rentals in Greenehaven? This section highlights key areas, outlining why they are attractive for hosts and guests, along with notable local attractions. Consider these locations based on your target guest profile and investment strategy.
| Neighborhood / Area | Why Host Here? (Target Guests & Appeal) | Key Attractions & Landmarks |
|---|---|---|
| Hanging Gardens | A picturesque area with scenic views of the Colorado River and exceptional outdoor activities. Great for guests who love nature and scenic landscapes. | Lake Powell, Rainbow Bridge, Antelope Canyon, Horseshoe Bend, Glen Canyon Dam |
| Page | Known for its rich history and natural beauty, Page is a gateway to several breathtaking parks, making it ideal for adventure seekers. | Antelope Canyon, Lake Powell, Rainbow Bridge National Monument, Horseshoe Bend, Glen Canyon National Recreation Area |
| Marble Canyon | Iconic canyon views and a peaceful atmosphere perfect for outdoor enthusiasts and those looking to escape the hustle and bustle. | Marble Canyon, Lees Ferry, Colorado River Rafting, Fishing, Camping |
| Big Water | A charming small town that offers close access to multiple natural attractions and a relaxed pace of life. | Big Water Visitor Center, Paria River, Vermilion Cliffs National Monument, Hiking Trails, Photography Spots |
| Tansu | An unexplored gem that's beginning to gain attention due to its proximity to various national parks and natural wonders. | Tansu River, Canyon Hikes, Scenic Lookouts, Nature Photography |
| North Lake Powell | Stunning views and plenty of recreational activities in a less crowded area, great for families and nature lovers. | Fishing, Boating, Kayaking, Campsites, Wildlife Watching |
| Glen Canyon | Famous for its stunning landscapes and numerous outdoor activities available, making it attractive to tourists year-round. | Glen Canyon Dam, Lake Powell, Hiking Trails, Boating, Sightseeing Tours |
| Antelope Point | Offers amazing accessibility to Lake Powell and is a prime location for water sports and sightseeing. | Antelope Point Marina, Lake Powell Cruises, Water Sports, Scenic Views, Photography |
Understanding Airbnb License Requirements & STR Laws in Greenehaven (2026)
While Greenehaven, Arizona, United States currently shows low STR regulations, specific Airbnb license requirements might still exist or change. Always verify the latest short term rental regulations and Airbnb license requirements directly with local government authorities for Greenehaven to ensure full compliance before hosting.
(Source: AirROI data, 2026, finding no licensed listings among those analyzed)
Top Performing Airbnb Properties in Greenehaven (2026)
Benchmark your potential! Explore examples of top-performing Airbnb properties in Greenehavenbased on Trailing Twelve Month (TTM) revenue. Analyze their characteristics, revenue, occupancy rate, and ADR to understand what drives success in this market.
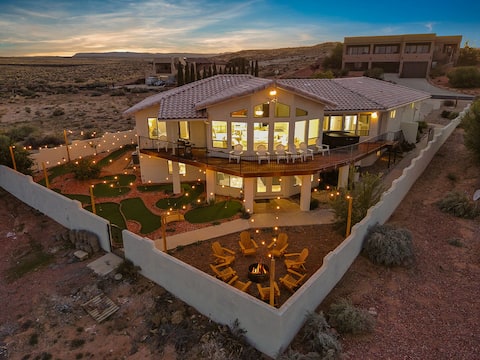
Red Desert Oasis: Modern + Spacious Home
Entire Place • 6 bedrooms
Surf Inn Lake Powell • Sleeps 16 • Hot Tub & Views
Entire Place • 4 bedrooms

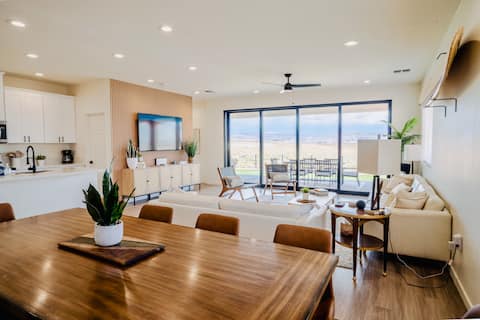
Pueblo en Powell • Hot Tub, Game Room, Lake Views
Entire Place • 4 bedrooms
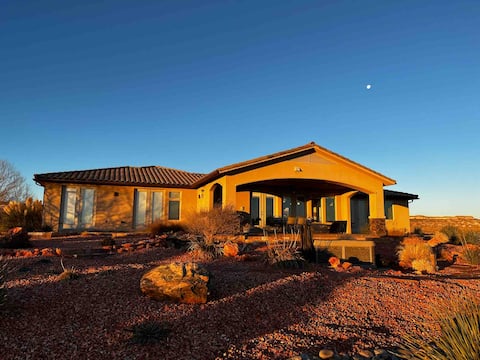
Desert Hacienda at Lake Powell, Hot tub, EV Charge
Entire Place • 4 bedrooms
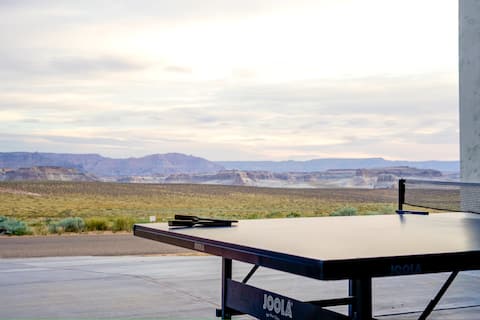
Powell Retreat 4BR w/HOT TUB, Views & GAME ROOM!
Entire Place • 4 bedrooms

Stargazer 4BR Desert Retreat | Hot Tub & Deck
Entire Place • 4 bedrooms
Note: Performance varies based on location, size, amenities, seasonality, and management quality. Data reflects the past 12 months.
Top Performing Airbnb Hosts in Greenehaven (2026)
Learn from the best! This table showcases top-performing Airbnb hosts in Greenehaven based on the number of properties managed and estimated total revenue over the past year. Analyze their scale and performance metrics.
| Host Name | Properties | Grossing Revenue | Stay Reviews | Avg Rating |
|---|---|---|---|---|
| Colten | 1 | $166,520 | 43 | 4.98/5.0 |
| Darin | 1 | $124,388 | 240 | 4.99/5.0 |
| Mary Sue | 2 | $105,781 | 206 | 4.95/5.0 |
| Ashley | 2 | $105,752 | 303 | 4.91/5.0 |
| Andrew | 1 | $99,291 | 126 | 4.90/5.0 |
| Richard | 1 | $85,788 | 61 | 5.00/5.0 |
| Louisa | 1 | $82,973 | 138 | 4.98/5.0 |
| Amy | 1 | $82,360 | 57 | 4.91/5.0 |
| Gena | 1 | $75,266 | 214 | 4.98/5.0 |
| Tanner And Sophia | 1 | $73,851 | 100 | 4.99/5.0 |
Analyzing the strategies of top hosts, such as their property selection, pricing, and guest communication, can offer valuable lessons for optimizing your own Airbnb operations in Greenehaven.
Dive Deeper: Advanced Greenehaven STR Market Data (2026)
Ready to unlock more insights? AirROI provides access to advanced metrics and comprehensive Airbnb data for Greenehaven. Explore detailed analytics beyond this report to refine your investment strategy, optimize pricing, and maximize your vacation rental profits.
Explore Advanced MetricsGreenehaven Short-Term Rental Market Composition (2026): Property & Room Types
Room Type Distribution
Property Type Distribution
Market Composition Insights for Greenehaven
- The Greenehaven Airbnb market composition is heavily skewed towards Entire Home/Apt listings, which make up 100% of the 48 active rentals. This indicates strong guest preference for privacy and space.
- Looking at the property type distribution in Greenehaven, House properties are the most common (97.9%), reflecting the local real estate landscape.
- Houses represent a significant 97.9% portion, catering likely to families or larger groups.
- Smaller segments like others (combined 2.1%) offer potential for unique stay experiences.
Greenehaven Airbnb Room Capacity Analysis (2026): Bedroom Distribution
Distribution of Listings by Number of Bedrooms
Room Capacity Insights for Greenehaven
- The dominant room capacity in Greenehaven is 4 bedrooms listings, making up 41.7% of the market. This suggests a strong demand for properties suitable for families or small groups.
- Together, 4 bedrooms and 3 bedrooms properties represent 64.6% of the active Airbnb listings in Greenehaven, indicating a high concentration in these sizes.
- A significant 72.9% of listings offer 3+ bedrooms, catering to larger groups and families seeking more space in Greenehaven.
Greenehaven Vacation Rental Guest Capacity Trends (2026)
Distribution of Listings by Guest Capacity
Guest Capacity Insights for Greenehaven
- The most common guest capacity trend in Greenehaven vacation rentals is listings accommodating 8+ guests (64.6%). This suggests the primary traveler segment is likely larger groups.
- Properties designed for 8+ guests and 6 guests dominate the Greenehaven STR market, accounting for 85.4% of listings.
- 89.6% of properties accommodate 6+ guests, serving the market segment for larger families or group travel in Greenehaven.
- On average, properties in Greenehaven are equipped to host 7.0 guests.
Greenehaven Airbnb Booking Patterns (2026): Available vs. Booked Days
Available Days Distribution
Booked Days Distribution
Booking Pattern Insights for Greenehaven
- The most common availability pattern in Greenehaven falls within the 181-270 days range, representing 41.7% of listings. This suggests many properties have significant open periods on their calendars.
- Approximately 70.9% of listings show high availability (181+ days open annually), indicating potential for increased bookings or specific owner usage patterns.
- For booked days, the 91-180 days range is most frequent in Greenehaven (41.7%), reflecting common guest stay durations or potential owner blocking patterns.
- A notable 29.2% of properties secure long booking periods (181+ days booked per year), highlighting successful long-term rental strategies or significant owner usage.
Greenehaven Airbnb Minimum Stay Requirements Analysis
Distribution of Listings by Minimum Night Requirement
1 Night
6 listings
12.5% of total
2 Nights
25 listings
52.1% of total
3 Nights
2 listings
4.2% of total
30+ Nights
15 listings
31.3% of total
Key Insights
- The most prevalent minimum stay requirement in Greenehaven is 2 Nights, adopted by 52.1% of listings. This highlights the market's preference for shorter, flexible bookings.
- A strong majority (64.6%) of the Greenehaven Airbnb data shows acceptance of very short stays (1-2 nights), indicating a dynamic, high-turnover market.
- A significant segment (31.3%) caters to monthly stays (30+ nights) in Greenehaven, pointing to opportunities in the extended-stay market.
Recommendations
- Align with the market by considering a 2 Nights minimum stay, as 52.1% of Greenehaven hosts use this setting.
- If feasible, allowing 1-night stays, especially midweek or during low season, could capture last-minute bookings, as only 12.5% currently do.
- A 2-night minimum appears standard (52.1%). Consider this for weekends or peak periods.
- Explore offering discounts for stays of 30+ nights to attract the 31.3% of the market seeking extended stays.
- Adjust minimum nights based on seasonality – potentially shorter during low season and longer during peak demand periods in Greenehaven.
Greenehaven Airbnb Cancellation Policy Trends Analysis (2026)
Super Strict 30 Days
2 listings
4.2% of total
Limited
1 listings
2.1% of total
Flexible
5 listings
10.4% of total
Moderate
11 listings
22.9% of total
Firm
24 listings
50% of total
Strict
5 listings
10.4% of total
Cancellation Policy Insights for Greenehaven
- The prevailing Airbnb cancellation policy trend in Greenehaven is Firm, used by 50% of listings.
- A majority (60.4%) of hosts in Greenehaven utilize Firm or Strict policies, indicating a market where hosts prioritize booking security.
Recommendations for Hosts
- Consider adopting a Firm policy to align with the 50% market standard in Greenehaven.
- Using a Strict policy might deter some guests, as only 10.4% of listings use it. Evaluate if potential revenue protection outweighs possible lower booking rates.
- Regularly review your cancellation policy against competitors and market demand shifts in Greenehaven.
Greenehaven STR Booking Lead Time Analysis (2026)
Average Booking Lead Time by Month
Booking Lead Time Insights for Greenehaven
- The overall average booking lead time for vacation rentals in Greenehaven is 60 days.
- Guests book furthest in advance for stays during July (average 83 days), likely coinciding with peak travel demand or local events.
- The shortest booking windows occur for stays in January (average 24 days), indicating more last-minute travel plans during this time.
- Seasonally, Summer (73 days avg.) sees the longest lead times, while Winter (34 days avg.) has the shortest, reflecting typical travel planning cycles.
Recommendations for Hosts
- Use the overall average lead time (60 days) as a baseline for your pricing and availability strategy in Greenehaven.
- For July stays, consider implementing length-of-stay discounts or slightly higher rates for bookings made less than 83 days out to capitalize on advance planning.
- Target marketing efforts for the Summer season well in advance (at least 73 days) to capture early planners.
- Monitor your own booking lead times against these Greenehaven averages to identify opportunities for dynamic pricing adjustments.
Popular & Essential Airbnb Amenities in Greenehaven (2026)
Amenity Prevalence
Amenity Insights for Greenehaven
- Essential amenities in Greenehaven that guests expect include: Wifi, Air conditioning, Smoke alarm, TV, Free parking on premises, Kitchen, Heating, Hot water. Lacking these (any) could significantly impact bookings.
- Popular amenities like Cooking basics, Coffee maker are common but not universal. Offering these can provide a competitive edge.
Recommendations for Hosts
- Ensure your listing includes all essential amenities for Greenehaven: Wifi, Air conditioning, Smoke alarm, TV, Free parking on premises, Kitchen, Heating, Hot water.
- Prioritize adding missing essentials: Free parking on premises, Kitchen, Heating, Hot water.
- Consider adding popular differentiators like Cooking basics or Coffee maker to increase appeal.
- Highlight unique or less common amenities you offer (e.g., hot tub, dedicated workspace, EV charger) in your listing description and photos.
- Regularly check competitor amenities in Greenehaven to stay competitive.
Greenehaven Airbnb Guest Demographics & Profile Analysis (2026)
Guest Profile Summary for Greenehaven
- The typical guest profile for Airbnb in Greenehaven consists of primarily domestic travelers (88%), often arriving from nearby Phoenix, typically belonging to the Post-2000s (Gen Z/Alpha) group (50%), primarily speaking English or Spanish.
- Domestic travelers account for 88.3% of guests.
- Key international markets include United States (88.3%) and Canada (1.6%).
- Top languages spoken are English (60.2%) followed by Spanish (10.9%).
- A significant demographic segment is the Post-2000s (Gen Z/Alpha) group, representing 50% of guests.
Recommendations for Hosts
- Target domestic marketing efforts towards travelers from Phoenix and New York.
- Tailor amenities and listing descriptions to appeal to the dominant Post-2000s (Gen Z/Alpha) demographic (e.g., highlight fast WiFi, smart home features, local guides).
- Highlight unique local experiences or amenities relevant to the primary guest profile.
- Consider seasonal promotions aligned with peak travel times for key origin markets.
Nearby Short-Term Rental Market Comparison
How does the Greenehaven Airbnb market stack up against its neighbors? Compare key performance metrics like average monthly revenue, ADR, and occupancy rates in surrounding areas to understand the broader regional STR landscape.
| Market | Active Properties | Monthly Revenue | Daily Rate | Avg. Occupancy |
|---|---|---|---|---|
| Springdale | 135 | $5,417 | $457.31 | 46% |
| Fort Valley | 38 | $4,747 | $408.22 | 43% |
| Doney Park | 17 | $4,085 | $299.83 | 54% |
| Red Lake | 12 | $3,899 | $257.65 | 54% |
| Kachina Village | 138 | $3,786 | $252.87 | 50% |
| Flagstaff | 1,391 | $3,353 | $281.58 | 47% |
| Timberline-Fernwood | 17 | $3,344 | $202.94 | 58% |
| Orderville | 256 | $3,275 | $321.28 | 38% |
| Alton | 45 | $3,237 | $279.82 | 45% |
| Williams City Limits | 152 | $3,017 | $222.76 | 45% |