Golden Shores Airbnb Market Analysis 2025: Short Term Rental Data & Vacation Rental Statistics in Arizona, United States
Is Airbnb profitable in Golden Shores in 2025? Explore comprehensive Airbnb analytics for Golden Shores, Arizona, United States to uncover income potential. This 2025 STR market report for Golden Shores, based on AirROI data from November 2024 to October 2025, reveals key trends in the niche market of 18 active listings.
Whether you're considering an Airbnb investment in Golden Shores, optimizing your existing vacation rental, or exploring rental arbitrage opportunities, understanding the Golden Shores Airbnb data is crucial. Leveraging the low regulation environment is key to maximizing your short term rental income potential. Let's dive into the specifics.
Key Golden Shores Airbnb Performance Metrics Overview
Monthly Airbnb Revenue Variations & Income Potential in Golden Shores (2025)
Understanding the monthly revenue variations for Airbnb listings in Golden Shores is key to maximizing your short term rental income potential. Seasonality significantly impacts earnings. Our analysis, based on data from the past 12 months, shows that the peak revenue month for STRs in Golden Shores is typically August, while December often presents the lowest earnings, highlighting opportunities for strategic pricing adjustments during shoulder and low seasons. Explore the typical Airbnb income in Golden Shores across different performance tiers:
- Best-in-class properties (Top 10%) achieve $2,663+ monthly, often utilizing dynamic pricing and superior guest experiences.
- Strong performing properties (Top 25%) earn $1,967 or more, indicating effective management and desirable locations/amenities.
- Typical properties (Median) generate around $1,276 per month, representing the average market performance.
- Entry-level properties (Bottom 25%) see earnings around $672, often with potential for optimization.
Average Monthly Airbnb Earnings Trend in Golden Shores
Golden Shores Airbnb Occupancy Rate Trends (2025)
Maximize your bookings by understanding the Golden Shores STR occupancy trends. Seasonal demand shifts significantly influence how often properties are booked. Typically, Februarysees the highest demand (peak season occupancy), while December experiences the lowest (low season). Effective strategies, like adjusting minimum stays or offering promotions, can boost occupancy during slower periods. Here's how different property tiers perform in Golden Shores:
- Best-in-class properties (Top 10%) achieve 57%+ occupancy, indicating high desirability and potentially optimized availability.
- Strong performing properties (Top 25%) maintain 42% or higher occupancy, suggesting good market fit and guest satisfaction.
- Typical properties (Median) have an occupancy rate around 25%.
- Entry-level properties (Bottom 25%) average 12% occupancy, potentially facing higher vacancy.
Average Monthly Occupancy Rate Trend in Golden Shores
Average Daily Rate (ADR) Airbnb Trends in Golden Shores (2025)
Effective short term rental pricing strategy in Golden Shores involves understanding monthly ADR fluctuations. The Average Daily Rate (ADR) for Airbnb in Golden Shores typically peaks in October and dips lowest during February. Leveraging Airbnb dynamic pricing tools or strategies based on this seasonality can significantly boost revenue. Here's a look at the typical nightly rates achieved:
- Best-in-class properties (Top 10%) command rates of $253+ per night, often due to premium features or locations.
- Strong performing properties (Top 25%) achieve nightly rates of $214 or more.
- Typical properties (Median) charge around $174 per night.
- Entry-level properties (Bottom 25%) earn around $125 per night.
Average Daily Rate (ADR) Trend by Month in Golden Shores
Get Live Golden Shores Market Intelligence 👇

Explore Real-time Analytics
Airbnb Seasonality Analysis & Trends in Golden Shores (2025)
Peak Season (August, September, March)
- Revenue averages $1,921 per month
- Occupancy rates average 30.9%
- Daily rates average $187
Shoulder Season
- Revenue averages $1,475 per month
- Occupancy maintains around 32.7%
- Daily rates hold near $177
Low Season (April, October, December)
- Revenue drops to average $995 per month
- Occupancy decreases to average 21.9%
- Daily rates adjust to average $180
Seasonality Insights for Golden Shores
- The Airbnb seasonality in Golden Shores shows highly seasonal trends requiring careful strategy. While the sections above show seasonal averages, it's also insightful to look at the extremes:
- During the high season, the absolute peak month showcases Golden Shores's highest earning potential, with monthly revenues capable of climbing to $2,179, occupancy reaching a high of 43.2%, and ADRs peaking at $200.
- Conversely, the slowest single month of the year, typically falling within the low season, marks the market's lowest point. In this month, revenue might dip to $756, occupancy could drop to 17.0%, and ADRs may adjust down to $165.
- Understanding both the seasonal averages and these monthly peaks and troughs in revenue, occupancy, and ADR is crucial for maximizing your Airbnb profit potential in Golden Shores.
Seasonal Strategies for Maximizing Profit
- Peak Season: Maximize revenue through premium pricing and potentially longer minimum stays. Ensure high availability.
- Low Season: Offer competitive pricing, special promotions (e.g., extended stay discounts), and flexible cancellation policies. Target off-season travelers like remote workers or budget-conscious guests.
- Shoulder Seasons: Implement dynamic pricing that balances peak and low rates. Target weekend travelers or specific events. Offer slightly more flexible terms than peak season.
- Regularly analyze your own performance against these Golden Shores seasonality benchmarks and adjust your pricing and availability strategy accordingly.
Best Areas for Airbnb Investment in Golden Shores (2025)
Exploring the top neighborhoods for short-term rentals in Golden Shores? This section highlights key areas, outlining why they are attractive for hosts and guests, along with notable local attractions. Consider these locations based on your target guest profile and investment strategy.
| Neighborhood / Area | Why Host Here? (Target Guests & Appeal) | Key Attractions & Landmarks |
|---|---|---|
| Golden Shores Beach | A scenic and tranquil beach front area perfect for relaxation, fishing, and enjoying nature. Ideal for families and couples seeking a peaceful getaway with direct access to the beach. | Golden Shores Beach, Colorado River, Lake Havasu City, Bill Williams River National Wildlife Refuge, Topock Marsh |
| Havasu National Wildlife Refuge | A stunning natural area that attracts nature enthusiasts and bird watchers. Perfect for outdoor adventures, including hiking and wildlife observation. | Havasu National Wildlife Refuge, Birdwatching opportunities, Scenic trails, Fishing spots |
| Topock | A quaint town near the Colorado River, great for boating, fishing, and hiking. Offers a unique desert landscape and small-town charm. | Topock Maze, Golden Shores Resort, Colorado River access, Wildlife viewing, Local dining options |
| Lake Havasu City | Famous for the London Bridge and a vibrant community with plenty of activities on the lake. Attracts tourists looking for water sports and nightlife. | London Bridge, Lake Havasu, Water sports activities, Havasu State Park, Local restaurants and bars |
| Bullhead City | Close to the Colorado River and known for its recreational opportunities, making it attractive for vacationers and those seeking river activities. | Colorado River, Laughlin Casino area, Desert River Kayak, Parks and recreation areas |
| Mohave Valley | A quiet area with scenic views and outdoor recreation, ideal for visitors looking for a peaceful retreat close to nature and the river. | River access, Parks, Natural beauty |
| Dolan Springs | Offers a unique desert experience and is the gateway for those exploring the Grand Canyon. Ideal for eco-tourism and adventure seekers. | Grand Canyon access, Local desert attractions, Off-roading opportunities |
| Parker Dam | Renowned for its beautiful dam and serene landscapes, perfect for those interested in water activities and scenic views. | Parker Dam, Lake Havasu access, Boating, Fishing, Desert views |
Understanding Airbnb License Requirements & STR Laws in Golden Shores (2025)
While Golden Shores, Arizona, United States currently shows low STR regulations, specific Airbnb license requirements might still exist or change. Always verify the latest short term rental regulations and Airbnb license requirements directly with local government authorities for Golden Shores to ensure full compliance before hosting.
(Source: AirROI data, 2025, finding no licensed listings among those analyzed)
Top Performing Airbnb Properties in Golden Shores (2025)
Benchmark your potential! Explore examples of top-performing Airbnb properties in Golden Shoresbased on Trailing Twelve Month (TTM) revenue. Analyze their characteristics, revenue, occupancy rate, and ADR to understand what drives success in this market.
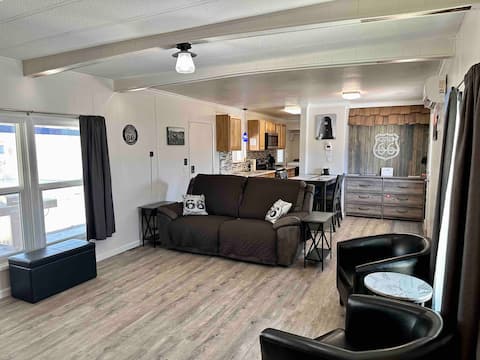
Route 66 Getaway/Boaters and Off-roaders Paradise
Entire Place • 2 bedrooms
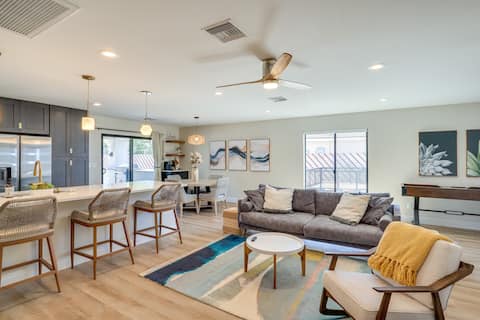
Family Fun - Beautiful Desert Escape!
Entire Place • 3 bedrooms

Twin Palms Hidaway
Entire Place • 2 bedrooms

Topock River and Desert Getaway!
Entire Place • 3 bedrooms

Your Desert Oasis in Topock, AZ
Entire Place • 3 bedrooms
Topock’s Premier Luxury Rental Home: 5 Mi to River
Entire Place • 3 bedrooms
Note: Performance varies based on location, size, amenities, seasonality, and management quality. Data reflects the past 12 months.
Top Performing Airbnb Hosts in Golden Shores (2025)
Learn from the best! This table showcases top-performing Airbnb hosts in Golden Shores based on the number of properties managed and estimated total revenue over the past year. Analyze their scale and performance metrics.
| Host Name | Properties | Grossing Revenue | Stay Reviews | Avg Rating |
|---|---|---|---|---|
| Shellie | 1 | $26,048 | 64 | 5.00/5.0 |
| Evolve | 2 | $24,484 | 18 | 4.88/5.0 |
| Taryn | 1 | $21,737 | 44 | 4.95/5.0 |
| Ismael | 1 | $20,123 | 26 | 4.73/5.0 |
| Molly | 3 | $20,101 | 148 | 4.75/5.0 |
| Kristy And Johnny | 1 | $19,299 | 46 | 4.78/5.0 |
| Tanner | 1 | $15,286 | 5 | 4.80/5.0 |
| Roberto | 1 | $14,199 | 45 | 4.87/5.0 |
| Kirsten | 1 | $12,742 | 19 | 5.00/5.0 |
| Troy | 1 | $12,023 | 76 | 4.89/5.0 |
Analyzing the strategies of top hosts, such as their property selection, pricing, and guest communication, can offer valuable lessons for optimizing your own Airbnb operations in Golden Shores.
Dive Deeper: Advanced Golden Shores STR Market Data (2025)
Ready to unlock more insights? AirROI provides access to advanced metrics and comprehensive Airbnb data for Golden Shores. Explore detailed analytics beyond this report to refine your investment strategy, optimize pricing, and maximize your vacation rental profits.
Explore Advanced MetricsGolden Shores Short-Term Rental Market Composition (2025): Property & Room Types
Room Type Distribution
Property Type Distribution
Market Composition Insights for Golden Shores
- The Golden Shores Airbnb market composition is heavily skewed towards Entire Home/Apt listings, which make up 100% of the 18 active rentals. This indicates strong guest preference for privacy and space.
- Looking at the property type distribution in Golden Shores, House properties are the most common (94.4%), reflecting the local real estate landscape.
- Houses represent a significant 94.4% portion, catering likely to families or larger groups.
Golden Shores Airbnb Room Capacity Analysis (2025): Bedroom Distribution
Distribution of Listings by Number of Bedrooms
Room Capacity Insights for Golden Shores
- The dominant room capacity in Golden Shores is 3 bedrooms listings, making up 38.9% of the market. This suggests a strong demand for properties suitable for families or small groups.
- Together, 3 bedrooms and 2 bedrooms properties represent 77.8% of the active Airbnb listings in Golden Shores, indicating a high concentration in these sizes.
- A significant 55.6% of listings offer 3+ bedrooms, catering to larger groups and families seeking more space in Golden Shores.
Golden Shores Vacation Rental Guest Capacity Trends (2025)
Distribution of Listings by Guest Capacity
Guest Capacity Insights for Golden Shores
- The most common guest capacity trend in Golden Shores vacation rentals is listings accommodating 8+ guests (38.9%). This suggests the primary traveler segment is likely larger groups.
- Properties designed for 8+ guests and 6 guests dominate the Golden Shores STR market, accounting for 77.8% of listings.
- 77.8% of properties accommodate 6+ guests, serving the market segment for larger families or group travel in Golden Shores.
- On average, properties in Golden Shores are equipped to host 6.3 guests.
Golden Shores Airbnb Booking Patterns (2025): Available vs. Booked Days
Available Days Distribution
Booked Days Distribution
Booking Pattern Insights for Golden Shores
- The most common availability pattern in Golden Shores falls within the 271-366 days range, representing 66.7% of listings. This suggests many properties have significant open periods on their calendars.
- Approximately 94.5% of listings show high availability (181+ days open annually), indicating potential for increased bookings or specific owner usage patterns.
- For booked days, the 31-90 days range is most frequent in Golden Shores (50%), reflecting common guest stay durations or potential owner blocking patterns.
- A notable 5.6% of properties secure long booking periods (181+ days booked per year), highlighting successful long-term rental strategies or significant owner usage.
Golden Shores Airbnb Minimum Stay Requirements Analysis
Distribution of Listings by Minimum Night Requirement
1 Night
7 listings
38.9% of total
2 Nights
8 listings
44.4% of total
3 Nights
2 listings
11.1% of total
30+ Nights
1 listings
5.6% of total
Key Insights
- The most prevalent minimum stay requirement in Golden Shores is 2 Nights, adopted by 44.4% of listings. This highlights the market's preference for shorter, flexible bookings.
- A strong majority (83.3%) of the Golden Shores Airbnb data shows acceptance of very short stays (1-2 nights), indicating a dynamic, high-turnover market.
Recommendations
- Align with the market by considering a 2 Nights minimum stay, as 44.4% of Golden Shores hosts use this setting.
- Explore offering discounts for stays of 30+ nights to attract the 5.6% of the market seeking extended stays.
- Adjust minimum nights based on seasonality – potentially shorter during low season and longer during peak demand periods in Golden Shores.
Golden Shores Airbnb Cancellation Policy Trends Analysis (2025)
Flexible
2 listings
11.1% of total
Moderate
6 listings
33.3% of total
Firm
5 listings
27.8% of total
Strict
5 listings
27.8% of total
Cancellation Policy Insights for Golden Shores
- The prevailing Airbnb cancellation policy trend in Golden Shores is Moderate, used by 33.3% of listings.
- A majority (55.6%) of hosts in Golden Shores utilize Firm or Strict policies, indicating a market where hosts prioritize booking security.
Recommendations for Hosts
- Consider adopting a Moderate policy to align with the 33.3% market standard in Golden Shores.
- Regularly review your cancellation policy against competitors and market demand shifts in Golden Shores.
Golden Shores STR Booking Lead Time Analysis (2025)
Average Booking Lead Time by Month
Booking Lead Time Insights for Golden Shores
- The overall average booking lead time for vacation rentals in Golden Shores is 35 days.
- Guests book furthest in advance for stays during April (average 59 days), likely coinciding with peak travel demand or local events.
- The shortest booking windows occur for stays in January (average 7 days), indicating more last-minute travel plans during this time.
- Seasonally, Spring (38 days avg.) sees the longest lead times, while Winter (27 days avg.) has the shortest, reflecting typical travel planning cycles.
Recommendations for Hosts
- Use the overall average lead time (35 days) as a baseline for your pricing and availability strategy in Golden Shores.
- For April stays, consider implementing length-of-stay discounts or slightly higher rates for bookings made less than 59 days out to capitalize on advance planning.
- During January, focus on last-minute booking availability and promotions, as guests book with very short notice (7 days avg.).
- Target marketing efforts for the Spring season well in advance (at least 38 days) to capture early planners.
- Monitor your own booking lead times against these Golden Shores averages to identify opportunities for dynamic pricing adjustments.
Popular & Essential Airbnb Amenities in Golden Shores (2025)
Amenity Prevalence
Amenity Insights for Golden Shores
- Essential amenities in Golden Shores that guests expect include: Wifi, Smoke alarm, TV, Air conditioning, Dishes and silverware, Kitchen. Lacking these (any) could significantly impact bookings.
- Popular amenities like Cooking basics, Carbon monoxide alarm, Free parking on premises are common but not universal. Offering these can provide a competitive edge.
Recommendations for Hosts
- Ensure your listing includes all essential amenities for Golden Shores: Wifi, Smoke alarm, TV, Air conditioning, Dishes and silverware, Kitchen.
- Consider adding popular differentiators like Cooking basics or Carbon monoxide alarm to increase appeal.
- Highlight unique or less common amenities you offer (e.g., hot tub, dedicated workspace, EV charger) in your listing description and photos.
- Regularly check competitor amenities in Golden Shores to stay competitive.
Golden Shores Airbnb Guest Demographics & Profile Analysis (2025)
Guest Profile Summary for Golden Shores
- The typical guest profile for Airbnb in Golden Shores consists of primarily domestic travelers (95%), often arriving from nearby California, typically belonging to the Post-2000s (Gen Z/Alpha) group (50%), primarily speaking English or Spanish.
- Domestic travelers account for 94.9% of guests.
- Key international markets include United States (94.9%) and South Africa (1.3%).
- Top languages spoken are English (72.5%) followed by Spanish (12.5%).
- A significant demographic segment is the Post-2000s (Gen Z/Alpha) group, representing 50% of guests.
Recommendations for Hosts
- Target domestic marketing efforts towards travelers from California and San Dimas.
- Tailor amenities and listing descriptions to appeal to the dominant Post-2000s (Gen Z/Alpha) demographic (e.g., highlight fast WiFi, smart home features, local guides).
- Highlight unique local experiences or amenities relevant to the primary guest profile.
- Consider seasonal promotions aligned with peak travel times for key origin markets.
Nearby Short-Term Rental Market Comparison
How does the Golden Shores Airbnb market stack up against its neighbors? Compare key performance metrics like average monthly revenue, ADR, and occupancy rates in surrounding areas to understand the broader regional STR landscape.
| Market | Active Properties | Monthly Revenue | Daily Rate | Avg. Occupancy |
|---|---|---|---|---|
| Parker Strip | 118 | $3,345 | $403.10 | 33% |
| Needles | 29 | $2,863 | $344.94 | 30% |
| Lake Havasu City | 1,316 | $2,624 | $284.63 | 37% |
| Ehrenberg | 28 | $2,161 | $192.19 | 42% |
| Bullhead City | 384 | $2,104 | $255.09 | 36% |
| Boulder City | 14 | $1,939 | $193.44 | 47% |
| Mohave Valley | 90 | $1,852 | $261.81 | 34% |
| Havasu Lake | 11 | $1,677 | $298.86 | 26% |
| Blythe | 15 | $1,639 | $164.31 | 38% |
| Meadview | 30 | $1,429 | $163.24 | 32% |