Globe Airbnb Market Analysis 2026: Short Term Rental Data & Vacation Rental Statistics in Arizona, United States
Is Airbnb profitable in Globe in 2026? Explore comprehensive Airbnb analytics for Globe, Arizona, United States to uncover income potential. This 2026 STR market report for Globe, based on AirROI data from February 2025 to January 2026, reveals key trends in the niche market of 33 active listings.
Whether you're considering an Airbnb investment in Globe, optimizing your existing vacation rental, or exploring rental arbitrage opportunities, understanding the Globe Airbnb data is crucial. Leveraging the low regulation environment is key to maximizing your short term rental income potential. Let's dive into the specifics.
Key Globe Airbnb Performance Metrics Overview
Monthly Airbnb Revenue Variations & Income Potential in Globe (2026)
Understanding the monthly revenue variations for Airbnb listings in Globe is key to maximizing your short term rental income potential. Seasonality significantly impacts earnings. Our analysis, based on data from the past 12 months, shows that the peak revenue month for STRs in Globe is typically October, while August often presents the lowest earnings, highlighting opportunities for strategic pricing adjustments during shoulder and low seasons. Explore the typical Airbnb income in Globe across different performance tiers:
- Best-in-class properties (Top 10%) achieve $4,007+ monthly, often utilizing dynamic pricing and superior guest experiences.
- Strong performing properties (Top 25%) earn $2,747 or more, indicating effective management and desirable locations/amenities.
- Typical properties (Median) generate around $1,600 per month, representing the average market performance.
- Entry-level properties (Bottom 25%) see earnings around $783, often with potential for optimization.
Average Monthly Airbnb Earnings Trend in Globe
Globe Airbnb Occupancy Rate Trends (2026)
Maximize your bookings by understanding the Globe STR occupancy trends. Seasonal demand shifts significantly influence how often properties are booked. Typically, Marchsees the highest demand (peak season occupancy), while July experiences the lowest (low season). Effective strategies, like adjusting minimum stays or offering promotions, can boost occupancy during slower periods. Here's how different property tiers perform in Globe:
- Best-in-class properties (Top 10%) achieve 83%+ occupancy, indicating high desirability and potentially optimized availability.
- Strong performing properties (Top 25%) maintain 68% or higher occupancy, suggesting good market fit and guest satisfaction.
- Typical properties (Median) have an occupancy rate around 46%.
- Entry-level properties (Bottom 25%) average 25% occupancy, potentially facing higher vacancy.
Average Monthly Occupancy Rate Trend in Globe
Average Daily Rate (ADR) Airbnb Trends in Globe (2026)
Effective short term rental pricing strategy in Globe involves understanding monthly ADR fluctuations. The Average Daily Rate (ADR) for Airbnb in Globe typically peaks in December and dips lowest during April. Leveraging Airbnb dynamic pricing tools or strategies based on this seasonality can significantly boost revenue. Here's a look at the typical nightly rates achieved:
- Best-in-class properties (Top 10%) command rates of $176+ per night, often due to premium features or locations.
- Strong performing properties (Top 25%) achieve nightly rates of $144 or more.
- Typical properties (Median) charge around $120 per night.
- Entry-level properties (Bottom 25%) earn around $77 per night.
Average Daily Rate (ADR) Trend by Month in Globe
Get Live Globe Market Intelligence 👇

Explore Real-time Analytics
Airbnb Seasonality Analysis & Trends in Globe (2026)
Peak Season (October, March, November)
- Revenue averages $2,436 per month
- Occupancy rates average 58.3%
- Daily rates average $118
Shoulder Season
- Revenue averages $1,899 per month
- Occupancy maintains around 44.6%
- Daily rates hold near $117
Low Season (April, May, August)
- Revenue drops to average $1,516 per month
- Occupancy decreases to average 41.7%
- Daily rates adjust to average $112
Seasonality Insights for Globe
- The Airbnb seasonality in Globe shows moderate seasonality with distinct peak and low periods. While the sections above show seasonal averages, it's also insightful to look at the extremes:
- During the high season, the absolute peak month showcases Globe's highest earning potential, with monthly revenues capable of climbing to $2,573, occupancy reaching a high of 69.8%, and ADRs peaking at $124.
- Conversely, the slowest single month of the year, typically falling within the low season, marks the market's lowest point. In this month, revenue might dip to $1,470, occupancy could drop to 36.0%, and ADRs may adjust down to $108.
- Understanding both the seasonal averages and these monthly peaks and troughs in revenue, occupancy, and ADR is crucial for maximizing your Airbnb profit potential in Globe.
Seasonal Strategies for Maximizing Profit
- Peak Season: Maximize revenue through premium pricing and potentially longer minimum stays. Ensure high availability.
- Low Season: Offer competitive pricing, special promotions (e.g., extended stay discounts), and flexible cancellation policies. Target off-season travelers like remote workers or budget-conscious guests.
- Shoulder Seasons: Implement dynamic pricing that balances peak and low rates. Target weekend travelers or specific events. Offer slightly more flexible terms than peak season.
- Regularly analyze your own performance against these Globe seasonality benchmarks and adjust your pricing and availability strategy accordingly.
Best Areas for Airbnb Investment in Globe (2026)
Exploring the top neighborhoods for short-term rentals in Globe? This section highlights key areas, outlining why they are attractive for hosts and guests, along with notable local attractions. Consider these locations based on your target guest profile and investment strategy.
| Neighborhood / Area | Why Host Here? (Target Guests & Appeal) | Key Attractions & Landmarks |
|---|---|---|
| Downtown Globe | The historic heart of Globe, featuring charming architecture and local shops. It's a hub for events and easy access to museums, making it attractive for tourists interested in history and culture. | Gila County Historical Museum, Old Dominion Historic Mine Park, Besh Ba Gowah Archaeological Park, Downtown Globe shops, Farmers Market |
| Miami Gulch | A scenic area known for its outdoor recreational opportunities, Miami Gulch attracts nature lovers and those looking for a quiet escape with proximity to hiking and camping. | Hiking trails, Campgrounds, Pinto Valley Mine views, Picacho Peak, Skiing at nearby resorts |
| Cayenne Ranch | A rural community with spacious lots and natural beauty, perfect for guests seeking solitude and tranquility. Ideal for glamping and outdoor experiences in the Arizona wilderness. | Wildlife viewing, Stargazing, Horseback riding, Remote hiking trails, Nature photography opportunities |
| Copper Hill | Located near old mining areas, Copper Hill combines historical significance with natural beauty. It is known for its copper history and attracts those interested in mining heritage. | Copper mining ghost towns, Mining museums, Scenic views, Photography opportunities, Historical tours |
| San Carlos | The gateway to the San Carlos Apache Reservation, offering a unique culture and outdoor experiences. A great location for visitors interested in Native American history and nature. | San Carlos Lake, Apache culture, Outdoor recreation, Fishing, Hiking trails |
| Globe-Miami | Combining the towns of Globe and Miami, this area offers a mix of local culture, historical sites, and outdoor activities, making it diverse and appealing for various guests. | Globe's historic downtown, Cobre Valley Center for the Arts, Nearby lakes and parks, Local festivals, Cultural events |
| Cibecue Falls | A stunning natural waterfall area, attracting hikers and nature enthusiasts. Offers a unique and refreshing experience in the Arizona desert landscape. | Cibecue Falls hiking trails, Swimming holes, Scenic beauty, Wildflower viewing, Outdoor photography |
| Roosevelt Lake | A popular recreational area with fishing, boating, and camping, perfect for families and groups looking to enjoy the great outdoors and water activities. | Fishing spots, Boat rentals, Picnic areas, Camping grounds, Scenic viewpoints |
Understanding Airbnb License Requirements & STR Laws in Globe (2026)
While Globe, Arizona, United States currently shows low STR regulations, specific Airbnb license requirements might still exist or change. Always verify the latest short term rental regulations and Airbnb license requirements directly with local government authorities for Globe to ensure full compliance before hosting.
(Source: AirROI data, 2026, finding no licensed listings among those analyzed)
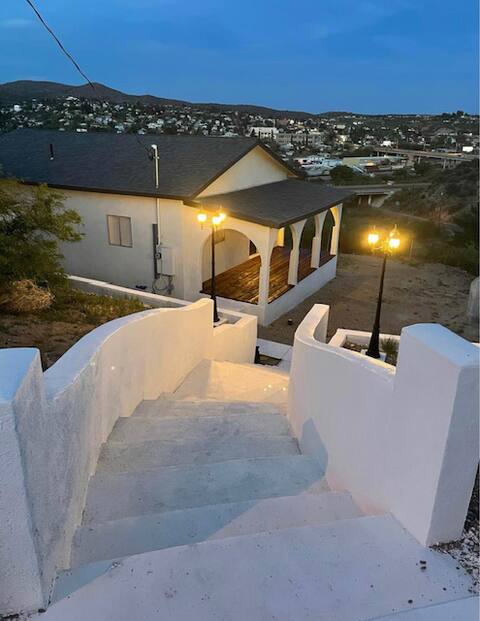
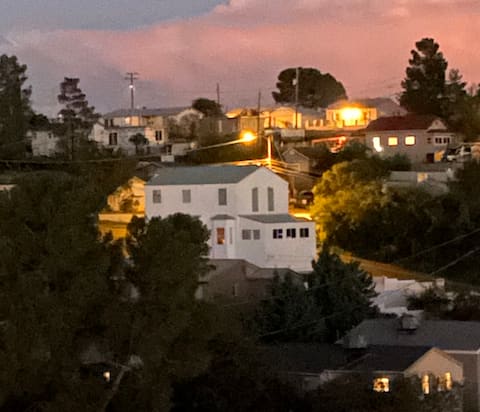
Top Performing Airbnb Properties in Globe (2026)
Benchmark your potential! Explore examples of top-performing Airbnb properties in Globebased on Trailing Twelve Month (TTM) revenue. Analyze their characteristics, revenue, occupancy rate, and ADR to understand what drives success in this market.
Modern Cozy Open Concept
Entire Place • 4 bedrooms

Peaceful 4 bedroom 2.5 bath house
Entire Place • 3 bedrooms

Charming Historic Globe House
Entire Place • 3 bedrooms
Copper Canyon Casa - Near Historic Downtown Globe
Entire Place • 4 bedrooms

The views - 2bed/2bath
Entire Place • 2 bedrooms

Treehouse
Entire Place • 2 bedrooms
Note: Performance varies based on location, size, amenities, seasonality, and management quality. Data reflects the past 12 months.
Top Performing Airbnb Hosts in Globe (2026)
Learn from the best! This table showcases top-performing Airbnb hosts in Globe based on the number of properties managed and estimated total revenue over the past year. Analyze their scale and performance metrics.
| Host Name | Properties | Grossing Revenue | Stay Reviews | Avg Rating |
|---|---|---|---|---|
| Erin | 7 | $118,595 | 341 | 4.82/5.0 |
| Teresa | 2 | $81,122 | 80 | 4.84/5.0 |
| Keo | 4 | $57,043 | 58 | 4.68/5.0 |
| Phillip | 2 | $52,576 | 135 | 4.97/5.0 |
| Linda | 2 | $45,777 | 110 | 4.99/5.0 |
| Jordan | 1 | $41,551 | 60 | 4.90/5.0 |
| Chad | 1 | $40,528 | 75 | 4.93/5.0 |
| Tammie | 1 | $25,409 | 255 | 4.93/5.0 |
| Edwardo M | 2 | $20,806 | 59 | 4.96/5.0 |
| Thea | 2 | $17,242 | 492 | 4.96/5.0 |
Analyzing the strategies of top hosts, such as their property selection, pricing, and guest communication, can offer valuable lessons for optimizing your own Airbnb operations in Globe.
Dive Deeper: Advanced Globe STR Market Data (2026)
Ready to unlock more insights? AirROI provides access to advanced metrics and comprehensive Airbnb data for Globe. Explore detailed analytics beyond this report to refine your investment strategy, optimize pricing, and maximize your vacation rental profits.
Explore Advanced MetricsGlobe Short-Term Rental Market Composition (2026): Property & Room Types
Room Type Distribution
Property Type Distribution
Market Composition Insights for Globe
- The Globe Airbnb market composition is heavily skewed towards Entire Home/Apt listings, which make up 90.9% of the 33 active rentals. This indicates strong guest preference for privacy and space.
- Looking at the property type distribution in Globe, House properties are the most common (48.5%), reflecting the local real estate landscape.
- Houses represent a significant 48.5% portion, catering likely to families or larger groups.
- The presence of 9.1% Hotel/Boutique listings indicates integration with traditional hospitality.
- Smaller segments like others, unique stays (combined 6.0%) offer potential for unique stay experiences.
Globe Airbnb Room Capacity Analysis (2026): Bedroom Distribution
Distribution of Listings by Number of Bedrooms
Room Capacity Insights for Globe
- The dominant room capacity in Globe is 1 bedroom listings, making up 45.5% of the market. This suggests a strong demand for properties suitable for couples or solo travelers.
- Together, 1 bedroom and 2 bedrooms properties represent 72.8% of the active Airbnb listings in Globe, indicating a high concentration in these sizes.
Globe Vacation Rental Guest Capacity Trends (2026)
Distribution of Listings by Guest Capacity
Guest Capacity Insights for Globe
- The most common guest capacity trend in Globe vacation rentals is listings accommodating 2 guests (24.2%). This suggests the primary traveler segment is likely couples or solo travelers.
- Properties designed for 2 guests and 4 guests dominate the Globe STR market, accounting for 39.4% of listings.
- 21.2% of properties accommodate 6+ guests, serving the market segment for larger families or group travel in Globe.
- On average, properties in Globe are equipped to host 3.7 guests.
Globe Airbnb Booking Patterns (2026): Available vs. Booked Days
Available Days Distribution
Booked Days Distribution
Booking Pattern Insights for Globe
- The most common availability pattern in Globe falls within the 181-270 days range, representing 42.4% of listings. This suggests many properties have significant open periods on their calendars.
- Approximately 69.7% of listings show high availability (181+ days open annually), indicating potential for increased bookings or specific owner usage patterns.
- For booked days, the 91-180 days range is most frequent in Globe (42.4%), reflecting common guest stay durations or potential owner blocking patterns.
- A notable 30.3% of properties secure long booking periods (181+ days booked per year), highlighting successful long-term rental strategies or significant owner usage.
Globe Airbnb Minimum Stay Requirements Analysis
Distribution of Listings by Minimum Night Requirement
1 Night
12 listings
36.4% of total
2 Nights
14 listings
42.4% of total
7-29 Nights
3 listings
9.1% of total
30+ Nights
4 listings
12.1% of total
Key Insights
- The most prevalent minimum stay requirement in Globe is 2 Nights, adopted by 42.4% of listings. This highlights the market's preference for shorter, flexible bookings.
- A strong majority (78.8%) of the Globe Airbnb data shows acceptance of very short stays (1-2 nights), indicating a dynamic, high-turnover market.
- A significant segment (12.1%) caters to monthly stays (30+ nights) in Globe, pointing to opportunities in the extended-stay market.
Recommendations
- Align with the market by considering a 2 Nights minimum stay, as 42.4% of Globe hosts use this setting.
- Explore offering discounts for stays of 30+ nights to attract the 12.1% of the market seeking extended stays.
- Adjust minimum nights based on seasonality – potentially shorter during low season and longer during peak demand periods in Globe.
Globe Airbnb Cancellation Policy Trends Analysis (2026)
Flexible
5 listings
15.2% of total
Moderate
22 listings
66.7% of total
Firm
4 listings
12.1% of total
Strict
2 listings
6.1% of total
Cancellation Policy Insights for Globe
- The prevailing Airbnb cancellation policy trend in Globe is Moderate, used by 66.7% of listings.
- The market strongly favors guest-friendly terms, with 81.9% of listings offering Flexible or Moderate policies. This suggests guests in Globe may expect booking flexibility.
- Strict cancellation policies are quite rare (6.1%), potentially making listings with this policy less competitive unless justified by high demand or property type.
Recommendations for Hosts
- Consider adopting a Moderate policy to align with the 66.7% market standard in Globe.
- Using a Strict policy might deter some guests, as only 6.1% of listings use it. Evaluate if potential revenue protection outweighs possible lower booking rates.
- Regularly review your cancellation policy against competitors and market demand shifts in Globe.
Globe STR Booking Lead Time Analysis (2026)
Average Booking Lead Time by Month
Booking Lead Time Insights for Globe
- The overall average booking lead time for vacation rentals in Globe is 33 days.
- Guests book furthest in advance for stays during July (average 50 days), likely coinciding with peak travel demand or local events.
- The shortest booking windows occur for stays in January (average 20 days), indicating more last-minute travel plans during this time.
- Seasonally, Spring (43 days avg.) sees the longest lead times, while Fall (28 days avg.) has the shortest, reflecting typical travel planning cycles.
Recommendations for Hosts
- Use the overall average lead time (33 days) as a baseline for your pricing and availability strategy in Globe.
- For July stays, consider implementing length-of-stay discounts or slightly higher rates for bookings made less than 50 days out to capitalize on advance planning.
- Target marketing efforts for the Spring season well in advance (at least 43 days) to capture early planners.
- Monitor your own booking lead times against these Globe averages to identify opportunities for dynamic pricing adjustments.
Popular & Essential Airbnb Amenities in Globe (2026)
Amenity Prevalence
Amenity Insights for Globe
- Essential amenities in Globe that guests expect include: Air conditioning, Fire extinguisher, Microwave, Wifi, Coffee maker, Hot water, Bed linens, Dishes and silverware. Lacking these (any) could significantly impact bookings.
- Popular amenities like Smoke alarm, Kitchen are common but not universal. Offering these can provide a competitive edge.
Recommendations for Hosts
- Ensure your listing includes all essential amenities for Globe: Air conditioning, Fire extinguisher, Microwave, Wifi, Coffee maker, Hot water, Bed linens, Dishes and silverware.
- Prioritize adding missing essentials: Fire extinguisher, Microwave, Wifi, Coffee maker, Hot water, Bed linens, Dishes and silverware.
- Consider adding popular differentiators like Smoke alarm or Kitchen to increase appeal.
- Highlight unique or less common amenities you offer (e.g., hot tub, dedicated workspace, EV charger) in your listing description and photos.
- Regularly check competitor amenities in Globe to stay competitive.
Globe Airbnb Guest Demographics & Profile Analysis (2026)
Guest Profile Summary for Globe
- The typical guest profile for Airbnb in Globe consists of primarily domestic travelers (96%), often arriving from nearby Phoenix, typically belonging to the Post-2000s (Gen Z/Alpha) group (50%), primarily speaking English or Spanish.
- Domestic travelers account for 95.6% of guests.
- Key international markets include United States (95.6%) and Canada (2.2%).
- Top languages spoken are English (77.3%) followed by Spanish (11.8%).
- A significant demographic segment is the Post-2000s (Gen Z/Alpha) group, representing 50% of guests.
Recommendations for Hosts
- Target domestic marketing efforts towards travelers from Phoenix and Tempe.
- Tailor amenities and listing descriptions to appeal to the dominant Post-2000s (Gen Z/Alpha) demographic (e.g., highlight fast WiFi, smart home features, local guides).
- Highlight unique local experiences or amenities relevant to the primary guest profile.
- Consider seasonal promotions aligned with peak travel times for key origin markets.
Nearby Short-Term Rental Market Comparison
How does the Globe Airbnb market stack up against its neighbors? Compare key performance metrics like average monthly revenue, ADR, and occupancy rates in surrounding areas to understand the broader regional STR landscape.
| Market | Active Properties | Monthly Revenue | Daily Rate | Avg. Occupancy |
|---|---|---|---|---|
| Paradise Valley | 67 | $10,566 | $1242.99 | 41% |
| Sedona | 1,658 | $5,761 | $410.99 | 50% |
| Sedona City Limit | 372 | $4,884 | $333.39 | 51% |
| Scottsdale | 4,331 | $4,202 | $370.53 | 47% |
| Carefree | 31 | $4,052 | $522.63 | 39% |
| Cave Creek | 132 | $4,016 | $399.83 | 42% |
| Big Park | 427 | $3,618 | $294.75 | 47% |
| Fountain Hills | 215 | $3,506 | $356.69 | 45% |
| Star Valley | 12 | $3,374 | $279.20 | 43% |
| Payson town limits | 44 | $3,258 | $293.23 | 44% |