Flagstaff Airbnb Market Analysis 2026: Short Term Rental Data & Vacation Rental Statistics in Arizona, United States
Is Airbnb profitable in Flagstaff in 2026? Explore comprehensive Airbnb analytics for Flagstaff, Arizona, United States to uncover income potential. This 2026 STR market report for Flagstaff, based on AirROI data from February 2025 to January 2026, reveals key trends in the bustling market of 1,391 active listings.
Whether you're considering an Airbnb investment in Flagstaff, optimizing your existing vacation rental, or exploring rental arbitrage opportunities, understanding the Flagstaff Airbnb data is crucial. Leveraging the low regulation environment is key to maximizing your short term rental income potential. Let's dive into the specifics.
Key Flagstaff Airbnb Performance Metrics Overview
Monthly Airbnb Revenue Variations & Income Potential in Flagstaff (2026)
Understanding the monthly revenue variations for Airbnb listings in Flagstaff is key to maximizing your short term rental income potential. Seasonality significantly impacts earnings. Our analysis, based on data from the past 12 months, shows that the peak revenue month for STRs in Flagstaff is typically December, while February often presents the lowest earnings, highlighting opportunities for strategic pricing adjustments during shoulder and low seasons. Explore the typical Airbnb income in Flagstaff across different performance tiers:
- Best-in-class properties (Top 10%) achieve $7,793+ monthly, often utilizing dynamic pricing and superior guest experiences.
- Strong performing properties (Top 25%) earn $5,183 or more, indicating effective management and desirable locations/amenities.
- Typical properties (Median) generate around $3,288 per month, representing the average market performance.
- Entry-level properties (Bottom 25%) see earnings around $1,854, often with potential for optimization.
Average Monthly Airbnb Earnings Trend in Flagstaff
Flagstaff Airbnb Occupancy Rate Trends (2026)
Maximize your bookings by understanding the Flagstaff STR occupancy trends. Seasonal demand shifts significantly influence how often properties are booked. Typically, Julysees the highest demand (peak season occupancy), while January experiences the lowest (low season). Effective strategies, like adjusting minimum stays or offering promotions, can boost occupancy during slower periods. Here's how different property tiers perform in Flagstaff:
- Best-in-class properties (Top 10%) achieve 82%+ occupancy, indicating high desirability and potentially optimized availability.
- Strong performing properties (Top 25%) maintain 69% or higher occupancy, suggesting good market fit and guest satisfaction.
- Typical properties (Median) have an occupancy rate around 50%.
- Entry-level properties (Bottom 25%) average 29% occupancy, potentially facing higher vacancy.
Average Monthly Occupancy Rate Trend in Flagstaff
Average Daily Rate (ADR) Airbnb Trends in Flagstaff (2026)
Effective short term rental pricing strategy in Flagstaff involves understanding monthly ADR fluctuations. The Average Daily Rate (ADR) for Airbnb in Flagstaff typically peaks in December and dips lowest during February. Leveraging Airbnb dynamic pricing tools or strategies based on this seasonality can significantly boost revenue. Here's a look at the typical nightly rates achieved:
- Best-in-class properties (Top 10%) command rates of $472+ per night, often due to premium features or locations.
- Strong performing properties (Top 25%) achieve nightly rates of $324 or more.
- Typical properties (Median) charge around $222 per night.
- Entry-level properties (Bottom 25%) earn around $150 per night.
Average Daily Rate (ADR) Trend by Month in Flagstaff
Get Live Flagstaff Market Intelligence 👇

Explore Real-time Analytics
Airbnb Seasonality Analysis & Trends in Flagstaff (2026)
Peak Season (December, July, June)
- Revenue averages $5,279 per month
- Occupancy rates average 55.4%
- Daily rates average $297
Shoulder Season
- Revenue averages $3,964 per month
- Occupancy maintains around 49.4%
- Daily rates hold near $274
Low Season (January, February, April)
- Revenue drops to average $3,045 per month
- Occupancy decreases to average 42.4%
- Daily rates adjust to average $258
Seasonality Insights for Flagstaff
- The Airbnb seasonality in Flagstaff shows highly seasonal trends requiring careful strategy. While the sections above show seasonal averages, it's also insightful to look at the extremes:
- During the high season, the absolute peak month showcases Flagstaff's highest earning potential, with monthly revenues capable of climbing to $5,735, occupancy reaching a high of 60.0%, and ADRs peaking at $328.
- Conversely, the slowest single month of the year, typically falling within the low season, marks the market's lowest point. In this month, revenue might dip to $2,712, occupancy could drop to 37.4%, and ADRs may adjust down to $240.
- Understanding both the seasonal averages and these monthly peaks and troughs in revenue, occupancy, and ADR is crucial for maximizing your Airbnb profit potential in Flagstaff.
Seasonal Strategies for Maximizing Profit
- Peak Season: Maximize revenue through premium pricing and potentially longer minimum stays. Ensure high availability.
- Low Season: Offer competitive pricing, special promotions (e.g., extended stay discounts), and flexible cancellation policies. Target off-season travelers like remote workers or budget-conscious guests.
- Shoulder Seasons: Implement dynamic pricing that balances peak and low rates. Target weekend travelers or specific events. Offer slightly more flexible terms than peak season.
- Regularly analyze your own performance against these Flagstaff seasonality benchmarks and adjust your pricing and availability strategy accordingly.
Best Areas for Airbnb Investment in Flagstaff (2026)
Exploring the top neighborhoods for short-term rentals in Flagstaff? This section highlights key areas, outlining why they are attractive for hosts and guests, along with notable local attractions. Consider these locations based on your target guest profile and investment strategy.
| Neighborhood / Area | Why Host Here? (Target Guests & Appeal) | Key Attractions & Landmarks |
|---|---|---|
| Downtown Flagstaff | Vibrant area with a mix of historic charm and modern amenities. Attracts visitors for its dining, shopping, and entertainment options, making it a prime spot for short-term rentals. | Historic Route 66, Lowell Observatory, Coconino County Courthouse, Museum of Northern Arizona, Flagstaff Downtown Market |
| University Heights | A popular neighborhood near Northern Arizona University. Ideal for accommodating students and university visitors during school terms and events. | Northern Arizona University, Ponderosa Pines, Coconino National Forest, local cafes and eateries |
| West Flagstaff | Suburban feel with close access to outdoor activities. Entices families and outdoor enthusiasts looking for access to trails and recreational activities. | Buffalo Park, Snowbowl Ski Resort, Coconino National Forest trails, local parks and playgrounds |
| East Flagstaff | Quieter residential area with good access to amenities and the city center. Suitable for longer-term renters and families. | East Flagstaff Community Park, Flagstaff Mall, local shopping centers |
| Kachina Village | A serene neighborhood with cabin-style homes in the forest. Appeals to those seeking a nature getaway while still being close to Flagstaff attractions. | Oak Creek Canyon, Coconino National Forest, hiking trails |
| Walnut Canyon | Known for its stunning canyon and archaeological sites. Ideal for nature lovers and those interested in outdoor activities and history. | Walnut Canyon National Monument, hiking trails, magnificent views |
| Little America | Home to the famous Little America Hotel, this area offers a mix of nature and comfort, attracting travelers looking for a peaceful stay with great amenities. | Little America Hotel, Forest trails, great dining options |
| Mountainaire | A cozy neighborhood with proximity to the mountains, making it perfect for skiing and snowboarding enthusiasts in winter and hiking in summer. | Arizona Snowbowl, Coconino National Forest, hiking and biking trails |
Understanding Airbnb License Requirements & STR Laws in Flagstaff (2026)
While Flagstaff, Arizona, United States currently shows low STR regulations, specific Airbnb license requirements might still exist or change. Always verify the latest short term rental regulations and Airbnb license requirements directly with local government authorities for Flagstaff to ensure full compliance before hosting.
(Source: AirROI data, 2026, based on 0% licensed listings)
Top Performing Airbnb Properties in Flagstaff (2026)
Benchmark your potential! Explore examples of top-performing Airbnb properties in Flagstaffbased on Trailing Twelve Month (TTM) revenue. Analyze their characteristics, revenue, occupancy rate, and ADR to understand what drives success in this market.
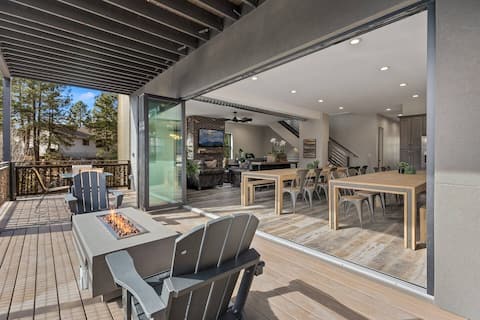
"The Aspen"-Gathering Tree's Family Reunion Deluxe
Entire Place • 9 bedrooms
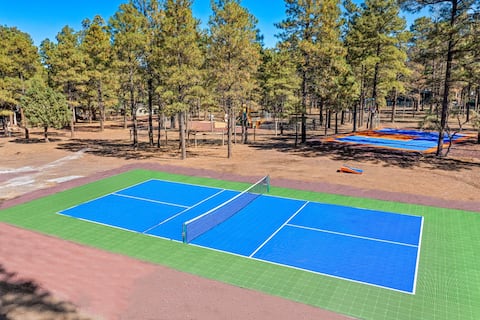
Pickleball | Game Room | Hot Tub | Playground
Entire Place • 8 bedrooms

Large Flagstaff Retreat w/ Hot Tub & Guest Home
Entire Place • 7 bedrooms
"The Ponderosa"-Gathering Tree's Deluxe Group Stay
Entire Place • 8 bedrooms
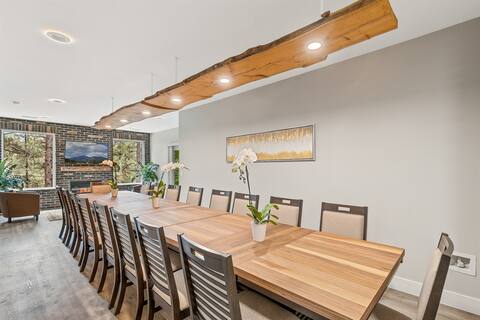
"The Juniper"-Gathering Tree's Ultimate 12 suite D
Entire Place • 12 bedrooms
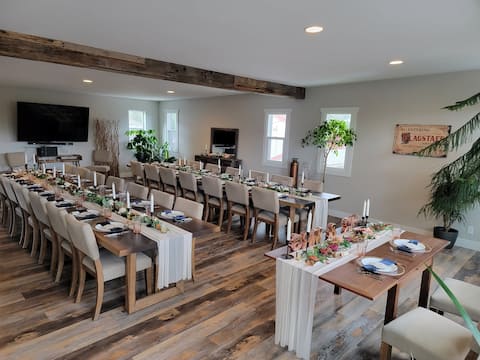
"The Ultimate Village" - Gathering Tree's Estate
Entire Place • 19 bedrooms
Note: Performance varies based on location, size, amenities, seasonality, and management quality. Data reflects the past 12 months.
Top Performing Airbnb Hosts in Flagstaff (2026)
Learn from the best! This table showcases top-performing Airbnb hosts in Flagstaff based on the number of properties managed and estimated total revenue over the past year. Analyze their scale and performance metrics.
| Host Name | Properties | Grossing Revenue | Stay Reviews | Avg Rating |
|---|---|---|---|---|
| Porter | 41 | $2,360,541 | 2983 | 4.82/5.0 |
| Jane | 26 | $1,914,728 | 1875 | 4.91/5.0 |
| Dwell | 19 | $1,631,216 | 1083 | 4.98/5.0 |
| Mariah And Jason | 8 | $1,602,225 | 186 | 4.98/5.0 |
| Rich | 26 | $1,551,739 | 5952 | 4.94/5.0 |
| Mason | 26 | $1,263,569 | 1587 | 4.90/5.0 |
| Flagstaff Vacation Properties | 29 | $1,244,714 | 3606 | 4.88/5.0 |
| Tim | 22 | $1,240,382 | 1561 | 4.86/5.0 |
| Evolve | 31 | $1,051,290 | 687 | 4.86/5.0 |
| Mass | 24 | $1,036,563 | 2151 | 4.91/5.0 |
Analyzing the strategies of top hosts, such as their property selection, pricing, and guest communication, can offer valuable lessons for optimizing your own Airbnb operations in Flagstaff.
Dive Deeper: Advanced Flagstaff STR Market Data (2026)
Ready to unlock more insights? AirROI provides access to advanced metrics and comprehensive Airbnb data for Flagstaff. Explore detailed analytics beyond this report to refine your investment strategy, optimize pricing, and maximize your vacation rental profits.
Explore Advanced MetricsFlagstaff Short-Term Rental Market Composition (2026): Property & Room Types
Room Type Distribution
Property Type Distribution
Market Composition Insights for Flagstaff
- The Flagstaff Airbnb market composition is heavily skewed towards Entire Home/Apt listings, which make up 93.7% of the 1,391 active rentals. This indicates strong guest preference for privacy and space.
- Looking at the property type distribution in Flagstaff, House properties are the most common (67.7%), reflecting the local real estate landscape.
- Houses represent a significant 67.7% portion, catering likely to families or larger groups.
- The presence of 6.2% Hotel/Boutique listings indicates integration with traditional hospitality.
Flagstaff Airbnb Room Capacity Analysis (2026): Bedroom Distribution
Distribution of Listings by Number of Bedrooms
Room Capacity Insights for Flagstaff
- The dominant room capacity in Flagstaff is 3 bedrooms listings, making up 25.1% of the market. This suggests a strong demand for properties suitable for families or small groups.
- Together, 3 bedrooms and 1 bedroom properties represent 46.0% of the active Airbnb listings in Flagstaff, indicating a high concentration in these sizes.
- A significant 52.2% of listings offer 3+ bedrooms, catering to larger groups and families seeking more space in Flagstaff.
Flagstaff Vacation Rental Guest Capacity Trends (2026)
Distribution of Listings by Guest Capacity
Guest Capacity Insights for Flagstaff
- The most common guest capacity trend in Flagstaff vacation rentals is listings accommodating 8+ guests (38.5%). This suggests the primary traveler segment is likely larger groups.
- Properties designed for 8+ guests and 4 guests dominate the Flagstaff STR market, accounting for 55.9% of listings.
- 60.0% of properties accommodate 6+ guests, serving the market segment for larger families or group travel in Flagstaff.
- On average, properties in Flagstaff are equipped to host 5.6 guests.
Flagstaff Airbnb Booking Patterns (2026): Available vs. Booked Days
Available Days Distribution
Booked Days Distribution
Booking Pattern Insights for Flagstaff
- The most common availability pattern in Flagstaff falls within the 181-270 days range, representing 33.4% of listings. This suggests many properties have significant open periods on their calendars.
- Approximately 62.0% of listings show high availability (181+ days open annually), indicating potential for increased bookings or specific owner usage patterns.
- For booked days, the 91-180 days range is most frequent in Flagstaff (33.4%), reflecting common guest stay durations or potential owner blocking patterns.
- A notable 39.4% of properties secure long booking periods (181+ days booked per year), highlighting successful long-term rental strategies or significant owner usage.
Flagstaff Airbnb Minimum Stay Requirements Analysis
Distribution of Listings by Minimum Night Requirement
1 Night
362 listings
26.2% of total
2 Nights
478 listings
34.5% of total
3 Nights
56 listings
4% of total
4-6 Nights
11 listings
0.8% of total
7-29 Nights
27 listings
2% of total
30+ Nights
450 listings
32.5% of total
Key Insights
- The most prevalent minimum stay requirement in Flagstaff is 2 Nights, adopted by 34.5% of listings. This highlights the market's preference for shorter, flexible bookings.
- A strong majority (60.7%) of the Flagstaff Airbnb data shows acceptance of very short stays (1-2 nights), indicating a dynamic, high-turnover market.
- A significant segment (32.5%) caters to monthly stays (30+ nights) in Flagstaff, pointing to opportunities in the extended-stay market.
Recommendations
- Align with the market by considering a 2 Nights minimum stay, as 34.5% of Flagstaff hosts use this setting.
- If feasible, allowing 1-night stays, especially midweek or during low season, could capture last-minute bookings, as only 26.2% currently do.
- Explore offering discounts for stays of 30+ nights to attract the 32.5% of the market seeking extended stays.
- Adjust minimum nights based on seasonality – potentially shorter during low season and longer during peak demand periods in Flagstaff.
Flagstaff Airbnb Cancellation Policy Trends Analysis (2026)
Super Strict 30 Days
36 listings
2.6% of total
Super Strict 60 Days
2 listings
0.1% of total
Limited
32 listings
2.3% of total
Flexible
198 listings
14.3% of total
Moderate
472 listings
34.1% of total
Firm
448 listings
32.3% of total
Strict
198 listings
14.3% of total
Cancellation Policy Insights for Flagstaff
- The prevailing Airbnb cancellation policy trend in Flagstaff is Moderate, used by 34.1% of listings.
- There's a relatively balanced mix between guest-friendly (48.4%) and stricter (46.6%) policies, offering choices for different guest needs.
Recommendations for Hosts
- Consider adopting a Moderate policy to align with the 34.1% market standard in Flagstaff.
- Using a Strict policy might deter some guests, as only 14.3% of listings use it. Evaluate if potential revenue protection outweighs possible lower booking rates.
- Regularly review your cancellation policy against competitors and market demand shifts in Flagstaff.
Flagstaff STR Booking Lead Time Analysis (2026)
Average Booking Lead Time by Month
Booking Lead Time Insights for Flagstaff
- The overall average booking lead time for vacation rentals in Flagstaff is 47 days.
- Guests book furthest in advance for stays during May (average 67 days), likely coinciding with peak travel demand or local events.
- The shortest booking windows occur for stays in February (average 29 days), indicating more last-minute travel plans during this time.
- Seasonally, Summer (58 days avg.) sees the longest lead times, while Winter (38 days avg.) has the shortest, reflecting typical travel planning cycles.
Recommendations for Hosts
- Use the overall average lead time (47 days) as a baseline for your pricing and availability strategy in Flagstaff.
- For May stays, consider implementing length-of-stay discounts or slightly higher rates for bookings made less than 67 days out to capitalize on advance planning.
- Target marketing efforts for the Summer season well in advance (at least 58 days) to capture early planners.
- Monitor your own booking lead times against these Flagstaff averages to identify opportunities for dynamic pricing adjustments.
Popular & Essential Airbnb Amenities in Flagstaff (2026)
Amenity Prevalence
Amenity Insights for Flagstaff
- Essential amenities in Flagstaff that guests expect include: Wifi, Smoke alarm, Heating, Free parking on premises, Hot water. Lacking these (any) could significantly impact bookings.
- Popular amenities like TV, Coffee maker, Dishes and silverware are common but not universal. Offering these can provide a competitive edge.
Recommendations for Hosts
- Ensure your listing includes all essential amenities for Flagstaff: Wifi, Smoke alarm, Heating, Free parking on premises, Hot water.
- Prioritize adding missing essentials: Wifi, Smoke alarm, Heating, Free parking on premises, Hot water.
- Consider adding popular differentiators like TV or Coffee maker to increase appeal.
- Highlight unique or less common amenities you offer (e.g., hot tub, dedicated workspace, EV charger) in your listing description and photos.
- Regularly check competitor amenities in Flagstaff to stay competitive.
Flagstaff Airbnb Guest Demographics & Profile Analysis (2026)
Guest Profile Summary for Flagstaff
- The typical guest profile for Airbnb in Flagstaff consists of primarily domestic travelers (95%), often arriving from nearby Phoenix, typically belonging to the Post-2000s (Gen Z/Alpha) group (50%), primarily speaking English or Spanish.
- Domestic travelers account for 94.6% of guests.
- Key international markets include United States (94.6%) and Canada (0.9%).
- Top languages spoken are English (68%) followed by Spanish (16.1%).
- A significant demographic segment is the Post-2000s (Gen Z/Alpha) group, representing 50% of guests.
Recommendations for Hosts
- Target domestic marketing efforts towards travelers from Phoenix and Tucson.
- Tailor amenities and listing descriptions to appeal to the dominant Post-2000s (Gen Z/Alpha) demographic (e.g., highlight fast WiFi, smart home features, local guides).
- Highlight unique local experiences or amenities relevant to the primary guest profile.
- Consider seasonal promotions aligned with peak travel times for key origin markets.
Nearby Short-Term Rental Market Comparison
How does the Flagstaff Airbnb market stack up against its neighbors? Compare key performance metrics like average monthly revenue, ADR, and occupancy rates in surrounding areas to understand the broader regional STR landscape.
| Market | Active Properties | Monthly Revenue | Daily Rate | Avg. Occupancy |
|---|---|---|---|---|
| Sedona | 1,658 | $5,761 | $410.99 | 50% |
| Sedona City Limit | 372 | $4,884 | $333.39 | 51% |
| Fort Valley | 38 | $4,747 | $408.22 | 43% |
| Doney Park | 17 | $4,085 | $299.83 | 54% |
| Red Lake | 12 | $3,899 | $257.65 | 54% |
| Kachina Village | 138 | $3,786 | $252.87 | 50% |
| Greenehaven | 48 | $3,740 | $333.15 | 44% |
| Big Park | 427 | $3,618 | $294.75 | 47% |
| Star Valley | 12 | $3,374 | $279.20 | 43% |
| Timberline-Fernwood | 17 | $3,344 | $202.94 | 58% |