Catalina Airbnb Market Analysis 2026: Short Term Rental Data & Vacation Rental Statistics in Arizona, United States
Is Airbnb profitable in Catalina in 2026? Explore comprehensive Airbnb analytics for Catalina, Arizona, United States to uncover income potential. This 2026 STR market report for Catalina, based on AirROI data from February 2025 to January 2026, reveals key trends in the niche market of 23 active listings.
Whether you're considering an Airbnb investment in Catalina, optimizing your existing vacation rental, or exploring rental arbitrage opportunities, understanding the Catalina Airbnb data is crucial. Leveraging the low regulation environment is key to maximizing your short term rental income potential. Let's dive into the specifics.
Key Catalina Airbnb Performance Metrics Overview
Monthly Airbnb Revenue Variations & Income Potential in Catalina (2026)
Understanding the monthly revenue variations for Airbnb listings in Catalina is key to maximizing your short term rental income potential. Seasonality significantly impacts earnings. Our analysis, based on data from the past 12 months, shows that the peak revenue month for STRs in Catalina is typically March, while October often presents the lowest earnings, highlighting opportunities for strategic pricing adjustments during shoulder and low seasons. Explore the typical Airbnb income in Catalina across different performance tiers:
- Best-in-class properties (Top 10%) achieve $5,309+ monthly, often utilizing dynamic pricing and superior guest experiences.
- Strong performing properties (Top 25%) earn $2,616 or more, indicating effective management and desirable locations/amenities.
- Typical properties (Median) generate around $1,378 per month, representing the average market performance.
- Entry-level properties (Bottom 25%) see earnings around $807, often with potential for optimization.
Average Monthly Airbnb Earnings Trend in Catalina
Catalina Airbnb Occupancy Rate Trends (2026)
Maximize your bookings by understanding the Catalina STR occupancy trends. Seasonal demand shifts significantly influence how often properties are booked. Typically, Marchsees the highest demand (peak season occupancy), while July experiences the lowest (low season). Effective strategies, like adjusting minimum stays or offering promotions, can boost occupancy during slower periods. Here's how different property tiers perform in Catalina:
- Best-in-class properties (Top 10%) achieve 75%+ occupancy, indicating high desirability and potentially optimized availability.
- Strong performing properties (Top 25%) maintain 50% or higher occupancy, suggesting good market fit and guest satisfaction.
- Typical properties (Median) have an occupancy rate around 33%.
- Entry-level properties (Bottom 25%) average 20% occupancy, potentially facing higher vacancy.
Average Monthly Occupancy Rate Trend in Catalina
Average Daily Rate (ADR) Airbnb Trends in Catalina (2026)
Effective short term rental pricing strategy in Catalina involves understanding monthly ADR fluctuations. The Average Daily Rate (ADR) for Airbnb in Catalina typically peaks in January and dips lowest during August. Leveraging Airbnb dynamic pricing tools or strategies based on this seasonality can significantly boost revenue. Here's a look at the typical nightly rates achieved:
- Best-in-class properties (Top 10%) command rates of $365+ per night, often due to premium features or locations.
- Strong performing properties (Top 25%) achieve nightly rates of $199 or more.
- Typical properties (Median) charge around $126 per night.
- Entry-level properties (Bottom 25%) earn around $99 per night.
Average Daily Rate (ADR) Trend by Month in Catalina
Get Live Catalina Market Intelligence 👇

Explore Real-time Analytics
Airbnb Seasonality Analysis & Trends in Catalina (2026)
Peak Season (March, February, December)
- Revenue averages $3,311 per month
- Occupancy rates average 55.6%
- Daily rates average $194
Shoulder Season
- Revenue averages $1,983 per month
- Occupancy maintains around 35.6%
- Daily rates hold near $184
Low Season (July, September, October)
- Revenue drops to average $1,346 per month
- Occupancy decreases to average 24.5%
- Daily rates adjust to average $182
Seasonality Insights for Catalina
- The Airbnb seasonality in Catalina shows highly seasonal trends requiring careful strategy. While the sections above show seasonal averages, it's also insightful to look at the extremes:
- During the high season, the absolute peak month showcases Catalina's highest earning potential, with monthly revenues capable of climbing to $3,910, occupancy reaching a high of 65.9%, and ADRs peaking at $212.
- Conversely, the slowest single month of the year, typically falling within the low season, marks the market's lowest point. In this month, revenue might dip to $1,240, occupancy could drop to 20.9%, and ADRs may adjust down to $163.
- Understanding both the seasonal averages and these monthly peaks and troughs in revenue, occupancy, and ADR is crucial for maximizing your Airbnb profit potential in Catalina.
Seasonal Strategies for Maximizing Profit
- Peak Season: Maximize revenue through premium pricing and potentially longer minimum stays. Ensure high availability.
- Low Season: Offer competitive pricing, special promotions (e.g., extended stay discounts), and flexible cancellation policies. Target off-season travelers like remote workers or budget-conscious guests.
- Shoulder Seasons: Implement dynamic pricing that balances peak and low rates. Target weekend travelers or specific events. Offer slightly more flexible terms than peak season.
- Regularly analyze your own performance against these Catalina seasonality benchmarks and adjust your pricing and availability strategy accordingly.
Best Areas for Airbnb Investment in Catalina (2026)
Exploring the top neighborhoods for short-term rentals in Catalina? This section highlights key areas, outlining why they are attractive for hosts and guests, along with notable local attractions. Consider these locations based on your target guest profile and investment strategy.
| Neighborhood / Area | Why Host Here? (Target Guests & Appeal) | Key Attractions & Landmarks |
|---|---|---|
| Catalina Foothills | A picturesque community known for its luxurious homes and breathtaking views of the Santa Catalina Mountains. It's popular among travelers looking for upscale accommodations close to nature and hiking opportunities. | Sabino Canyon, Ventana Canyon, Catalina State Park, Tucson Botanical Gardens, Shopping at La Encantada, Golf at La Paloma Country Club |
| Oro Valley | A vibrant and family-friendly town with a strong sense of community and proximity to outdoor activities. It's an attractive option for families and those seeking a quieter atmosphere while still near the excitement of Tucson. | Catalina State Park, The 49er Country Club, Steam Pump Ranch, Oro Valley Marketplace, Pusch Ridge Wilderness Area, Local parks and hiking trails |
| Downtown Tucson | The cultural hub of the region featuring a mix of historic sites, museums, and entertainment options. It offers plenty of activities for guests looking to explore the local culture and nightlife. | Tucson Museum of Art, Fox Theatre, 5 Points Market & Restaurant, Arizona History Museum, Tucson Convention Center, Historic 4th Avenue |
| Saddlebrooke | An active adult community that attracts visitors looking for a retirement lifestyle with resort-style amenities. It appeals to those seeking leisure activities such as golf and hiking. | SaddleBrooke Ranch Golf Club, DesertView Theater, SaddleBrooke One Clubhouse, Hiking trails in the Santa Catalina Mountains, Pickleball courts, Fitness clubs |
| Tanque Verde | A suburban neighborhood set against the backdrop of the Rincon Mountains, known for its peaceful atmosphere and outdoor activities. It's ideal for travelers seeking a retreat close to nature while remaining accessible to the city. | Saguaro National Park, Tanque Verde Falls, Arizona Zipline Adventures, Local ranches, Hiking trails in Mount Lemmon, Golf at Tanque Verde Ranch |
| Mount Lemmon | A unique mountain community offering cooler temperatures and stunning natural beauty. It's a top choice for visitors interested in hiking, skiing in winter, and escaping the desert heat. | Mount Lemmon Ski Valley, San Pedro Vista, Sky Island Scenic Byway, Hiking in the Coronado National Forest, Outdoor summer concerts, Fire Lookout |
| Catalina | A small community known for its rural charm and access to outdoor adventures. It provides a more laid-back atmosphere, suitable for those who want to connect with nature while still close to Tucson. | Saguaro National Park, Hiking and biking trails, Local farms, Fishing spots, Scenic views across the desert, Nearby attractions in Tucson |
| Vail | A growing community that often attracts visitors to its friendly atmosphere and quick access to outdoor activities. It's a good option for families and nature lovers looking for a comfortable stay. | Colossal Cave Mountain Park, Vail Public Library, Local farms, Saguaro National Park, Hiking trails, Community parks |
Understanding Airbnb License Requirements & STR Laws in Catalina (2026)
While Catalina, Arizona, United States currently shows low STR regulations, specific Airbnb license requirements might still exist or change. Always verify the latest short term rental regulations and Airbnb license requirements directly with local government authorities for Catalina to ensure full compliance before hosting.
(Source: AirROI data, 2026, finding no licensed listings among those analyzed)
Top Performing Airbnb Properties in Catalina (2026)
Benchmark your potential! Explore examples of top-performing Airbnb properties in Catalinabased on Trailing Twelve Month (TTM) revenue. Analyze their characteristics, revenue, occupancy rate, and ADR to understand what drives success in this market.
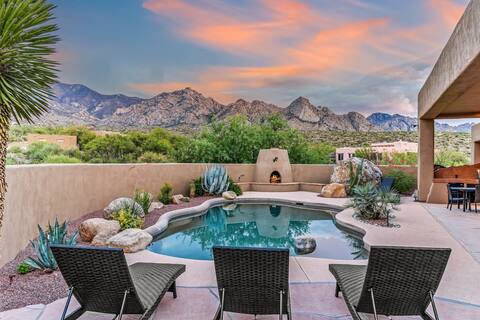
WOW Views, STEPS to Hiking/Biking & a Heated Pool!
Entire Place • 5 bedrooms
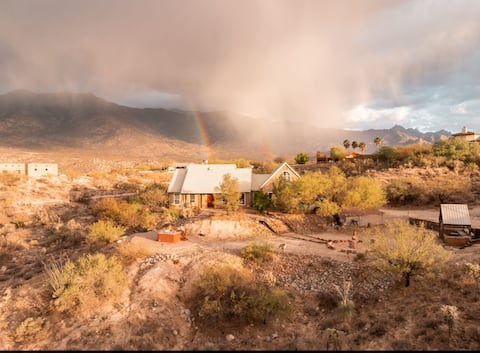
Mountain retreat Mt Lemmon View-Hottub/pool/18!
Entire Place • 4 bedrooms
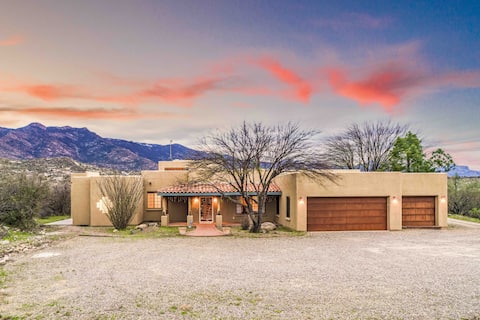
Tucson Desert Diamond-pool, family/kid friendly
Entire Place • 4 bedrooms
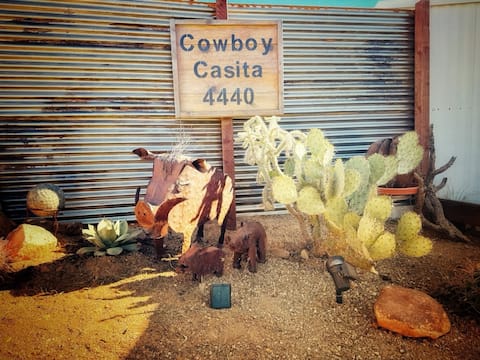
Cowboy CasitaCatalina HideawayWildlife Refuge
Entire Place • 1 bedroom
Secluded w/ views 4BD 2BA 1 acre
Entire Place • 4 bedrooms
Quiet 2 Bedroom retreat
Entire Place • 2 bedrooms
Note: Performance varies based on location, size, amenities, seasonality, and management quality. Data reflects the past 12 months.
Top Performing Airbnb Hosts in Catalina (2026)
Learn from the best! This table showcases top-performing Airbnb hosts in Catalina based on the number of properties managed and estimated total revenue over the past year. Analyze their scale and performance metrics.
| Host Name | Properties | Grossing Revenue | Stay Reviews | Avg Rating |
|---|---|---|---|---|
| Laura | 1 | $74,758 | 53 | 4.98/5.0 |
| Andrea | 1 | $49,359 | 40 | 4.95/5.0 |
| Joanne | 1 | $44,532 | 26 | 4.69/5.0 |
| Amy | 1 | $38,208 | 94 | 4.94/5.0 |
| Peggi | 1 | $29,693 | 27 | 4.96/5.0 |
| Carmen | 1 | $28,458 | 41 | 4.98/5.0 |
| Cherlyn | 1 | $27,824 | 58 | 4.76/5.0 |
| Diane | 1 | $26,222 | 230 | 4.99/5.0 |
| Timothy | 2 | $24,961 | 136 | 4.98/5.0 |
| David | 1 | $15,677 | 2 | Not Rated |
Analyzing the strategies of top hosts, such as their property selection, pricing, and guest communication, can offer valuable lessons for optimizing your own Airbnb operations in Catalina.
Dive Deeper: Advanced Catalina STR Market Data (2026)
Ready to unlock more insights? AirROI provides access to advanced metrics and comprehensive Airbnb data for Catalina. Explore detailed analytics beyond this report to refine your investment strategy, optimize pricing, and maximize your vacation rental profits.
Explore Advanced MetricsCatalina Short-Term Rental Market Composition (2026): Property & Room Types
Room Type Distribution
Property Type Distribution
Market Composition Insights for Catalina
- The Catalina Airbnb market composition is heavily skewed towards Entire Home/Apt listings, which make up 91.3% of the 23 active rentals. This indicates strong guest preference for privacy and space.
- Looking at the property type distribution in Catalina, House properties are the most common (47.8%), reflecting the local real estate landscape.
- Houses represent a significant 47.8% portion, catering likely to families or larger groups.
- The presence of 30.4% Hotel/Boutique listings indicates integration with traditional hospitality.
- Smaller segments like outdoor/unique (combined 4.3%) offer potential for unique stay experiences.
Catalina Airbnb Room Capacity Analysis (2026): Bedroom Distribution
Distribution of Listings by Number of Bedrooms
Room Capacity Insights for Catalina
- The dominant room capacity in Catalina is 1 bedroom listings, making up 39.1% of the market. This suggests a strong demand for properties suitable for couples or solo travelers.
- Together, 1 bedroom and 2 bedrooms properties represent 56.5% of the active Airbnb listings in Catalina, indicating a high concentration in these sizes.
- A significant 30.4% of listings offer 3+ bedrooms, catering to larger groups and families seeking more space in Catalina.
Catalina Vacation Rental Guest Capacity Trends (2026)
Distribution of Listings by Guest Capacity
Guest Capacity Insights for Catalina
- The most common guest capacity trend in Catalina vacation rentals is listings accommodating 2 guests (34.8%). This suggests the primary traveler segment is likely couples or solo travelers.
- Properties designed for 2 guests and 8+ guests dominate the Catalina STR market, accounting for 52.2% of listings.
- 34.8% of properties accommodate 6+ guests, serving the market segment for larger families or group travel in Catalina.
- On average, properties in Catalina are equipped to host 3.9 guests.
Catalina Airbnb Booking Patterns (2026): Available vs. Booked Days
Available Days Distribution
Booked Days Distribution
Booking Pattern Insights for Catalina
- The most common availability pattern in Catalina falls within the 181-270 days range, representing 56.5% of listings. This suggests many properties have significant open periods on their calendars.
- Approximately 86.9% of listings show high availability (181+ days open annually), indicating potential for increased bookings or specific owner usage patterns.
- For booked days, the 91-180 days range is most frequent in Catalina (56.5%), reflecting common guest stay durations or potential owner blocking patterns.
- A notable 13.0% of properties secure long booking periods (181+ days booked per year), highlighting successful long-term rental strategies or significant owner usage.
Catalina Airbnb Minimum Stay Requirements Analysis
Distribution of Listings by Minimum Night Requirement
1 Night
5 listings
21.7% of total
2 Nights
7 listings
30.4% of total
3 Nights
1 listings
4.3% of total
4-6 Nights
1 listings
4.3% of total
7-29 Nights
2 listings
8.7% of total
30+ Nights
7 listings
30.4% of total
Key Insights
- The most prevalent minimum stay requirement in Catalina is 2 Nights, adopted by 30.4% of listings. This highlights the market's preference for shorter, flexible bookings.
- A significant segment (30.4%) caters to monthly stays (30+ nights) in Catalina, pointing to opportunities in the extended-stay market.
Recommendations
- Align with the market by considering a 2 Nights minimum stay, as 30.4% of Catalina hosts use this setting.
- If feasible, allowing 1-night stays, especially midweek or during low season, could capture last-minute bookings, as only 21.7% currently do.
- Explore offering discounts for stays of 30+ nights to attract the 30.4% of the market seeking extended stays.
- Adjust minimum nights based on seasonality – potentially shorter during low season and longer during peak demand periods in Catalina.
Catalina Airbnb Cancellation Policy Trends Analysis (2026)
Flexible
3 listings
13% of total
Moderate
10 listings
43.5% of total
Firm
8 listings
34.8% of total
Strict
2 listings
8.7% of total
Cancellation Policy Insights for Catalina
- The prevailing Airbnb cancellation policy trend in Catalina is Moderate, used by 43.5% of listings.
- There's a relatively balanced mix between guest-friendly (56.5%) and stricter (43.5%) policies, offering choices for different guest needs.
- Strict cancellation policies are quite rare (8.7%), potentially making listings with this policy less competitive unless justified by high demand or property type.
Recommendations for Hosts
- Consider adopting a Moderate policy to align with the 43.5% market standard in Catalina.
- Using a Strict policy might deter some guests, as only 8.7% of listings use it. Evaluate if potential revenue protection outweighs possible lower booking rates.
- Regularly review your cancellation policy against competitors and market demand shifts in Catalina.
Catalina STR Booking Lead Time Analysis (2026)
Average Booking Lead Time by Month
Booking Lead Time Insights for Catalina
- The overall average booking lead time for vacation rentals in Catalina is 50 days.
- Guests book furthest in advance for stays during November (average 78 days), likely coinciding with peak travel demand or local events.
- The shortest booking windows occur for stays in July (average 18 days), indicating more last-minute travel plans during this time.
- Seasonally, Winter (60 days avg.) sees the longest lead times, while Summer (28 days avg.) has the shortest, reflecting typical travel planning cycles.
Recommendations for Hosts
- Use the overall average lead time (50 days) as a baseline for your pricing and availability strategy in Catalina.
- For November stays, consider implementing length-of-stay discounts or slightly higher rates for bookings made less than 78 days out to capitalize on advance planning.
- Target marketing efforts for the Winter season well in advance (at least 60 days) to capture early planners.
- Monitor your own booking lead times against these Catalina averages to identify opportunities for dynamic pricing adjustments.
Popular & Essential Airbnb Amenities in Catalina (2026)
Amenity Prevalence
Amenity Insights for Catalina
- Essential amenities in Catalina that guests expect include: Air conditioning, Dishes and silverware, Wifi, Heating, Free parking on premises, Shampoo, Microwave, Smoke alarm, Extra pillows and blankets, Hair dryer. Lacking these (any) could significantly impact bookings.
Recommendations for Hosts
- Ensure your listing includes all essential amenities for Catalina: Air conditioning, Dishes and silverware, Wifi, Heating, Free parking on premises, Shampoo, Microwave, Smoke alarm, Extra pillows and blankets, Hair dryer.
- Prioritize adding missing essentials: Shampoo, Microwave, Smoke alarm, Extra pillows and blankets, Hair dryer.
- Highlight unique or less common amenities you offer (e.g., hot tub, dedicated workspace, EV charger) in your listing description and photos.
- Regularly check competitor amenities in Catalina to stay competitive.
Catalina Airbnb Guest Demographics & Profile Analysis (2026)
Guest Profile Summary for Catalina
- The typical guest profile for Airbnb in Catalina consists of primarily domestic travelers (95%), often arriving from nearby Tucson, typically belonging to the Post-2000s (Gen Z/Alpha) group (50%), primarily speaking English or Spanish.
- Domestic travelers account for 94.6% of guests.
- Key international markets include United States (94.6%) and Canada (1.8%).
- Top languages spoken are English (77.9%) followed by Spanish (11.8%).
- A significant demographic segment is the Post-2000s (Gen Z/Alpha) group, representing 50% of guests.
Recommendations for Hosts
- Target domestic marketing efforts towards travelers from Tucson and Phoenix.
- Tailor amenities and listing descriptions to appeal to the dominant Post-2000s (Gen Z/Alpha) demographic (e.g., highlight fast WiFi, smart home features, local guides).
- Highlight unique local experiences or amenities relevant to the primary guest profile.
- Consider seasonal promotions aligned with peak travel times for key origin markets.
Nearby Short-Term Rental Market Comparison
How does the Catalina Airbnb market stack up against its neighbors? Compare key performance metrics like average monthly revenue, ADR, and occupancy rates in surrounding areas to understand the broader regional STR landscape.
| Market | Active Properties | Monthly Revenue | Daily Rate | Avg. Occupancy |
|---|---|---|---|---|
| Paradise Valley | 67 | $10,566 | $1242.99 | 41% |
| Scottsdale | 4,331 | $4,202 | $370.53 | 47% |
| Carefree | 31 | $4,052 | $522.63 | 39% |
| Cave Creek | 132 | $4,016 | $399.83 | 42% |
| Fountain Hills | 215 | $3,506 | $356.69 | 45% |
| Gilbert | 618 | $3,117 | $255.30 | 50% |
| Mount Lemmon | 44 | $3,071 | $256.32 | 44% |
| Chandler | 621 | $2,822 | $237.44 | 48% |
| Patagonia | 11 | $2,666 | $332.42 | 36% |
| Gold Canyon | 80 | $2,640 | $254.82 | 43% |