Cane Beds Airbnb Market Analysis 2026: Short Term Rental Data & Vacation Rental Statistics in Arizona, United States
Is Airbnb profitable in Cane Beds in 2026? Explore comprehensive Airbnb analytics for Cane Beds, Arizona, United States to uncover income potential. This 2026 STR market report for Cane Beds, based on AirROI data from February 2025 to January 2026, reveals key trends in the niche market of 25 active listings.
Whether you're considering an Airbnb investment in Cane Beds, optimizing your existing vacation rental, or exploring rental arbitrage opportunities, understanding the Cane Beds Airbnb data is crucial. Leveraging the low regulation environment is key to maximizing your short term rental income potential. Let's dive into the specifics.
Key Cane Beds Airbnb Performance Metrics Overview
Monthly Airbnb Revenue Variations & Income Potential in Cane Beds (2026)
Understanding the monthly revenue variations for Airbnb listings in Cane Beds is key to maximizing your short term rental income potential. Seasonality significantly impacts earnings. Our analysis, based on data from the past 12 months, shows that the peak revenue month for STRs in Cane Beds is typically October, while January often presents the lowest earnings, highlighting opportunities for strategic pricing adjustments during shoulder and low seasons. Explore the typical Airbnb income in Cane Beds across different performance tiers:
- Best-in-class properties (Top 10%) achieve $2,301+ monthly, often utilizing dynamic pricing and superior guest experiences.
- Strong performing properties (Top 25%) earn $1,540 or more, indicating effective management and desirable locations/amenities.
- Typical properties (Median) generate around $1,059 per month, representing the average market performance.
- Entry-level properties (Bottom 25%) see earnings around $657, often with potential for optimization.
Average Monthly Airbnb Earnings Trend in Cane Beds
Cane Beds Airbnb Occupancy Rate Trends (2026)
Maximize your bookings by understanding the Cane Beds STR occupancy trends. Seasonal demand shifts significantly influence how often properties are booked. Typically, Maysees the highest demand (peak season occupancy), while January experiences the lowest (low season). Effective strategies, like adjusting minimum stays or offering promotions, can boost occupancy during slower periods. Here's how different property tiers perform in Cane Beds:
- Best-in-class properties (Top 10%) achieve 71%+ occupancy, indicating high desirability and potentially optimized availability.
- Strong performing properties (Top 25%) maintain 58% or higher occupancy, suggesting good market fit and guest satisfaction.
- Typical properties (Median) have an occupancy rate around 38%.
- Entry-level properties (Bottom 25%) average 22% occupancy, potentially facing higher vacancy.
Average Monthly Occupancy Rate Trend in Cane Beds
Average Daily Rate (ADR) Airbnb Trends in Cane Beds (2026)
Effective short term rental pricing strategy in Cane Beds involves understanding monthly ADR fluctuations. The Average Daily Rate (ADR) for Airbnb in Cane Beds typically peaks in June and dips lowest during February. Leveraging Airbnb dynamic pricing tools or strategies based on this seasonality can significantly boost revenue. Here's a look at the typical nightly rates achieved:
- Best-in-class properties (Top 10%) command rates of $145+ per night, often due to premium features or locations.
- Strong performing properties (Top 25%) achieve nightly rates of $113 or more.
- Typical properties (Median) charge around $84 per night.
- Entry-level properties (Bottom 25%) earn around $65 per night.
Average Daily Rate (ADR) Trend by Month in Cane Beds
Get Live Cane Beds Market Intelligence 👇

Explore Real-time Analytics
Airbnb Seasonality Analysis & Trends in Cane Beds (2026)
Peak Season (October, May, March)
- Revenue averages $1,486 per month
- Occupancy rates average 49.8%
- Daily rates average $99
Shoulder Season
- Revenue averages $1,209 per month
- Occupancy maintains around 40.2%
- Daily rates hold near $98
Low Season (January, August, November)
- Revenue drops to average $896 per month
- Occupancy decreases to average 32.0%
- Daily rates adjust to average $94
Seasonality Insights for Cane Beds
- The Airbnb seasonality in Cane Beds shows highly seasonal trends requiring careful strategy. While the sections above show seasonal averages, it's also insightful to look at the extremes:
- During the high season, the absolute peak month showcases Cane Beds's highest earning potential, with monthly revenues capable of climbing to $1,632, occupancy reaching a high of 53.2%, and ADRs peaking at $108.
- Conversely, the slowest single month of the year, typically falling within the low season, marks the market's lowest point. In this month, revenue might dip to $593, occupancy could drop to 24.8%, and ADRs may adjust down to $90.
- Understanding both the seasonal averages and these monthly peaks and troughs in revenue, occupancy, and ADR is crucial for maximizing your Airbnb profit potential in Cane Beds.
Seasonal Strategies for Maximizing Profit
- Peak Season: Maximize revenue through premium pricing and potentially longer minimum stays. Ensure high availability.
- Low Season: Offer competitive pricing, special promotions (e.g., extended stay discounts), and flexible cancellation policies. Target off-season travelers like remote workers or budget-conscious guests.
- Shoulder Seasons: Implement dynamic pricing that balances peak and low rates. Target weekend travelers or specific events. Offer slightly more flexible terms than peak season.
- Regularly analyze your own performance against these Cane Beds seasonality benchmarks and adjust your pricing and availability strategy accordingly.
Best Areas for Airbnb Investment in Cane Beds (2026)
Exploring the top neighborhoods for short-term rentals in Cane Beds? This section highlights key areas, outlining why they are attractive for hosts and guests, along with notable local attractions. Consider these locations based on your target guest profile and investment strategy.
| Neighborhood / Area | Why Host Here? (Target Guests & Appeal) | Key Attractions & Landmarks |
|---|---|---|
| Cane Beds | A peaceful rural area known for its stunning natural beauty and proximity to the Grand Canyon. Ideal for travelers seeking a serene getaway, outdoor activities, and stunning landscapes. | Grand Canyon National Park, Kaibab National Forest, Vermilion Cliffs National Monument, Coyote Buttes, Havasu Falls, Antelope Canyon |
| Page | A charming city near Lake Powell, popular for water activities and breathtaking desert views. An excellent base for tourists exploring the Glen Canyon area and nearby attractions. | Lake Powell, Antelope Canyon, Horseshoe Bend, Glen Canyon Dam, Rainbow Bridge, Water sports and boat rentals |
| Williams | Known as the 'Gateway to the Grand Canyon', this historic town offers unique Route 66 attractions and easy access to the Grand Canyon, making it a prime location for Airbnb. | Bearizona, Route 66, Grand Canyon Railway, Historic Downtown Williams |
| Flagstaff | A vibrant city that serves as an outdoor playground, surrounded by mountains and forests. Popular for skiing, hiking, and cultural experiences. | Lowell Observatory, Walnut Canyon National Monument, Riordan Mansion State Historic Park, Arizona Snowbowl, Downtown Flagstaff, Coconino National Forest |
| Sedona | Famous for its red sandstone formations and stunning landscapes, Sedona attracts visitors looking for both relaxation and outdoor adventure, along with a vibrant arts community. | Cathedral Rock, Slide Rock State Park, Chapel of the Holy Cross, Sedona Red Rock State Park, Sedona Arts Center, Vortex sites |
| Cottonwood | Nestled in the Verde Valley, this town is known for its wineries and proximity to the scenic Verde River. A great spot for tourist seeking a relaxed environment and outdoor activities. | Old Town Cottonwood, Verde Valley Wine Trail, Dead Horse Ranch State Park, Blazin' M Ranch, Verde River, Outdoor recreational activities |
| Prescott | Rich in history and natural beauty, Prescott is known for its charming downtown and access to outdoor activities in the surrounding mountains. | Whiskey Row, Prescott National Forest, Watson Lake, Sharlot Hall Museum, Granite Mountain, Outdoor activities: hiking, biking |
| Kingman | Offering a glimpse into Route 66 history, Kingman is a convenient stop for travelers heading to the Grand Canyon and offers unique attractions. | Route 66 Museum, Hualapai Mountain Park, Locomotive Park, Kingman Railroad Museum, Historic downtown |
Understanding Airbnb License Requirements & STR Laws in Cane Beds (2026)
While Cane Beds, Arizona, United States currently shows low STR regulations, specific Airbnb license requirements might still exist or change. Always verify the latest short term rental regulations and Airbnb license requirements directly with local government authorities for Cane Beds to ensure full compliance before hosting.
(Source: AirROI data, 2026, finding no licensed listings among those analyzed)
Top Performing Airbnb Properties in Cane Beds (2026)
Benchmark your potential! Explore examples of top-performing Airbnb properties in Cane Bedsbased on Trailing Twelve Month (TTM) revenue. Analyze their characteristics, revenue, occupancy rate, and ADR to understand what drives success in this market.
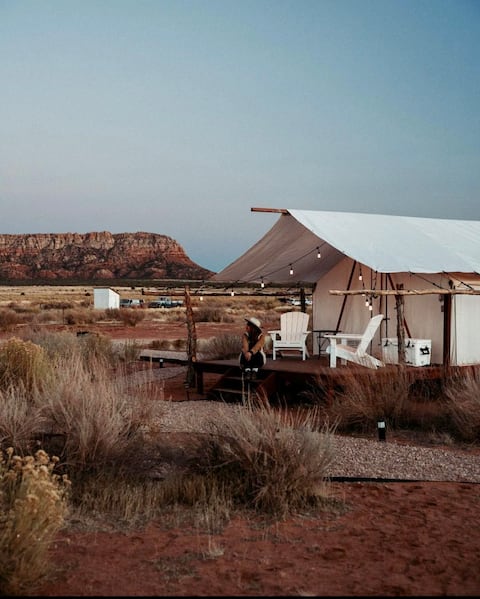
Explorer's Escape Glamping: Outdoor Shower, WiFi
Entire Place • 1 bedroom

RUSTIC LITTLE HOUSE between ZION and GRAND CANYON
Entire Place • 2 bedrooms
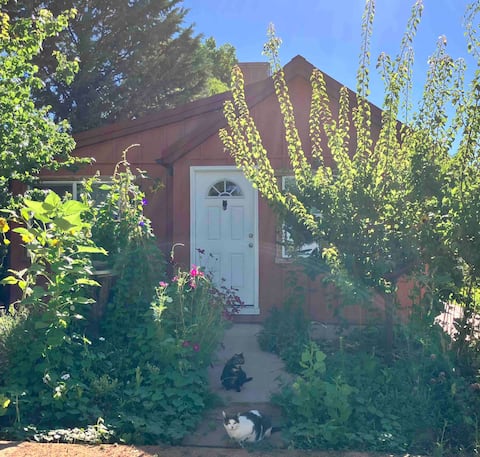
Kitty Cottage:Fast Wi-fi, Secluded, Peaceful Oasis
Entire Place • 1 bedroom
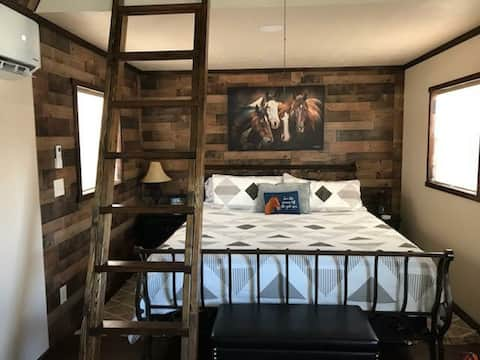
LVBar Ranch - Cabin #5-pet friendly
Entire Place • 3 bedrooms

Little Rock Cabin b/w Zion & Bryce, Canyon Views
Entire Place • 1 bedroom

LVBar Ranch Cabin #1pet friendly
Entire Place • 2 bedrooms
Note: Performance varies based on location, size, amenities, seasonality, and management quality. Data reflects the past 12 months.
Top Performing Airbnb Hosts in Cane Beds (2026)
Learn from the best! This table showcases top-performing Airbnb hosts in Cane Beds based on the number of properties managed and estimated total revenue over the past year. Analyze their scale and performance metrics.
| Host Name | Properties | Grossing Revenue | Stay Reviews | Avg Rating |
|---|---|---|---|---|
| Christina | 4 | $74,443 | 1065 | 4.94/5.0 |
| John | 6 | $67,515 | 1247 | 4.83/5.0 |
| Jeanette | 2 | $35,688 | 405 | 4.90/5.0 |
| Kelleen | 2 | $24,007 | 67 | 5.00/5.0 |
| Shanti | 6 | $23,853 | 204 | 4.94/5.0 |
| Alan | 1 | $21,609 | 234 | 4.96/5.0 |
| Lori | 1 | $14,604 | 120 | 4.93/5.0 |
| Penny | 1 | $13,728 | 137 | 4.97/5.0 |
| Rebecca | 1 | $12,463 | 383 | 4.95/5.0 |
| Lettiekay | 1 | $11,189 | 57 | 5.00/5.0 |
Analyzing the strategies of top hosts, such as their property selection, pricing, and guest communication, can offer valuable lessons for optimizing your own Airbnb operations in Cane Beds.
Dive Deeper: Advanced Cane Beds STR Market Data (2026)
Ready to unlock more insights? AirROI provides access to advanced metrics and comprehensive Airbnb data for Cane Beds. Explore detailed analytics beyond this report to refine your investment strategy, optimize pricing, and maximize your vacation rental profits.
Explore Advanced MetricsCane Beds Short-Term Rental Market Composition (2026): Property & Room Types
Room Type Distribution
Property Type Distribution
Market Composition Insights for Cane Beds
- The Cane Beds Airbnb market composition is heavily skewed towards Entire Home/Apt listings, which make up 100% of the 25 active rentals. This indicates strong guest preference for privacy and space.
- Looking at the property type distribution in Cane Beds, Outdoor/Unique properties are the most common (72%), reflecting the local real estate landscape.
- Houses represent a significant 28% portion, catering likely to families or larger groups.
Cane Beds Airbnb Room Capacity Analysis (2026): Bedroom Distribution
Distribution of Listings by Number of Bedrooms
Room Capacity Insights for Cane Beds
- The dominant room capacity in Cane Beds is 1 bedroom listings, making up 56% of the market. This suggests a strong demand for properties suitable for couples or solo travelers.
- Together, 1 bedroom and 2 bedrooms properties represent 72.0% of the active Airbnb listings in Cane Beds, indicating a high concentration in these sizes.
- With over half the market (56%) consisting of studios or 1-bedroom units, Cane Beds is particularly well-suited for individuals or couples.
Cane Beds Vacation Rental Guest Capacity Trends (2026)
Distribution of Listings by Guest Capacity
Guest Capacity Insights for Cane Beds
- The most common guest capacity trend in Cane Beds vacation rentals is listings accommodating 2 guests (40%). This suggests the primary traveler segment is likely couples or solo travelers.
- Properties designed for 2 guests and 4 guests dominate the Cane Beds STR market, accounting for 68.0% of listings.
- 12.0% of properties accommodate 6+ guests, serving the market segment for larger families or group travel in Cane Beds.
- On average, properties in Cane Beds are equipped to host 3.4 guests.
Cane Beds Airbnb Booking Patterns (2026): Available vs. Booked Days
Available Days Distribution
Booked Days Distribution
Booking Pattern Insights for Cane Beds
- The most common availability pattern in Cane Beds falls within the 181-270 days range, representing 36% of listings. This suggests many properties have significant open periods on their calendars.
- Approximately 72.0% of listings show high availability (181+ days open annually), indicating potential for increased bookings or specific owner usage patterns.
- For booked days, the 181-270 days range is most frequent in Cane Beds (32%), reflecting common guest stay durations or potential owner blocking patterns.
- A notable 32.0% of properties secure long booking periods (181+ days booked per year), highlighting successful long-term rental strategies or significant owner usage.
Cane Beds Airbnb Minimum Stay Requirements Analysis
Distribution of Listings by Minimum Night Requirement
1 Night
19 listings
76% of total
2 Nights
4 listings
16% of total
30+ Nights
2 listings
8% of total
Key Insights
- The most prevalent minimum stay requirement in Cane Beds is 1 Night, adopted by 76% of listings. This highlights the market's preference for shorter, flexible bookings.
- A strong majority (92.0%) of the Cane Beds Airbnb data shows acceptance of very short stays (1-2 nights), indicating a dynamic, high-turnover market.
Recommendations
- Align with the market by considering a 1 Night minimum stay, as 76% of Cane Beds hosts use this setting.
- Explore offering discounts for stays of 30+ nights to attract the 8% of the market seeking extended stays.
- Adjust minimum nights based on seasonality – potentially shorter during low season and longer during peak demand periods in Cane Beds.
Cane Beds Airbnb Cancellation Policy Trends Analysis (2026)
Flexible
3 listings
12% of total
Moderate
2 listings
8% of total
Firm
19 listings
76% of total
Strict
1 listings
4% of total
Cancellation Policy Insights for Cane Beds
- The prevailing Airbnb cancellation policy trend in Cane Beds is Firm, used by 76% of listings.
- A majority (80.0%) of hosts in Cane Beds utilize Firm or Strict policies, indicating a market where hosts prioritize booking security.
- Strict cancellation policies are quite rare (4%), potentially making listings with this policy less competitive unless justified by high demand or property type.
Recommendations for Hosts
- Consider adopting a Firm policy to align with the 76% market standard in Cane Beds.
- Using a Strict policy might deter some guests, as only 4% of listings use it. Evaluate if potential revenue protection outweighs possible lower booking rates.
- Regularly review your cancellation policy against competitors and market demand shifts in Cane Beds.
Cane Beds STR Booking Lead Time Analysis (2026)
Average Booking Lead Time by Month
Booking Lead Time Insights for Cane Beds
- The overall average booking lead time for vacation rentals in Cane Beds is 39 days.
- Guests book furthest in advance for stays during September (average 59 days), likely coinciding with peak travel demand or local events.
- The shortest booking windows occur for stays in January (average 13 days), indicating more last-minute travel plans during this time.
- Seasonally, Fall (43 days avg.) sees the longest lead times, while Winter (32 days avg.) has the shortest, reflecting typical travel planning cycles.
Recommendations for Hosts
- Use the overall average lead time (39 days) as a baseline for your pricing and availability strategy in Cane Beds.
- For September stays, consider implementing length-of-stay discounts or slightly higher rates for bookings made less than 59 days out to capitalize on advance planning.
- During January, focus on last-minute booking availability and promotions, as guests book with very short notice (13 days avg.).
- Target marketing efforts for the Fall season well in advance (at least 43 days) to capture early planners.
- Monitor your own booking lead times against these Cane Beds averages to identify opportunities for dynamic pricing adjustments.
Popular & Essential Airbnb Amenities in Cane Beds (2026)
Amenity Prevalence
Amenity Insights for Cane Beds
- Essential amenities in Cane Beds that guests expect include: Pets allowed, Fire extinguisher, Free parking on premises. Lacking these (any) could significantly impact bookings.
- Popular amenities like Smoke alarm, Hot water, Kitchen are common but not universal. Offering these can provide a competitive edge.
Recommendations for Hosts
- Ensure your listing includes all essential amenities for Cane Beds: Pets allowed, Fire extinguisher, Free parking on premises.
- Prioritize adding missing essentials: Free parking on premises.
- Consider adding popular differentiators like Smoke alarm or Hot water to increase appeal.
- Highlight unique or less common amenities you offer (e.g., hot tub, dedicated workspace, EV charger) in your listing description and photos.
- Regularly check competitor amenities in Cane Beds to stay competitive.
Cane Beds Airbnb Guest Demographics & Profile Analysis (2026)
Guest Profile Summary for Cane Beds
- The typical guest profile for Airbnb in Cane Beds consists of primarily domestic travelers (88%), often arriving from nearby Las Vegas, typically belonging to the Post-2000s (Gen Z/Alpha) group (50%), primarily speaking English or Spanish.
- Domestic travelers account for 87.6% of guests.
- Key international markets include United States (87.6%) and Canada (2.4%).
- Top languages spoken are English (65.9%) followed by Spanish (17.1%).
- A significant demographic segment is the Post-2000s (Gen Z/Alpha) group, representing 50% of guests.
Recommendations for Hosts
- Target domestic marketing efforts towards travelers from Las Vegas and San Diego.
- Tailor amenities and listing descriptions to appeal to the dominant Post-2000s (Gen Z/Alpha) demographic (e.g., highlight fast WiFi, smart home features, local guides).
- Highlight unique local experiences or amenities relevant to the primary guest profile.
- Consider seasonal promotions aligned with peak travel times for key origin markets.
Nearby Short-Term Rental Market Comparison
How does the Cane Beds Airbnb market stack up against its neighbors? Compare key performance metrics like average monthly revenue, ADR, and occupancy rates in surrounding areas to understand the broader regional STR landscape.
| Market | Active Properties | Monthly Revenue | Daily Rate | Avg. Occupancy |
|---|---|---|---|---|
| Springdale | 135 | $5,417 | $457.31 | 46% |
| Fort Valley | 38 | $4,747 | $408.22 | 43% |
| Rockville | 22 | $4,535 | $488.30 | 33% |
| Doney Park | 17 | $4,085 | $299.83 | 54% |
| Red Lake | 12 | $3,899 | $257.65 | 54% |
| Hurricane | 730 | $3,797 | $329.21 | 45% |
| Santa Clara | 279 | $3,789 | $427.47 | 36% |
| Kachina Village | 138 | $3,786 | $252.87 | 50% |
| Greenehaven | 48 | $3,740 | $333.15 | 44% |
| Flagstaff | 1,391 | $3,353 | $281.58 | 47% |