Bisbee Airbnb Market Analysis 2026: Short Term Rental Data & Vacation Rental Statistics in Arizona, United States
Is Airbnb profitable in Bisbee in 2026? Explore comprehensive Airbnb analytics for Bisbee, Arizona, United States to uncover income potential. This 2026 STR market report for Bisbee, based on AirROI data from February 2025 to January 2026, reveals key trends in the niche market of 197 active listings.
Whether you're considering an Airbnb investment in Bisbee, optimizing your existing vacation rental, or exploring rental arbitrage opportunities, understanding the Bisbee Airbnb data is crucial. Leveraging the low regulation environment is key to maximizing your short term rental income potential. Let's dive into the specifics.
Key Bisbee Airbnb Performance Metrics Overview
Monthly Airbnb Revenue Variations & Income Potential in Bisbee (2026)
Understanding the monthly revenue variations for Airbnb listings in Bisbee is key to maximizing your short term rental income potential. Seasonality significantly impacts earnings. Our analysis, based on data from the past 12 months, shows that the peak revenue month for STRs in Bisbee is typically March, while June often presents the lowest earnings, highlighting opportunities for strategic pricing adjustments during shoulder and low seasons. Explore the typical Airbnb income in Bisbee across different performance tiers:
- Best-in-class properties (Top 10%) achieve $3,508+ monthly, often utilizing dynamic pricing and superior guest experiences.
- Strong performing properties (Top 25%) earn $2,369 or more, indicating effective management and desirable locations/amenities.
- Typical properties (Median) generate around $1,423 per month, representing the average market performance.
- Entry-level properties (Bottom 25%) see earnings around $721, often with potential for optimization.
Average Monthly Airbnb Earnings Trend in Bisbee
Bisbee Airbnb Occupancy Rate Trends (2026)
Maximize your bookings by understanding the Bisbee STR occupancy trends. Seasonal demand shifts significantly influence how often properties are booked. Typically, Februarysees the highest demand (peak season occupancy), while September experiences the lowest (low season). Effective strategies, like adjusting minimum stays or offering promotions, can boost occupancy during slower periods. Here's how different property tiers perform in Bisbee:
- Best-in-class properties (Top 10%) achieve 67%+ occupancy, indicating high desirability and potentially optimized availability.
- Strong performing properties (Top 25%) maintain 50% or higher occupancy, suggesting good market fit and guest satisfaction.
- Typical properties (Median) have an occupancy rate around 32%.
- Entry-level properties (Bottom 25%) average 17% occupancy, potentially facing higher vacancy.
Average Monthly Occupancy Rate Trend in Bisbee
Average Daily Rate (ADR) Airbnb Trends in Bisbee (2026)
Effective short term rental pricing strategy in Bisbee involves understanding monthly ADR fluctuations. The Average Daily Rate (ADR) for Airbnb in Bisbee typically peaks in June and dips lowest during September. Leveraging Airbnb dynamic pricing tools or strategies based on this seasonality can significantly boost revenue. Here's a look at the typical nightly rates achieved:
- Best-in-class properties (Top 10%) command rates of $233+ per night, often due to premium features or locations.
- Strong performing properties (Top 25%) achieve nightly rates of $183 or more.
- Typical properties (Median) charge around $143 per night.
- Entry-level properties (Bottom 25%) earn around $109 per night.
Average Daily Rate (ADR) Trend by Month in Bisbee
Get Live Bisbee Market Intelligence 👇

Explore Real-time Analytics
Airbnb Seasonality Analysis & Trends in Bisbee (2026)
Peak Season (March, February, October)
- Revenue averages $2,228 per month
- Occupancy rates average 44.7%
- Daily rates average $164
Shoulder Season
- Revenue averages $1,735 per month
- Occupancy maintains around 34.5%
- Daily rates hold near $162
Low Season (June, July, September)
- Revenue drops to average $1,335 per month
- Occupancy decreases to average 27.7%
- Daily rates adjust to average $161
Seasonality Insights for Bisbee
- The Airbnb seasonality in Bisbee shows moderate seasonality with distinct peak and low periods. While the sections above show seasonal averages, it's also insightful to look at the extremes:
- During the high season, the absolute peak month showcases Bisbee's highest earning potential, with monthly revenues capable of climbing to $2,436, occupancy reaching a high of 50.3%, and ADRs peaking at $167.
- Conversely, the slowest single month of the year, typically falling within the low season, marks the market's lowest point. In this month, revenue might dip to $1,302, occupancy could drop to 26.5%, and ADRs may adjust down to $156.
- Understanding both the seasonal averages and these monthly peaks and troughs in revenue, occupancy, and ADR is crucial for maximizing your Airbnb profit potential in Bisbee.
Seasonal Strategies for Maximizing Profit
- Peak Season: Maximize revenue through premium pricing and potentially longer minimum stays. Ensure high availability.
- Low Season: Offer competitive pricing, special promotions (e.g., extended stay discounts), and flexible cancellation policies. Target off-season travelers like remote workers or budget-conscious guests.
- Shoulder Seasons: Implement dynamic pricing that balances peak and low rates. Target weekend travelers or specific events. Offer slightly more flexible terms than peak season.
- Regularly analyze your own performance against these Bisbee seasonality benchmarks and adjust your pricing and availability strategy accordingly.
Best Areas for Airbnb Investment in Bisbee (2026)
Exploring the top neighborhoods for short-term rentals in Bisbee? This section highlights key areas, outlining why they are attractive for hosts and guests, along with notable local attractions. Consider these locations based on your target guest profile and investment strategy.
| Neighborhood / Area | Why Host Here? (Target Guests & Appeal) | Key Attractions & Landmarks |
|---|---|---|
| Historic District | The heart of Bisbee, known for its charming architecture and rich history. It's a prime location for those seeking to explore the old mining town's culture and community. | Bisbee Mining & Historical Museum, Copper Queen Mine, Old Bisbee Ghost Tour, Bisbee's Historic District, The Bisbee Royale Theater |
| Lowell | A historic area of Bisbee that offers a glimpse into the town's mining past. It's popular among visitors interested in local history and culture. | The Shady Dell Trailer Park, Lowell Observatory, The Sultana Bar, Historic Lowell Avenue, Old Mine Tours |
| Naco Highway | Easy access to the surrounding areas and close to main attractions, it attracts visitors interested in both history and outdoor adventures. | Bisbee Seance Room, San Jose Road, Nearby hiking trails, Restaurants and shops, Historical landmarks |
| Warren | This up-and-coming area is known for its artisanal shops and eateries, making it a trendy spot for tourists and locals alike. | Warren Ballpark, The Warren Church, Local Craft Shops, Outdoor Art Installations, Restaurants and cafes |
| Southwestern Bisbee | Offers stunning views and a more residential feel, appealing to visitors looking for a peaceful retreat within the artistic town. | Nature trails, Scenic overlooks, Art installations, Local wildlife, Quaint coffee shops |
| Bisbee's Arts District | A vibrant area that showcases local artists and galleries, attracting art enthusiasts and those looking to engage with the creative community. | Local art galleries, Community art projects, Art walks, Craft markets, Live music venues |
| The Brewery Gulch | Known for its historic buildings and nightlife, this area is perfect for travelers looking to experience Bisbee's bustling social scene. | Local breweries, Music venues, Historic saloons, Nightlife, Culinary experiences |
| The Lavender Pit | An iconic historical site outside of Bisbee, great for outdoor activities and those interested in mining history and geology. | Lavender Pit overlook, Mining tours, Nature walks, Photography opportunities, Scenic picnics |
Understanding Airbnb License Requirements & STR Laws in Bisbee (2026)
While Bisbee, Arizona, United States currently shows low STR regulations, specific Airbnb license requirements might still exist or change. Always verify the latest short term rental regulations and Airbnb license requirements directly with local government authorities for Bisbee to ensure full compliance before hosting.
(Source: AirROI data, 2026, finding no licensed listings among those analyzed)
Top Performing Airbnb Properties in Bisbee (2026)
Benchmark your potential! Explore examples of top-performing Airbnb properties in Bisbeebased on Trailing Twelve Month (TTM) revenue. Analyze their characteristics, revenue, occupancy rate, and ADR to understand what drives success in this market.
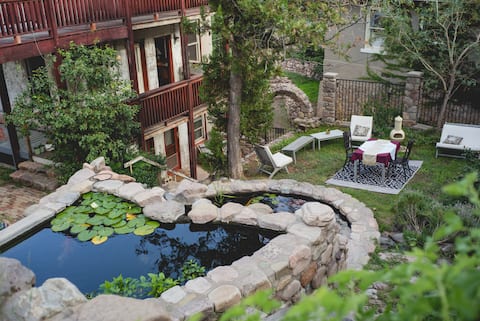
6 BR in Old Bisbee with Giant Koi Ponds and Garden
Entire Place • 6 bedrooms
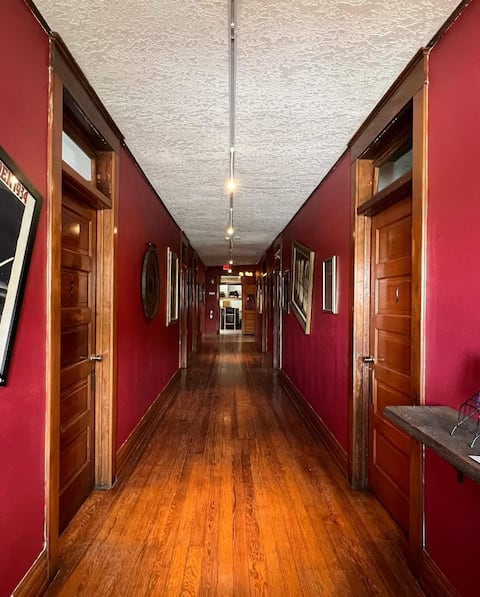
The Oliver House Hotel - Entire Hotel, 13 Rooms
Private Room • 13 bedrooms
Architectural Wonder in Heart of Old Bisbee!
Entire Place • 4 bedrooms

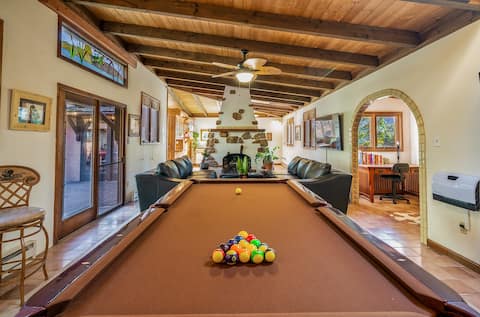
Copper Queen Retreat in Bisbee - With Hot Tub!
Entire Place • 3 bedrooms

Hacienda del Avion
Entire Place • 5 bedrooms

Minerva's Rest is a beautiful house in Old Bisbee
Entire Place • 2 bedrooms
Note: Performance varies based on location, size, amenities, seasonality, and management quality. Data reflects the past 12 months.
Top Performing Airbnb Hosts in Bisbee (2026)
Learn from the best! This table showcases top-performing Airbnb hosts in Bisbee based on the number of properties managed and estimated total revenue over the past year. Analyze their scale and performance metrics.
| Host Name | Properties | Grossing Revenue | Stay Reviews | Avg Rating |
|---|---|---|---|---|
| Cole | 11 | $172,079 | 85 | 4.94/5.0 |
| Gretchen | 9 | $140,920 | 168 | 4.81/5.0 |
| Jennifer | 3 | $128,937 | 792 | 4.93/5.0 |
| Esther | 2 | $97,637 | 253 | 4.97/5.0 |
| Rachel | 9 | $92,553 | 1227 | 4.89/5.0 |
| Evolve | 7 | $90,910 | 321 | 4.64/5.0 |
| Dan | 3 | $81,073 | 2137 | 4.94/5.0 |
| Steve And Donna | 2 | $77,830 | 529 | 4.97/5.0 |
| Amy | 1 | $73,160 | 5 | 5.00/5.0 |
| Travis | 1 | $63,248 | 237 | 4.86/5.0 |
Analyzing the strategies of top hosts, such as their property selection, pricing, and guest communication, can offer valuable lessons for optimizing your own Airbnb operations in Bisbee.
Dive Deeper: Advanced Bisbee STR Market Data (2026)
Ready to unlock more insights? AirROI provides access to advanced metrics and comprehensive Airbnb data for Bisbee. Explore detailed analytics beyond this report to refine your investment strategy, optimize pricing, and maximize your vacation rental profits.
Explore Advanced MetricsBisbee Short-Term Rental Market Composition (2026): Property & Room Types
Room Type Distribution
Property Type Distribution
Market Composition Insights for Bisbee
- The Bisbee Airbnb market composition is heavily skewed towards Entire Home/Apt listings, which make up 70.6% of the 197 active rentals. This indicates strong guest preference for privacy and space.
- Looking at the property type distribution in Bisbee, House properties are the most common (47.7%), reflecting the local real estate landscape.
- Houses represent a significant 47.7% portion, catering likely to families or larger groups.
- The presence of 20.8% Hotel/Boutique listings indicates integration with traditional hospitality.
- Smaller segments like outdoor/unique, unique stays (combined 2.5%) offer potential for unique stay experiences.
Bisbee Airbnb Room Capacity Analysis (2026): Bedroom Distribution
Distribution of Listings by Number of Bedrooms
Room Capacity Insights for Bisbee
- The dominant room capacity in Bisbee is 1 bedroom listings, making up 48.2% of the market. This suggests a strong demand for properties suitable for couples or solo travelers.
- Together, 1 bedroom and 2 bedrooms properties represent 77.1% of the active Airbnb listings in Bisbee, indicating a high concentration in these sizes.
- Listings with 3+ bedrooms (8.6%) represent a smaller niche, potentially indicating an underserved market for larger group accommodations in Bisbee.
Bisbee Vacation Rental Guest Capacity Trends (2026)
Distribution of Listings by Guest Capacity
Guest Capacity Insights for Bisbee
- The most common guest capacity trend in Bisbee vacation rentals is listings accommodating 2 guests (33%). This suggests the primary traveler segment is likely couples or solo travelers.
- Properties designed for 2 guests and 4 guests dominate the Bisbee STR market, accounting for 65.0% of listings.
- 12.7% of properties accommodate 6+ guests, serving the market segment for larger families or group travel in Bisbee.
- On average, properties in Bisbee are equipped to host 3.3 guests.
Bisbee Airbnb Booking Patterns (2026): Available vs. Booked Days
Available Days Distribution
Booked Days Distribution
Booking Pattern Insights for Bisbee
- The most common availability pattern in Bisbee falls within the 271-366 days range, representing 45.2% of listings. This suggests many properties have significant open periods on their calendars.
- Approximately 83.8% of listings show high availability (181+ days open annually), indicating potential for increased bookings or specific owner usage patterns.
- For booked days, the 91-180 days range is most frequent in Bisbee (40.1%), reflecting common guest stay durations or potential owner blocking patterns.
- A notable 17.8% of properties secure long booking periods (181+ days booked per year), highlighting successful long-term rental strategies or significant owner usage.
Bisbee Airbnb Minimum Stay Requirements Analysis
Distribution of Listings by Minimum Night Requirement
1 Night
86 listings
43.7% of total
2 Nights
61 listings
31% of total
4-6 Nights
2 listings
1% of total
7-29 Nights
1 listings
0.5% of total
30+ Nights
47 listings
23.9% of total
Key Insights
- The most prevalent minimum stay requirement in Bisbee is 1 Night, adopted by 43.7% of listings. This highlights the market's preference for shorter, flexible bookings.
- A strong majority (74.7%) of the Bisbee Airbnb data shows acceptance of very short stays (1-2 nights), indicating a dynamic, high-turnover market.
- A significant segment (23.9%) caters to monthly stays (30+ nights) in Bisbee, pointing to opportunities in the extended-stay market.
Recommendations
- Align with the market by considering a 1 Night minimum stay, as 43.7% of Bisbee hosts use this setting.
- Explore offering discounts for stays of 30+ nights to attract the 23.9% of the market seeking extended stays.
- Adjust minimum nights based on seasonality – potentially shorter during low season and longer during peak demand periods in Bisbee.
Bisbee Airbnb Cancellation Policy Trends Analysis (2026)
Limited
1 listings
0.5% of total
Flexible
38 listings
19.5% of total
Moderate
76 listings
39% of total
Firm
63 listings
32.3% of total
Strict
17 listings
8.7% of total
Cancellation Policy Insights for Bisbee
- The prevailing Airbnb cancellation policy trend in Bisbee is Moderate, used by 39% of listings.
- There's a relatively balanced mix between guest-friendly (58.5%) and stricter (41.0%) policies, offering choices for different guest needs.
- Strict cancellation policies are quite rare (8.7%), potentially making listings with this policy less competitive unless justified by high demand or property type.
Recommendations for Hosts
- Consider adopting a Moderate policy to align with the 39% market standard in Bisbee.
- Using a Strict policy might deter some guests, as only 8.7% of listings use it. Evaluate if potential revenue protection outweighs possible lower booking rates.
- Regularly review your cancellation policy against competitors and market demand shifts in Bisbee.
Bisbee STR Booking Lead Time Analysis (2026)
Average Booking Lead Time by Month
Booking Lead Time Insights for Bisbee
- The overall average booking lead time for vacation rentals in Bisbee is 50 days.
- Guests book furthest in advance for stays during October (average 83 days), likely coinciding with peak travel demand or local events.
- The shortest booking windows occur for stays in January (average 29 days), indicating more last-minute travel plans during this time.
- Seasonally, Fall (69 days avg.) sees the longest lead times, while Winter (32 days avg.) has the shortest, reflecting typical travel planning cycles.
Recommendations for Hosts
- Use the overall average lead time (50 days) as a baseline for your pricing and availability strategy in Bisbee.
- For October stays, consider implementing length-of-stay discounts or slightly higher rates for bookings made less than 83 days out to capitalize on advance planning.
- Target marketing efforts for the Fall season well in advance (at least 69 days) to capture early planners.
- Monitor your own booking lead times against these Bisbee averages to identify opportunities for dynamic pricing adjustments.
Popular & Essential Airbnb Amenities in Bisbee (2026)
Amenity Prevalence
Amenity Insights for Bisbee
- Essential amenities in Bisbee that guests expect include: Heating, Wifi. Lacking these (any) could significantly impact bookings.
- Popular amenities like Smoke alarm, Air conditioning, Essentials are common but not universal. Offering these can provide a competitive edge.
Recommendations for Hosts
- Ensure your listing includes all essential amenities for Bisbee: Heating, Wifi.
- Prioritize adding missing essentials: Heating, Wifi.
- Consider adding popular differentiators like Smoke alarm or Air conditioning to increase appeal.
- Highlight unique or less common amenities you offer (e.g., hot tub, dedicated workspace, EV charger) in your listing description and photos.
- Regularly check competitor amenities in Bisbee to stay competitive.
Bisbee Airbnb Guest Demographics & Profile Analysis (2026)
Guest Profile Summary for Bisbee
- The typical guest profile for Airbnb in Bisbee consists of primarily domestic travelers (98%), often arriving from nearby Tucson, typically belonging to the Post-2000s (Gen Z/Alpha) group (50%), primarily speaking English or Spanish.
- Domestic travelers account for 97.5% of guests.
- Key international markets include United States (97.5%) and Canada (0.6%).
- Top languages spoken are English (70.8%) followed by Spanish (16.9%).
- A significant demographic segment is the Post-2000s (Gen Z/Alpha) group, representing 50% of guests.
Recommendations for Hosts
- Target domestic marketing efforts towards travelers from Tucson and Phoenix.
- Tailor amenities and listing descriptions to appeal to the dominant Post-2000s (Gen Z/Alpha) demographic (e.g., highlight fast WiFi, smart home features, local guides).
- Highlight unique local experiences or amenities relevant to the primary guest profile.
- Consider seasonal promotions aligned with peak travel times for key origin markets.
Nearby Short-Term Rental Market Comparison
How does the Bisbee Airbnb market stack up against its neighbors? Compare key performance metrics like average monthly revenue, ADR, and occupancy rates in surrounding areas to understand the broader regional STR landscape.
| Market | Active Properties | Monthly Revenue | Daily Rate | Avg. Occupancy |
|---|---|---|---|---|
| Mount Lemmon | 44 | $3,071 | $256.32 | 44% |
| Patagonia | 11 | $2,666 | $332.42 | 36% |
| Corona de Tucson | 16 | $2,248 | $183.94 | 50% |
| Oro Valley | 249 | $2,189 | $223.37 | 43% |
| Mimbres | 10 | $2,009 | $134.14 | 52% |
| Tucson | 3,835 | $1,925 | $185.25 | 45% |
| Sahuarita | 41 | $1,910 | $178.60 | 45% |
| Elgin | 19 | $1,847 | $217.17 | 34% |
| Vail | 21 | $1,830 | $213.33 | 44% |
| Sierra Vista | 145 | $1,812 | $145.88 | 49% |