Bellemont Airbnb Market Analysis 2026: Short Term Rental Data & Vacation Rental Statistics in Arizona, United States
Is Airbnb profitable in Bellemont in 2026? Explore comprehensive Airbnb analytics for Bellemont, Arizona, United States to uncover income potential. This 2026 STR market report for Bellemont, based on AirROI data from February 2025 to January 2026, reveals key trends in the niche market of 27 active listings.
Whether you're considering an Airbnb investment in Bellemont, optimizing your existing vacation rental, or exploring rental arbitrage opportunities, understanding the Bellemont Airbnb data is crucial. Leveraging the low regulation environment is key to maximizing your short term rental income potential. Let's dive into the specifics.
Key Bellemont Airbnb Performance Metrics Overview
Monthly Airbnb Revenue Variations & Income Potential in Bellemont (2026)
Understanding the monthly revenue variations for Airbnb listings in Bellemont is key to maximizing your short term rental income potential. Seasonality significantly impacts earnings. Our analysis, based on data from the past 12 months, shows that the peak revenue month for STRs in Bellemont is typically December, while April often presents the lowest earnings, highlighting opportunities for strategic pricing adjustments during shoulder and low seasons. Explore the typical Airbnb income in Bellemont across different performance tiers:
- Best-in-class properties (Top 10%) achieve $7,162+ monthly, often utilizing dynamic pricing and superior guest experiences.
- Strong performing properties (Top 25%) earn $4,692 or more, indicating effective management and desirable locations/amenities.
- Typical properties (Median) generate around $2,837 per month, representing the average market performance.
- Entry-level properties (Bottom 25%) see earnings around $1,406, often with potential for optimization.
Average Monthly Airbnb Earnings Trend in Bellemont
Bellemont Airbnb Occupancy Rate Trends (2026)
Maximize your bookings by understanding the Bellemont STR occupancy trends. Seasonal demand shifts significantly influence how often properties are booked. Typically, Marchsees the highest demand (peak season occupancy), while January experiences the lowest (low season). Effective strategies, like adjusting minimum stays or offering promotions, can boost occupancy during slower periods. Here's how different property tiers perform in Bellemont:
- Best-in-class properties (Top 10%) achieve 76%+ occupancy, indicating high desirability and potentially optimized availability.
- Strong performing properties (Top 25%) maintain 54% or higher occupancy, suggesting good market fit and guest satisfaction.
- Typical properties (Median) have an occupancy rate around 33%.
- Entry-level properties (Bottom 25%) average 19% occupancy, potentially facing higher vacancy.
Average Monthly Occupancy Rate Trend in Bellemont
Average Daily Rate (ADR) Airbnb Trends in Bellemont (2026)
Effective short term rental pricing strategy in Bellemont involves understanding monthly ADR fluctuations. The Average Daily Rate (ADR) for Airbnb in Bellemont typically peaks in December and dips lowest during April. Leveraging Airbnb dynamic pricing tools or strategies based on this seasonality can significantly boost revenue. Here's a look at the typical nightly rates achieved:
- Best-in-class properties (Top 10%) command rates of $400+ per night, often due to premium features or locations.
- Strong performing properties (Top 25%) achieve nightly rates of $324 or more.
- Typical properties (Median) charge around $266 per night.
- Entry-level properties (Bottom 25%) earn around $216 per night.
Average Daily Rate (ADR) Trend by Month in Bellemont
Get Live Bellemont Market Intelligence 👇

Explore Real-time Analytics
Airbnb Seasonality Analysis & Trends in Bellemont (2026)
Peak Season (December, July, August)
- Revenue averages $4,500 per month
- Occupancy rates average 41.1%
- Daily rates average $294
Shoulder Season
- Revenue averages $3,455 per month
- Occupancy maintains around 40.3%
- Daily rates hold near $284
Low Season (January, February, April)
- Revenue drops to average $2,419 per month
- Occupancy decreases to average 32.0%
- Daily rates adjust to average $274
Seasonality Insights for Bellemont
- The Airbnb seasonality in Bellemont shows highly seasonal trends requiring careful strategy. While the sections above show seasonal averages, it's also insightful to look at the extremes:
- During the high season, the absolute peak month showcases Bellemont's highest earning potential, with monthly revenues capable of climbing to $5,066, occupancy reaching a high of 56.6%, and ADRs peaking at $340.
- Conversely, the slowest single month of the year, typically falling within the low season, marks the market's lowest point. In this month, revenue might dip to $2,227, occupancy could drop to 22.8%, and ADRs may adjust down to $247.
- Understanding both the seasonal averages and these monthly peaks and troughs in revenue, occupancy, and ADR is crucial for maximizing your Airbnb profit potential in Bellemont.
Seasonal Strategies for Maximizing Profit
- Peak Season: Maximize revenue through premium pricing and potentially longer minimum stays. Ensure high availability.
- Low Season: Offer competitive pricing, special promotions (e.g., extended stay discounts), and flexible cancellation policies. Target off-season travelers like remote workers or budget-conscious guests.
- Shoulder Seasons: Implement dynamic pricing that balances peak and low rates. Target weekend travelers or specific events. Offer slightly more flexible terms than peak season.
- Regularly analyze your own performance against these Bellemont seasonality benchmarks and adjust your pricing and availability strategy accordingly.
Best Areas for Airbnb Investment in Bellemont (2026)
Exploring the top neighborhoods for short-term rentals in Bellemont? This section highlights key areas, outlining why they are attractive for hosts and guests, along with notable local attractions. Consider these locations based on your target guest profile and investment strategy.
| Neighborhood / Area | Why Host Here? (Target Guests & Appeal) | Key Attractions & Landmarks |
|---|---|---|
| Sleepy Hollow | A serene neighborhood ideal for families and groups looking for a peaceful getaway. Close to outdoor adventures and the natural beauty of the surrounding forests. | Coconino National Forest, Prescott National Forest, Camp Navajo, Flagstaff Extreme Adventure Course |
| Bellemont Township | A quiet township that offers easy access to both Flagstaff and nearby attractions, perfect for guests wanting a rural experience while still being close to city amenities. | Walnut Canyon National Monument, Lowell Observatory, Historic Route 66, Northern Arizona University |
| Grand Canyon Junction | Just a short drive to the Grand Canyon, this location attracts visitors looking to explore one of the natural wonders of the world. Ideal for outdoor enthusiasts. | Grand Canyon National Park, Mather Point, South Rim Trail, Desert View Drive, Grand Canyon Village |
| Williams | Known as the 'Gateway to the Grand Canyon,' this historic town is popular with tourists seeking charm, Route 66 nostalgia, and easy access to outdoor activities. | Grand Canyon Railway, Bearizona Wildlife Park, Route 66 Historic District, Bearizona Drive-Thru |
| Flagstaff Downtown | A vibrant area with shops, restaurants, and the lively atmosphere of a college town. Attracts young travelers and those seeking a cultural experience. | Downtown Flagstaff, Lowell Observatory, Historic Route 66, Museum of Northern Arizona, Riordan Mansion State Historic Park |
| Coconino County | For those seeking a more rural and expansive option, this area offers diverse landscapes and numerous outdoor recreational opportunities for nature lovers. | Coconino National Forest, Oak Creek Canyon, Boulder Canyon, Sedona |
| Munds Park | A quaint mountain community ideal for vacationers looking for tranquility and nature without being far from urban amenities. | Pinewood Country Club, Munds Park Community, Coconino National Forest |
| Sedona | While slightly further away, Sedona is famous for its stunning red rock formations and vibrant arts scene, attracting travelers from all over the world. | Red Rock State Park, Cathedral Rock, Chapel of the Holy Cross, Sedona Arts Center |
Understanding Airbnb License Requirements & STR Laws in Bellemont (2026)
While Bellemont, Arizona, United States currently shows low STR regulations, specific Airbnb license requirements might still exist or change. Always verify the latest short term rental regulations and Airbnb license requirements directly with local government authorities for Bellemont to ensure full compliance before hosting.
(Source: AirROI data, 2026, finding no licensed listings among those analyzed)
Top Performing Airbnb Properties in Bellemont (2026)
Benchmark your potential! Explore examples of top-performing Airbnb properties in Bellemontbased on Trailing Twelve Month (TTM) revenue. Analyze their characteristics, revenue, occupancy rate, and ADR to understand what drives success in this market.

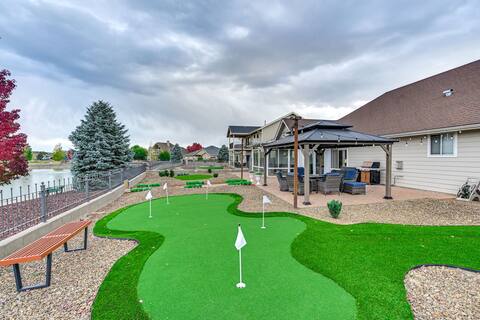
Family Time in the Pines: Home Near AZ Attractions
Entire Place • 4 bedrooms

Spring Valley Retreat | 5 Cabins| Sleeps 24
Entire Place • 10 bedrooms
Spacious Bellemont Cabin w/ Jacuzzi + Mtn View!
Entire Place • 5 bedrooms
Mountain Retreat | Close to NAU & Snowbowl
Entire Place • 5 bedrooms

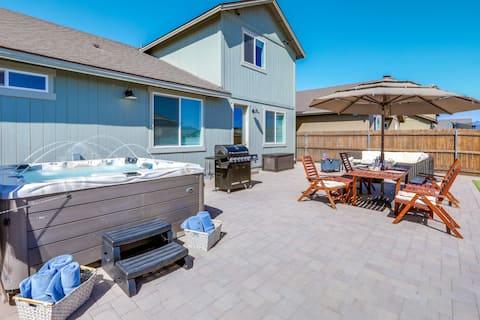
Bellemont Family Home w/ Hot Tub & Playground Set
Entire Place • 3 bedrooms
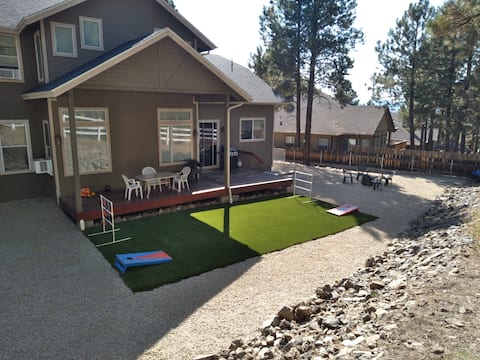
12 Mi to Flagstaff: Pet-Friendly Home w/ Sunroom!
Entire Place • 3 bedrooms
Note: Performance varies based on location, size, amenities, seasonality, and management quality. Data reflects the past 12 months.
Top Performing Airbnb Hosts in Bellemont (2026)
Learn from the best! This table showcases top-performing Airbnb hosts in Bellemont based on the number of properties managed and estimated total revenue over the past year. Analyze their scale and performance metrics.
| Host Name | Properties | Grossing Revenue | Stay Reviews | Avg Rating |
|---|---|---|---|---|
| Evolve | 4 | $134,229 | 128 | 4.91/5.0 |
| Evolve | 3 | $122,964 | 211 | 4.81/5.0 |
| Porter | 2 | $111,387 | 89 | 4.90/5.0 |
| Village Camp | 8 | $72,118 | 42 | 4.38/5.0 |
| Jennifer | 1 | $70,785 | 114 | 4.99/5.0 |
| John | 1 | $62,187 | 103 | 4.89/5.0 |
| Sam | 1 | $57,683 | 127 | 4.90/5.0 |
| Emmanuel | 1 | $49,367 | 41 | 4.95/5.0 |
| Travis | 1 | $28,176 | 48 | 4.94/5.0 |
| Renee | 1 | $27,954 | 125 | 4.94/5.0 |
Analyzing the strategies of top hosts, such as their property selection, pricing, and guest communication, can offer valuable lessons for optimizing your own Airbnb operations in Bellemont.
Dive Deeper: Advanced Bellemont STR Market Data (2026)
Ready to unlock more insights? AirROI provides access to advanced metrics and comprehensive Airbnb data for Bellemont. Explore detailed analytics beyond this report to refine your investment strategy, optimize pricing, and maximize your vacation rental profits.
Explore Advanced MetricsBellemont Short-Term Rental Market Composition (2026): Property & Room Types
Room Type Distribution
Property Type Distribution
Market Composition Insights for Bellemont
- The Bellemont Airbnb market composition is heavily skewed towards Entire Home/Apt listings, which make up 96.3% of the 27 active rentals. This indicates strong guest preference for privacy and space.
- Looking at the property type distribution in Bellemont, House properties are the most common (74.1%), reflecting the local real estate landscape.
- Houses represent a significant 74.1% portion, catering likely to families or larger groups.
Bellemont Airbnb Room Capacity Analysis (2026): Bedroom Distribution
Distribution of Listings by Number of Bedrooms
Room Capacity Insights for Bellemont
- The dominant room capacity in Bellemont is 3 bedrooms listings, making up 29.6% of the market. This suggests a strong demand for properties suitable for families or small groups.
- Together, 3 bedrooms and 5+ bedrooms properties represent 55.5% of the active Airbnb listings in Bellemont, indicating a high concentration in these sizes.
- A significant 74.0% of listings offer 3+ bedrooms, catering to larger groups and families seeking more space in Bellemont.
Bellemont Vacation Rental Guest Capacity Trends (2026)
Distribution of Listings by Guest Capacity
Guest Capacity Insights for Bellemont
- The most common guest capacity trend in Bellemont vacation rentals is listings accommodating 8+ guests (59.3%). This suggests the primary traveler segment is likely larger groups.
- Properties designed for 8+ guests and 6 guests dominate the Bellemont STR market, accounting for 88.9% of listings.
- 88.9% of properties accommodate 6+ guests, serving the market segment for larger families or group travel in Bellemont.
- On average, properties in Bellemont are equipped to host 6.8 guests.
Bellemont Airbnb Booking Patterns (2026): Available vs. Booked Days
Available Days Distribution
Booked Days Distribution
Booking Pattern Insights for Bellemont
- The most common availability pattern in Bellemont falls within the 271-366 days range, representing 51.9% of listings. This suggests many properties have significant open periods on their calendars.
- Approximately 88.9% of listings show high availability (181+ days open annually), indicating potential for increased bookings or specific owner usage patterns.
- For booked days, the 91-180 days range is most frequent in Bellemont (33.3%), reflecting common guest stay durations or potential owner blocking patterns.
- A notable 14.8% of properties secure long booking periods (181+ days booked per year), highlighting successful long-term rental strategies or significant owner usage.
Bellemont Airbnb Minimum Stay Requirements Analysis
Distribution of Listings by Minimum Night Requirement
1 Night
2 listings
7.4% of total
2 Nights
18 listings
66.7% of total
3 Nights
2 listings
7.4% of total
7-29 Nights
2 listings
7.4% of total
30+ Nights
3 listings
11.1% of total
Key Insights
- The most prevalent minimum stay requirement in Bellemont is 2 Nights, adopted by 66.7% of listings. This highlights the market's preference for shorter, flexible bookings.
- A strong majority (74.1%) of the Bellemont Airbnb data shows acceptance of very short stays (1-2 nights), indicating a dynamic, high-turnover market.
- A significant segment (11.1%) caters to monthly stays (30+ nights) in Bellemont, pointing to opportunities in the extended-stay market.
Recommendations
- Align with the market by considering a 2 Nights minimum stay, as 66.7% of Bellemont hosts use this setting.
- If feasible, allowing 1-night stays, especially midweek or during low season, could capture last-minute bookings, as only 7.4% currently do.
- A 2-night minimum appears standard (66.7%). Consider this for weekends or peak periods.
- Explore offering discounts for stays of 30+ nights to attract the 11.1% of the market seeking extended stays.
- Adjust minimum nights based on seasonality – potentially shorter during low season and longer during peak demand periods in Bellemont.
Bellemont Airbnb Cancellation Policy Trends Analysis (2026)
Flexible
10 listings
37% of total
Moderate
4 listings
14.8% of total
Firm
5 listings
18.5% of total
Strict
8 listings
29.6% of total
Cancellation Policy Insights for Bellemont
- The prevailing Airbnb cancellation policy trend in Bellemont is Flexible, used by 37% of listings.
- There's a relatively balanced mix between guest-friendly (51.8%) and stricter (48.1%) policies, offering choices for different guest needs.
Recommendations for Hosts
- Consider adopting a Flexible policy to align with the 37% market standard in Bellemont.
- Regularly review your cancellation policy against competitors and market demand shifts in Bellemont.
Bellemont STR Booking Lead Time Analysis (2026)
Average Booking Lead Time by Month
Booking Lead Time Insights for Bellemont
- The overall average booking lead time for vacation rentals in Bellemont is 38 days.
- Guests book furthest in advance for stays during October (average 59 days), likely coinciding with peak travel demand or local events.
- The shortest booking windows occur for stays in March (average 24 days), indicating more last-minute travel plans during this time.
- Seasonally, Fall (55 days avg.) sees the longest lead times, while Winter (33 days avg.) has the shortest, reflecting typical travel planning cycles.
Recommendations for Hosts
- Use the overall average lead time (38 days) as a baseline for your pricing and availability strategy in Bellemont.
- For October stays, consider implementing length-of-stay discounts or slightly higher rates for bookings made less than 59 days out to capitalize on advance planning.
- Target marketing efforts for the Fall season well in advance (at least 55 days) to capture early planners.
- Monitor your own booking lead times against these Bellemont averages to identify opportunities for dynamic pricing adjustments.
Popular & Essential Airbnb Amenities in Bellemont (2026)
Amenity Prevalence
Amenity Insights for Bellemont
- Essential amenities in Bellemont that guests expect include: Wifi, TV, Coffee maker, Free parking on premises, Cooking basics, Kitchen, Microwave, Smoke alarm. Lacking these (any) could significantly impact bookings.
- Popular amenities like Carbon monoxide alarm, Air conditioning are common but not universal. Offering these can provide a competitive edge.
Recommendations for Hosts
- Ensure your listing includes all essential amenities for Bellemont: Wifi, TV, Coffee maker, Free parking on premises, Cooking basics, Kitchen, Microwave, Smoke alarm.
- Prioritize adding missing essentials: TV, Coffee maker, Free parking on premises, Cooking basics, Kitchen, Microwave, Smoke alarm.
- Consider adding popular differentiators like Carbon monoxide alarm or Air conditioning to increase appeal.
- Highlight unique or less common amenities you offer (e.g., hot tub, dedicated workspace, EV charger) in your listing description and photos.
- Regularly check competitor amenities in Bellemont to stay competitive.
Bellemont Airbnb Guest Demographics & Profile Analysis (2026)
Guest Profile Summary for Bellemont
- The typical guest profile for Airbnb in Bellemont consists of primarily domestic travelers (90%), often arriving from nearby Phoenix, typically belonging to the Post-2000s (Gen Z/Alpha) group (50%), primarily speaking English or Spanish.
- Domestic travelers account for 90.3% of guests.
- Key international markets include United States (90.3%) and Canada (1.9%).
- Top languages spoken are English (57.9%) followed by Spanish (15.9%).
- A significant demographic segment is the Post-2000s (Gen Z/Alpha) group, representing 50% of guests.
Recommendations for Hosts
- Target domestic marketing efforts towards travelers from Phoenix and Gilbert.
- Tailor amenities and listing descriptions to appeal to the dominant Post-2000s (Gen Z/Alpha) demographic (e.g., highlight fast WiFi, smart home features, local guides).
- Highlight unique local experiences or amenities relevant to the primary guest profile.
- Consider seasonal promotions aligned with peak travel times for key origin markets.
Nearby Short-Term Rental Market Comparison
How does the Bellemont Airbnb market stack up against its neighbors? Compare key performance metrics like average monthly revenue, ADR, and occupancy rates in surrounding areas to understand the broader regional STR landscape.
| Market | Active Properties | Monthly Revenue | Daily Rate | Avg. Occupancy |
|---|---|---|---|---|
| Sedona | 1,658 | $5,761 | $410.99 | 50% |
| Sedona City Limit | 372 | $4,884 | $333.39 | 51% |
| Fort Valley | 38 | $4,747 | $408.22 | 43% |
| Doney Park | 17 | $4,085 | $299.83 | 54% |
| Red Lake | 12 | $3,899 | $257.65 | 54% |
| Kachina Village | 138 | $3,786 | $252.87 | 50% |
| Greenehaven | 48 | $3,740 | $333.15 | 44% |
| Big Park | 427 | $3,618 | $294.75 | 47% |
| Star Valley | 12 | $3,374 | $279.20 | 43% |
| Flagstaff | 1,391 | $3,353 | $281.58 | 47% |