Wasilla Airbnb Market Analysis 2026: Short Term Rental Data & Vacation Rental Statistics in Alaska, United States
Is Airbnb profitable in Wasilla in 2026? Explore comprehensive Airbnb analytics for Wasilla, Alaska, United States to uncover income potential. This 2026 STR market report for Wasilla, based on AirROI data from February 2025 to January 2026, reveals key trends in the market of 296 active listings.
Whether you're considering an Airbnb investment in Wasilla, optimizing your existing vacation rental, or exploring rental arbitrage opportunities, understanding the Wasilla Airbnb data is crucial. Leveraging the low regulation environment is key to maximizing your short term rental income potential. Let's dive into the specifics.
Key Wasilla Airbnb Performance Metrics Overview
Monthly Airbnb Revenue Variations & Income Potential in Wasilla (2026)
Understanding the monthly revenue variations for Airbnb listings in Wasilla is key to maximizing your short term rental income potential. Seasonality significantly impacts earnings. Our analysis, based on data from the past 12 months, shows that the peak revenue month for STRs in Wasilla is typically July, while January often presents the lowest earnings, highlighting opportunities for strategic pricing adjustments during shoulder and low seasons. Explore the typical Airbnb income in Wasilla across different performance tiers:
- Best-in-class properties (Top 10%) achieve $6,484+ monthly, often utilizing dynamic pricing and superior guest experiences.
- Strong performing properties (Top 25%) earn $4,119 or more, indicating effective management and desirable locations/amenities.
- Typical properties (Median) generate around $2,538 per month, representing the average market performance.
- Entry-level properties (Bottom 25%) see earnings around $1,472, often with potential for optimization.
Average Monthly Airbnb Earnings Trend in Wasilla
Wasilla Airbnb Occupancy Rate Trends (2026)
Maximize your bookings by understanding the Wasilla STR occupancy trends. Seasonal demand shifts significantly influence how often properties are booked. Typically, Julysees the highest demand (peak season occupancy), while January experiences the lowest (low season). Effective strategies, like adjusting minimum stays or offering promotions, can boost occupancy during slower periods. Here's how different property tiers perform in Wasilla:
- Best-in-class properties (Top 10%) achieve 81%+ occupancy, indicating high desirability and potentially optimized availability.
- Strong performing properties (Top 25%) maintain 66% or higher occupancy, suggesting good market fit and guest satisfaction.
- Typical properties (Median) have an occupancy rate around 48%.
- Entry-level properties (Bottom 25%) average 28% occupancy, potentially facing higher vacancy.
Average Monthly Occupancy Rate Trend in Wasilla
Average Daily Rate (ADR) Airbnb Trends in Wasilla (2026)
Effective short term rental pricing strategy in Wasilla involves understanding monthly ADR fluctuations. The Average Daily Rate (ADR) for Airbnb in Wasilla typically peaks in June and dips lowest during February. Leveraging Airbnb dynamic pricing tools or strategies based on this seasonality can significantly boost revenue. Here's a look at the typical nightly rates achieved:
- Best-in-class properties (Top 10%) command rates of $373+ per night, often due to premium features or locations.
- Strong performing properties (Top 25%) achieve nightly rates of $238 or more.
- Typical properties (Median) charge around $169 per night.
- Entry-level properties (Bottom 25%) earn around $119 per night.
Average Daily Rate (ADR) Trend by Month in Wasilla
Get Live Wasilla Market Intelligence 👇

Explore Real-time Analytics
Airbnb Seasonality Analysis & Trends in Wasilla (2026)
Peak Season (July, August, June)
- Revenue averages $5,320 per month
- Occupancy rates average 66.4%
- Daily rates average $224
Shoulder Season
- Revenue averages $2,802 per month
- Occupancy maintains around 43.7%
- Daily rates hold near $207
Low Season (January, February, April)
- Revenue drops to average $1,953 per month
- Occupancy decreases to average 36.5%
- Daily rates adjust to average $192
Seasonality Insights for Wasilla
- The Airbnb seasonality in Wasilla shows highly seasonal trends requiring careful strategy. While the sections above show seasonal averages, it's also insightful to look at the extremes:
- During the high season, the absolute peak month showcases Wasilla's highest earning potential, with monthly revenues capable of climbing to $5,567, occupancy reaching a high of 68.4%, and ADRs peaking at $226.
- Conversely, the slowest single month of the year, typically falling within the low season, marks the market's lowest point. In this month, revenue might dip to $1,892, occupancy could drop to 31.0%, and ADRs may adjust down to $183.
- Understanding both the seasonal averages and these monthly peaks and troughs in revenue, occupancy, and ADR is crucial for maximizing your Airbnb profit potential in Wasilla.
Seasonal Strategies for Maximizing Profit
- Peak Season: Maximize revenue through premium pricing and potentially longer minimum stays. Ensure high availability.
- Low Season: Offer competitive pricing, special promotions (e.g., extended stay discounts), and flexible cancellation policies. Target off-season travelers like remote workers or budget-conscious guests.
- Shoulder Seasons: Implement dynamic pricing that balances peak and low rates. Target weekend travelers or specific events. Offer slightly more flexible terms than peak season.
- Regularly analyze your own performance against these Wasilla seasonality benchmarks and adjust your pricing and availability strategy accordingly.
Best Areas for Airbnb Investment in Wasilla (2026)
Exploring the top neighborhoods for short-term rentals in Wasilla? This section highlights key areas, outlining why they are attractive for hosts and guests, along with notable local attractions. Consider these locations based on your target guest profile and investment strategy.
| Neighborhood / Area | Why Host Here? (Target Guests & Appeal) | Key Attractions & Landmarks |
|---|---|---|
| Wasilla Lake | A picturesque area known for its beautiful lake views, perfect for outdoor enthusiasts and nature lovers looking for tranquility and recreation. | Wasilla Lake Park, Hatcher Pass, Lake Lucille Park, Pioneer Park, Reindeer Farm |
| Downtown Wasilla | The heart of Wasilla, offering a mix of dining, shopping, and entertainment options. Great for guests looking for convenience and local culture. | Mat-Su Valley Museum, Wasilla Depot, Wasilla Public Library, Sarafa Park, Wasilla Sports Complex |
| Fishhook Valley | A scenic area known for its stunning mountain views and outdoor activities such as hiking, fishing, and camping. Ideal for adventure seekers. | Hatcher Pass National Recreation Area, Knik River, Fishhook Picnic Area, Pioneer Peak, Snowmobiling and hiking trails |
| Settlers Bay | A beautiful waterfront community offering stunning views of the Knik Arm and access to golf and other outdoor activities. Ideal for a relaxing getaway. | Settlers Bay Golf Course, Pioneer Peak view, Knik River access, Biking trails, Fishing spots |
| Knik Goose Bay | An area known for its rich history and close connections to the outdoors, appealing to those looking for rustic charm and adventure. | Knik River Bridge, Historic Knik, Hiking trails, Camping spots, Knik Glacier tours |
| Buffalo Mine | An intriguing area with a unique history and access to various outdoor activities, popular among nature and history lovers. | Buffalo Mine Historical Site, Wildlife viewing, Hiking opportunities, Scenic drives, Nature trails |
| Big Lake | A popular area for fishing and boating, known for its recreational activities and natural beauty. Great for families and outdoor enthusiasts. | Big Lake Marina, Fishing spots, Boating, Big Lake Parks, Ice fishing in winter |
| Palmer-Wasilla Highway | A strategic area that connects Palmer and Wasilla, offering easy access to amenities and attractions in both towns, ideal for travelers seeking convenience. | Alaska State Fairgrounds, Palmer Museum of History and Art, Pioneer Park, Mat-Su Valley wineries, Farmers market |
Understanding Airbnb License Requirements & STR Laws in Wasilla (2026)
While Wasilla, Alaska, United States currently shows low STR regulations, specific Airbnb license requirements might still exist or change. Always verify the latest short term rental regulations and Airbnb license requirements directly with local government authorities for Wasilla to ensure full compliance before hosting.
(Source: AirROI data, 2026, based on 0% licensed listings)
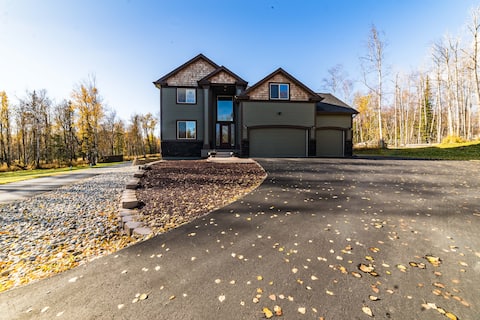
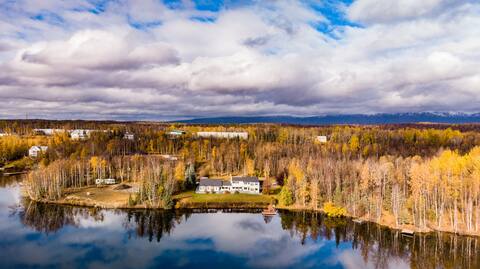
Top Performing Airbnb Properties in Wasilla (2026)
Benchmark your potential! Explore examples of top-performing Airbnb properties in Wasillabased on Trailing Twelve Month (TTM) revenue. Analyze their characteristics, revenue, occupancy rate, and ADR to understand what drives success in this market.
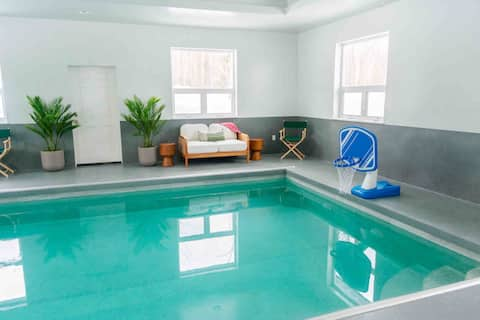
Poolside Peaks Retreat
Entire Place • 6 bedrooms

Luxury ensuite, modern amenities
Entire Place • 3 bedrooms
Lexi's Guesthouse an Impressive 5-Star home
Entire Place • 8 bedrooms

LUCILLE LAKE HOUSE - Relaxing, lakefront retreat
Entire Place • 4 bedrooms
Lexi's Lakehouse, Luxury on Wasilla Lake
Entire Place • 6 bedrooms

Ivy's Lakehouse
Entire Place • 5 bedrooms
Note: Performance varies based on location, size, amenities, seasonality, and management quality. Data reflects the past 12 months.
Top Performing Airbnb Hosts in Wasilla (2026)
Learn from the best! This table showcases top-performing Airbnb hosts in Wasilla based on the number of properties managed and estimated total revenue over the past year. Analyze their scale and performance metrics.
| Host Name | Properties | Grossing Revenue | Stay Reviews | Avg Rating |
|---|---|---|---|---|
| Sandra | 3 | $392,344 | 151 | 4.99/5.0 |
| Susitna Suites | 7 | $345,199 | 544 | 4.97/5.0 |
| Evolve | 7 | $221,586 | 132 | 4.85/5.0 |
| Shanna | 1 | $147,656 | 52 | 4.98/5.0 |
| Tristen | 1 | $139,997 | 25 | 4.92/5.0 |
| Carolyn | 1 | $137,647 | 42 | 5.00/5.0 |
| Daniel | 4 | $136,719 | 242 | 4.98/5.0 |
| Polina | 2 | $135,897 | 476 | 4.99/5.0 |
| Jimmy And Tina | 5 | $131,429 | 634 | 4.93/5.0 |
| Rachel | 2 | $129,885 | 223 | 4.78/5.0 |
Analyzing the strategies of top hosts, such as their property selection, pricing, and guest communication, can offer valuable lessons for optimizing your own Airbnb operations in Wasilla.
Dive Deeper: Advanced Wasilla STR Market Data (2026)
Ready to unlock more insights? AirROI provides access to advanced metrics and comprehensive Airbnb data for Wasilla. Explore detailed analytics beyond this report to refine your investment strategy, optimize pricing, and maximize your vacation rental profits.
Explore Advanced MetricsWasilla Short-Term Rental Market Composition (2026): Property & Room Types
Room Type Distribution
Property Type Distribution
Market Composition Insights for Wasilla
- The Wasilla Airbnb market composition is heavily skewed towards Entire Home/Apt listings, which make up 91.2% of the 296 active rentals. This indicates strong guest preference for privacy and space.
- Looking at the property type distribution in Wasilla, House properties are the most common (46.6%), reflecting the local real estate landscape.
- Houses represent a significant 46.6% portion, catering likely to families or larger groups.
- The presence of 7.8% Hotel/Boutique listings indicates integration with traditional hospitality.
Wasilla Airbnb Room Capacity Analysis (2026): Bedroom Distribution
Distribution of Listings by Number of Bedrooms
Room Capacity Insights for Wasilla
- The dominant room capacity in Wasilla is 1 bedroom listings, making up 28.4% of the market. This suggests a strong demand for properties suitable for couples or solo travelers.
- Together, 1 bedroom and 2 bedrooms properties represent 56.1% of the active Airbnb listings in Wasilla, indicating a high concentration in these sizes.
- A significant 33.1% of listings offer 3+ bedrooms, catering to larger groups and families seeking more space in Wasilla.
Wasilla Vacation Rental Guest Capacity Trends (2026)
Distribution of Listings by Guest Capacity
Guest Capacity Insights for Wasilla
- The most common guest capacity trend in Wasilla vacation rentals is listings accommodating 4 guests (22%). This suggests the primary traveler segment is likely small families or groups.
- Properties designed for 4 guests and 8+ guests dominate the Wasilla STR market, accounting for 41.9% of listings.
- 42.5% of properties accommodate 6+ guests, serving the market segment for larger families or group travel in Wasilla.
- On average, properties in Wasilla are equipped to host 4.8 guests.
Wasilla Airbnb Booking Patterns (2026): Available vs. Booked Days
Available Days Distribution
Booked Days Distribution
Booking Pattern Insights for Wasilla
- The most common availability pattern in Wasilla falls within the 181-270 days range, representing 37.2% of listings. This suggests many properties have significant open periods on their calendars.
- Approximately 73.7% of listings show high availability (181+ days open annually), indicating potential for increased bookings or specific owner usage patterns.
- For booked days, the 91-180 days range is most frequent in Wasilla (39.2%), reflecting common guest stay durations or potential owner blocking patterns.
- A notable 27.7% of properties secure long booking periods (181+ days booked per year), highlighting successful long-term rental strategies or significant owner usage.
Wasilla Airbnb Minimum Stay Requirements Analysis
Distribution of Listings by Minimum Night Requirement
1 Night
103 listings
34.8% of total
2 Nights
89 listings
30.1% of total
3 Nights
23 listings
7.8% of total
4-6 Nights
7 listings
2.4% of total
7-29 Nights
4 listings
1.4% of total
30+ Nights
70 listings
23.6% of total
Key Insights
- The most prevalent minimum stay requirement in Wasilla is 1 Night, adopted by 34.8% of listings. This highlights the market's preference for shorter, flexible bookings.
- A strong majority (64.9%) of the Wasilla Airbnb data shows acceptance of very short stays (1-2 nights), indicating a dynamic, high-turnover market.
- A significant segment (23.6%) caters to monthly stays (30+ nights) in Wasilla, pointing to opportunities in the extended-stay market.
Recommendations
- Align with the market by considering a 1 Night minimum stay, as 34.8% of Wasilla hosts use this setting.
- Explore offering discounts for stays of 30+ nights to attract the 23.6% of the market seeking extended stays.
- Adjust minimum nights based on seasonality – potentially shorter during low season and longer during peak demand periods in Wasilla.
Wasilla Airbnb Cancellation Policy Trends Analysis (2026)
Limited
12 listings
4.1% of total
Super Strict 30 Days
1 listings
0.3% of total
Flexible
85 listings
28.7% of total
Moderate
85 listings
28.7% of total
Firm
82 listings
27.7% of total
Strict
31 listings
10.5% of total
Cancellation Policy Insights for Wasilla
- The prevailing Airbnb cancellation policy trend in Wasilla is Flexible, used by 28.7% of listings.
- There's a relatively balanced mix between guest-friendly (57.4%) and stricter (38.2%) policies, offering choices for different guest needs.
Recommendations for Hosts
- Consider adopting a Flexible policy to align with the 28.7% market standard in Wasilla.
- Using a Strict policy might deter some guests, as only 10.5% of listings use it. Evaluate if potential revenue protection outweighs possible lower booking rates.
- Regularly review your cancellation policy against competitors and market demand shifts in Wasilla.
Wasilla STR Booking Lead Time Analysis (2026)
Average Booking Lead Time by Month
Booking Lead Time Insights for Wasilla
- The overall average booking lead time for vacation rentals in Wasilla is 47 days.
- Guests book furthest in advance for stays during July (average 77 days), likely coinciding with peak travel demand or local events.
- The shortest booking windows occur for stays in January (average 28 days), indicating more last-minute travel plans during this time.
- Seasonally, Summer (72 days avg.) sees the longest lead times, while Winter (31 days avg.) has the shortest, reflecting typical travel planning cycles.
Recommendations for Hosts
- Use the overall average lead time (47 days) as a baseline for your pricing and availability strategy in Wasilla.
- For July stays, consider implementing length-of-stay discounts or slightly higher rates for bookings made less than 77 days out to capitalize on advance planning.
- Target marketing efforts for the Summer season well in advance (at least 72 days) to capture early planners.
- Monitor your own booking lead times against these Wasilla averages to identify opportunities for dynamic pricing adjustments.
Popular & Essential Airbnb Amenities in Wasilla (2026)
Amenity Prevalence
Amenity Insights for Wasilla
- Essential amenities in Wasilla that guests expect include: Free parking on premises, Smoke alarm, Wifi, Carbon monoxide alarm. Lacking these (any) could significantly impact bookings.
- Popular amenities like TV, Heating, Hot water are common but not universal. Offering these can provide a competitive edge.
Recommendations for Hosts
- Ensure your listing includes all essential amenities for Wasilla: Free parking on premises, Smoke alarm, Wifi, Carbon monoxide alarm.
- Prioritize adding missing essentials: Free parking on premises, Smoke alarm, Wifi, Carbon monoxide alarm.
- Consider adding popular differentiators like TV or Heating to increase appeal.
- Highlight unique or less common amenities you offer (e.g., hot tub, dedicated workspace, EV charger) in your listing description and photos.
- Regularly check competitor amenities in Wasilla to stay competitive.
Wasilla Airbnb Guest Demographics & Profile Analysis (2026)
Guest Profile Summary for Wasilla
- The typical guest profile for Airbnb in Wasilla consists of primarily domestic travelers (95%), often arriving from nearby Fairbanks, typically belonging to the Post-2000s (Gen Z/Alpha) group (50%), primarily speaking English or Spanish.
- Domestic travelers account for 94.8% of guests.
- Key international markets include United States (94.8%) and Canada (0.9%).
- Top languages spoken are English (73.4%) followed by Spanish (8%).
- A significant demographic segment is the Post-2000s (Gen Z/Alpha) group, representing 50% of guests.
Recommendations for Hosts
- Target domestic marketing efforts towards travelers from Fairbanks and Anchorage.
- Tailor amenities and listing descriptions to appeal to the dominant Post-2000s (Gen Z/Alpha) demographic (e.g., highlight fast WiFi, smart home features, local guides).
- Highlight unique local experiences or amenities relevant to the primary guest profile.
- Consider seasonal promotions aligned with peak travel times for key origin markets.
Nearby Short-Term Rental Market Comparison
How does the Wasilla Airbnb market stack up against its neighbors? Compare key performance metrics like average monthly revenue, ADR, and occupancy rates in surrounding areas to understand the broader regional STR landscape.
| Market | Active Properties | Monthly Revenue | Daily Rate | Avg. Occupancy |
|---|---|---|---|---|
| Seward | 271 | $3,520 | $323.80 | 53% |
| Cooper Landing | 94 | $3,245 | $341.32 | 50% |
| Girdwood | 199 | $2,957 | $325.37 | 40% |
| Trapper Creek | 25 | $2,569 | $271.80 | 40% |
| Woodrow | 98 | $2,545 | $280.90 | 52% |
| Bear Creek | 98 | $2,489 | $243.13 | 54% |
| Anchorage | 2,099 | $2,324 | $218.00 | 49% |
| Talkeetna | 213 | $2,256 | $213.55 | 44% |
| Palmer | 310 | $2,181 | $208.17 | 45% |
| Moose Pass | 18 | $1,937 | $283.21 | 43% |