Soldotna Airbnb Market Analysis 2026: Short Term Rental Data & Vacation Rental Statistics in Alaska, United States
Is Airbnb profitable in Soldotna in 2026? Explore comprehensive Airbnb analytics for Soldotna, Alaska, United States to uncover income potential. This 2026 STR market report for Soldotna, based on AirROI data from February 2025 to January 2026, reveals key trends in the market of 327 active listings.
Whether you're considering an Airbnb investment in Soldotna, optimizing your existing vacation rental, or exploring rental arbitrage opportunities, understanding the Soldotna Airbnb data is crucial. Leveraging the low regulation environment is key to maximizing your short term rental income potential. Let's dive into the specifics.
Key Soldotna Airbnb Performance Metrics Overview
Monthly Airbnb Revenue Variations & Income Potential in Soldotna (2026)
Understanding the monthly revenue variations for Airbnb listings in Soldotna is key to maximizing your short term rental income potential. Seasonality significantly impacts earnings. Our analysis, based on data from the past 12 months, shows that the peak revenue month for STRs in Soldotna is typically July, while January often presents the lowest earnings, highlighting opportunities for strategic pricing adjustments during shoulder and low seasons. Explore the typical Airbnb income in Soldotna across different performance tiers:
- Best-in-class properties (Top 10%) achieve $6,179+ monthly, often utilizing dynamic pricing and superior guest experiences.
- Strong performing properties (Top 25%) earn $3,857 or more, indicating effective management and desirable locations/amenities.
- Typical properties (Median) generate around $2,161 per month, representing the average market performance.
- Entry-level properties (Bottom 25%) see earnings around $1,110, often with potential for optimization.
Average Monthly Airbnb Earnings Trend in Soldotna
Soldotna Airbnb Occupancy Rate Trends (2026)
Maximize your bookings by understanding the Soldotna STR occupancy trends. Seasonal demand shifts significantly influence how often properties are booked. Typically, Julysees the highest demand (peak season occupancy), while December experiences the lowest (low season). Effective strategies, like adjusting minimum stays or offering promotions, can boost occupancy during slower periods. Here's how different property tiers perform in Soldotna:
- Best-in-class properties (Top 10%) achieve 78%+ occupancy, indicating high desirability and potentially optimized availability.
- Strong performing properties (Top 25%) maintain 55% or higher occupancy, suggesting good market fit and guest satisfaction.
- Typical properties (Median) have an occupancy rate around 33%.
- Entry-level properties (Bottom 25%) average 18% occupancy, potentially facing higher vacancy.
Average Monthly Occupancy Rate Trend in Soldotna
Average Daily Rate (ADR) Airbnb Trends in Soldotna (2026)
Effective short term rental pricing strategy in Soldotna involves understanding monthly ADR fluctuations. The Average Daily Rate (ADR) for Airbnb in Soldotna typically peaks in July and dips lowest during March. Leveraging Airbnb dynamic pricing tools or strategies based on this seasonality can significantly boost revenue. Here's a look at the typical nightly rates achieved:
- Best-in-class properties (Top 10%) command rates of $546+ per night, often due to premium features or locations.
- Strong performing properties (Top 25%) achieve nightly rates of $339 or more.
- Typical properties (Median) charge around $217 per night.
- Entry-level properties (Bottom 25%) earn around $153 per night.
Average Daily Rate (ADR) Trend by Month in Soldotna
Get Live Soldotna Market Intelligence 👇

Explore Real-time Analytics
Airbnb Seasonality Analysis & Trends in Soldotna (2026)
Peak Season (July, August, June)
- Revenue averages $5,215 per month
- Occupancy rates average 53.4%
- Daily rates average $327
Shoulder Season
- Revenue averages $2,668 per month
- Occupancy maintains around 36.8%
- Daily rates hold near $292
Low Season (January, February, December)
- Revenue drops to average $1,437 per month
- Occupancy decreases to average 26.2%
- Daily rates adjust to average $289
Seasonality Insights for Soldotna
- The Airbnb seasonality in Soldotna shows highly seasonal trends requiring careful strategy. While the sections above show seasonal averages, it's also insightful to look at the extremes:
- During the high season, the absolute peak month showcases Soldotna's highest earning potential, with monthly revenues capable of climbing to $6,803, occupancy reaching a high of 67.4%, and ADRs peaking at $339.
- Conversely, the slowest single month of the year, typically falling within the low season, marks the market's lowest point. In this month, revenue might dip to $1,331, occupancy could drop to 22.0%, and ADRs may adjust down to $278.
- Understanding both the seasonal averages and these monthly peaks and troughs in revenue, occupancy, and ADR is crucial for maximizing your Airbnb profit potential in Soldotna.
Seasonal Strategies for Maximizing Profit
- Peak Season: Maximize revenue through premium pricing and potentially longer minimum stays. Ensure high availability.
- Low Season: Offer competitive pricing, special promotions (e.g., extended stay discounts), and flexible cancellation policies. Target off-season travelers like remote workers or budget-conscious guests.
- Shoulder Seasons: Implement dynamic pricing that balances peak and low rates. Target weekend travelers or specific events. Offer slightly more flexible terms than peak season.
- Regularly analyze your own performance against these Soldotna seasonality benchmarks and adjust your pricing and availability strategy accordingly.
Best Areas for Airbnb Investment in Soldotna (2026)
Exploring the top neighborhoods for short-term rentals in Soldotna? This section highlights key areas, outlining why they are attractive for hosts and guests, along with notable local attractions. Consider these locations based on your target guest profile and investment strategy.
| Neighborhood / Area | Why Host Here? (Target Guests & Appeal) | Key Attractions & Landmarks |
|---|---|---|
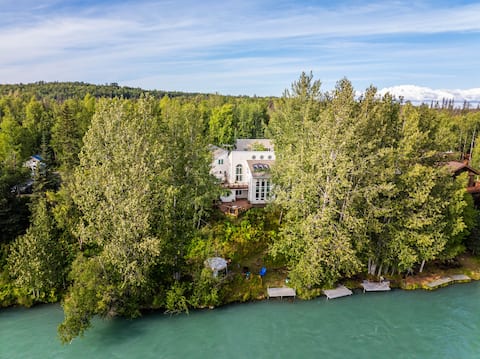
| Kenai River | Known for its world-class fishing and scenic views, the Kenai River area attracts outdoor enthusiasts and tourists looking for adventure in nature. It offers a great opportunity for hosting families and fishing groups. | Kenai River Fishing, Kenai National Wildlife Refuge, Soldotna Creek Park, Riverwatch Brewery, The Soldotna Visitor Center |
| Soldotna Downtown | The heart of Soldotna, featuring local shops, restaurants, and community events. It's a great area for travelers wanting to experience local culture and dining options. | Soldotna Historical Society, Soldotna Creek Park, Local Restaurants and Cafes, Art Galleries, Shopping Boutiques |
| Open Ocean Area | Proximity to stunning ocean views and beach access, making it attractive for tourists looking for relaxation and water activities. | Kachemak Bay State Park, Homer Spit, Fishing charters, Wildlife tours, Beach activities |
| Skyview Middle School Area | A quiet residential area that provides easy access to educational facilities and local parks, ideal for families and longer stays, especially during school events. | Soldotna Sports Center, Local parks, Community events, Family-friendly facilities |
| Alaska SeaLife Center | An aquarium with a focus on marine education and research, attracting families and marine life enthusiasts. It's a unique educational experience near beautiful views of the Alaskan coast. | Alaska SeaLife Center, Wildlife Viewing, Hiking Trails, Coastal Scenery |
| Soldotna Sports Center | A hub for sports enthusiasts with facilities for various activities. Popular during sports events and tournaments, making it valuable year-round for travelers. | Sports tournaments, Community events, Indoor pools, Ice rink activities |
| Nearby Prime Fishing Spots | Accessible fishing locations renowned for salmon and other trout species, attracting avid sportsmen and fishing tourists. | Anchor River, Kasilof River, Fishing charters, Scenic viewpoints, Wildlife spotting |
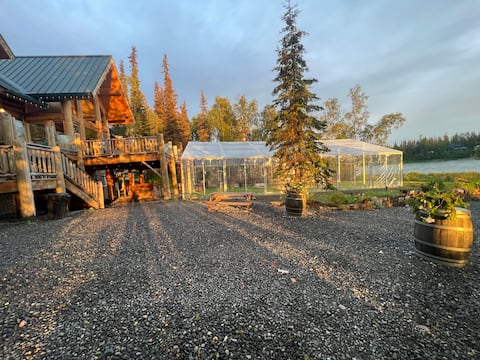
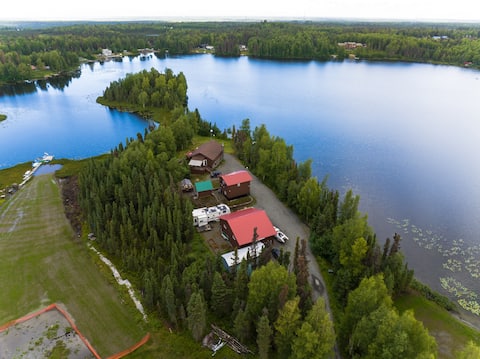
| Unique Alaskan Lodges | Stay in traditional Alaskan-style lodges with immersive experiences in nature, appealing to tourists looking for authentic Alaskan adventures. | Lodge-based tours, Wildlife excursions, Fishing and hiking packages, Cultural experiences |
Understanding Airbnb License Requirements & STR Laws in Soldotna (2026)
While Soldotna, Alaska, United States currently shows low STR regulations, specific Airbnb license requirements might still exist or change. Always verify the latest short term rental regulations and Airbnb license requirements directly with local government authorities for Soldotna to ensure full compliance before hosting.
(Source: AirROI data, 2026, based on 0% licensed listings)
Top Performing Airbnb Properties in Soldotna (2026)
Benchmark your potential! Explore examples of top-performing Airbnb properties in Soldotnabased on Trailing Twelve Month (TTM) revenue. Analyze their characteristics, revenue, occupancy rate, and ADR to understand what drives success in this market.
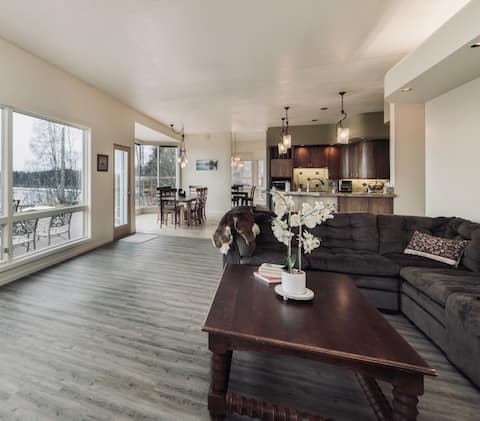
7300 sq. ft. property on the Kenai River.
Entire Place • 10 bedrooms
Alaska Fishing Lodge/Owner Approval Required Prior
Entire Place • 7 bedrooms
The Kenai River King
Entire Place • 4 bedrooms

CAMP BELL "Family Fish Camp" On The KENAI River
Entire Place • 5 bedrooms
The Peaceful Peninsula on Lake/Hot tub/2 houses
Entire Place • 5 bedrooms
Kenai River Home
Entire Place • 5 bedrooms
Note: Performance varies based on location, size, amenities, seasonality, and management quality. Data reflects the past 12 months.
Top Performing Airbnb Hosts in Soldotna (2026)
Learn from the best! This table showcases top-performing Airbnb hosts in Soldotna based on the number of properties managed and estimated total revenue over the past year. Analyze their scale and performance metrics.
| Host Name | Properties | Grossing Revenue | Stay Reviews | Avg Rating |
|---|---|---|---|---|
| Evolve | 20 | $457,257 | 292 | 4.82/5.0 |
| Daniel | 16 | $270,693 | 1332 | 4.88/5.0 |
| Jennifer | 7 | $225,327 | 17 | 5.00/5.0 |
| Sandi | 10 | $169,540 | 123 | 4.91/5.0 |
| Jackson | 3 | $159,177 | 73 | 4.97/5.0 |
| Zach | 2 | $155,259 | 55 | 4.93/5.0 |
| Sheila | 1 | $147,517 | 20 | 4.95/5.0 |
| Vacay On The Kenai | 4 | $134,872 | 17 | 5.00/5.0 |
| Iishan Andre | 1 | $123,009 | 7 | 4.86/5.0 |
| Bill | 1 | $111,972 | 12 | 5.00/5.0 |
Analyzing the strategies of top hosts, such as their property selection, pricing, and guest communication, can offer valuable lessons for optimizing your own Airbnb operations in Soldotna.
Dive Deeper: Advanced Soldotna STR Market Data (2026)
Ready to unlock more insights? AirROI provides access to advanced metrics and comprehensive Airbnb data for Soldotna. Explore detailed analytics beyond this report to refine your investment strategy, optimize pricing, and maximize your vacation rental profits.
Explore Advanced MetricsSoldotna Short-Term Rental Market Composition (2026): Property & Room Types
Room Type Distribution
Property Type Distribution
Market Composition Insights for Soldotna
- The Soldotna Airbnb market composition is heavily skewed towards Entire Home/Apt listings, which make up 90.2% of the 327 active rentals. This indicates strong guest preference for privacy and space.
- Looking at the property type distribution in Soldotna, House properties are the most common (38.8%), reflecting the local real estate landscape.
- Houses represent a significant 38.8% portion, catering likely to families or larger groups.
- The presence of 10.1% Hotel/Boutique listings indicates integration with traditional hospitality.
- Smaller segments like others, unique stays (combined 4.0%) offer potential for unique stay experiences.
Soldotna Airbnb Room Capacity Analysis (2026): Bedroom Distribution
Distribution of Listings by Number of Bedrooms
Room Capacity Insights for Soldotna
- The dominant room capacity in Soldotna is 1 bedroom listings, making up 31.8% of the market. This suggests a strong demand for properties suitable for couples or solo travelers.
- Together, 1 bedroom and 2 bedrooms properties represent 56.9% of the active Airbnb listings in Soldotna, indicating a high concentration in these sizes.
- A significant 31.5% of listings offer 3+ bedrooms, catering to larger groups and families seeking more space in Soldotna.
Soldotna Vacation Rental Guest Capacity Trends (2026)
Distribution of Listings by Guest Capacity
Guest Capacity Insights for Soldotna
- The most common guest capacity trend in Soldotna vacation rentals is listings accommodating 4 guests (23.9%). This suggests the primary traveler segment is likely small families or groups.
- Properties designed for 4 guests and 8+ guests dominate the Soldotna STR market, accounting for 46.5% of listings.
- 47.4% of properties accommodate 6+ guests, serving the market segment for larger families or group travel in Soldotna.
- On average, properties in Soldotna are equipped to host 5.1 guests.
Soldotna Airbnb Booking Patterns (2026): Available vs. Booked Days
Available Days Distribution
Booked Days Distribution
Booking Pattern Insights for Soldotna
- The most common availability pattern in Soldotna falls within the 271-366 days range, representing 70.6% of listings. This suggests many properties have significant open periods on their calendars.
- Approximately 94.1% of listings show high availability (181+ days open annually), indicating potential for increased bookings or specific owner usage patterns.
- For booked days, the 31-90 days range is most frequent in Soldotna (44.6%), reflecting common guest stay durations or potential owner blocking patterns.
- A notable 5.8% of properties secure long booking periods (181+ days booked per year), highlighting successful long-term rental strategies or significant owner usage.
Soldotna Airbnb Minimum Stay Requirements Analysis
Distribution of Listings by Minimum Night Requirement
1 Night
114 listings
34.9% of total
2 Nights
85 listings
26% of total
3 Nights
24 listings
7.3% of total
4-6 Nights
15 listings
4.6% of total
7-29 Nights
7 listings
2.1% of total
30+ Nights
82 listings
25.1% of total
Key Insights
- The most prevalent minimum stay requirement in Soldotna is 1 Night, adopted by 34.9% of listings. This highlights the market's preference for shorter, flexible bookings.
- A strong majority (60.9%) of the Soldotna Airbnb data shows acceptance of very short stays (1-2 nights), indicating a dynamic, high-turnover market.
- A significant segment (25.1%) caters to monthly stays (30+ nights) in Soldotna, pointing to opportunities in the extended-stay market.
Recommendations
- Align with the market by considering a 1 Night minimum stay, as 34.9% of Soldotna hosts use this setting.
- Explore offering discounts for stays of 30+ nights to attract the 25.1% of the market seeking extended stays.
- Adjust minimum nights based on seasonality – potentially shorter during low season and longer during peak demand periods in Soldotna.
Soldotna Airbnb Cancellation Policy Trends Analysis (2026)
Limited
1 listings
0.3% of total
Super Strict 30 Days
11 listings
3.4% of total
Super Strict 60 Days
13 listings
4% of total
Flexible
50 listings
15.3% of total
Moderate
54 listings
16.6% of total
Firm
137 listings
42% of total
Strict
60 listings
18.4% of total
Cancellation Policy Insights for Soldotna
- The prevailing Airbnb cancellation policy trend in Soldotna is Firm, used by 42% of listings.
- A majority (60.4%) of hosts in Soldotna utilize Firm or Strict policies, indicating a market where hosts prioritize booking security.
Recommendations for Hosts
- Consider adopting a Firm policy to align with the 42% market standard in Soldotna.
- Regularly review your cancellation policy against competitors and market demand shifts in Soldotna.
Soldotna STR Booking Lead Time Analysis (2026)
Average Booking Lead Time by Month
Booking Lead Time Insights for Soldotna
- The overall average booking lead time for vacation rentals in Soldotna is 93 days.
- Guests book furthest in advance for stays during July (average 127 days), likely coinciding with peak travel demand or local events.
- The shortest booking windows occur for stays in December (average 21 days), indicating more last-minute travel plans during this time.
- Seasonally, Summer (104 days avg.) sees the longest lead times, while Winter (22 days avg.) has the shortest, reflecting typical travel planning cycles.
Recommendations for Hosts
- Use the overall average lead time (93 days) as a baseline for your pricing and availability strategy in Soldotna.
- For July stays, consider implementing length-of-stay discounts or slightly higher rates for bookings made less than 127 days out to capitalize on advance planning.
- Target marketing efforts for the Summer season well in advance (at least 104 days) to capture early planners.
- Monitor your own booking lead times against these Soldotna averages to identify opportunities for dynamic pricing adjustments.
Popular & Essential Airbnb Amenities in Soldotna (2026)
Amenity Prevalence
Amenity Insights for Soldotna
- Essential amenities in Soldotna that guests expect include: Smoke alarm. Lacking these (this) could significantly impact bookings.
- Popular amenities like Free parking on premises, Kitchen, Wifi are common but not universal. Offering these can provide a competitive edge.
- Warning: Wifi is not universally provided but is considered essential globally. Ensure reliable Wifi is offered.
Recommendations for Hosts
- Ensure your listing includes all essential amenities for Soldotna: Smoke alarm.
- Prioritize adding missing essentials: Smoke alarm.
- Consider adding popular differentiators like Free parking on premises or Kitchen to increase appeal.
- Highlight unique or less common amenities you offer (e.g., hot tub, dedicated workspace, EV charger) in your listing description and photos.
- Regularly check competitor amenities in Soldotna to stay competitive.
Soldotna Airbnb Guest Demographics & Profile Analysis (2026)
Guest Profile Summary for Soldotna
- The typical guest profile for Airbnb in Soldotna consists of primarily domestic travelers (96%), often arriving from nearby Anchorage, typically belonging to the Post-2000s (Gen Z/Alpha) group (50%), primarily speaking English or Spanish.
- Domestic travelers account for 96.3% of guests.
- Key international markets include United States (96.3%) and Canada (0.5%).
- Top languages spoken are English (77.9%) followed by Spanish (8%).
- A significant demographic segment is the Post-2000s (Gen Z/Alpha) group, representing 50% of guests.
Recommendations for Hosts
- Target domestic marketing efforts towards travelers from Anchorage and Wasilla.
- Tailor amenities and listing descriptions to appeal to the dominant Post-2000s (Gen Z/Alpha) demographic (e.g., highlight fast WiFi, smart home features, local guides).
- Highlight unique local experiences or amenities relevant to the primary guest profile.
- Consider seasonal promotions aligned with peak travel times for key origin markets.
Nearby Short-Term Rental Market Comparison
How does the Soldotna Airbnb market stack up against its neighbors? Compare key performance metrics like average monthly revenue, ADR, and occupancy rates in surrounding areas to understand the broader regional STR landscape.
| Market | Active Properties | Monthly Revenue | Daily Rate | Avg. Occupancy |
|---|---|---|---|---|
| Kachemak City | 26 | $2,827 | $304.97 | 48% |
| Halibut Cove | 12 | $2,643 | $438.79 | 45% |
| Homer | 484 | $2,329 | $286.65 | 44% |
| Kenai | 205 | $1,694 | $236.14 | 44% |
| Sterling | 94 | $1,605 | $269.68 | 42% |
| Seldovia | 23 | $1,480 | $371.63 | 34% |
| Anchor Point | 52 | $1,192 | $220.16 | 35% |
| Kasilof | 77 | $1,094 | $238.97 | 36% |
| Ninilchik | 44 | $953 | $200.33 | 35% |
| Clam Gulch | 15 | $789 | $229.27 | 33% |