Houston Airbnb Market Analysis 2026: Short Term Rental Data & Vacation Rental Statistics in Alaska, United States
Is Airbnb profitable in Houston in 2026? Explore comprehensive Airbnb analytics for Houston, Alaska, United States to uncover income potential. This 2026 STR market report for Houston, based on AirROI data from February 2025 to January 2026, reveals key trends in the niche market of 30 active listings.
Whether you're considering an Airbnb investment in Houston, optimizing your existing vacation rental, or exploring rental arbitrage opportunities, understanding the Houston Airbnb data is crucial. Leveraging the low regulation environment is key to maximizing your short term rental income potential. Let's dive into the specifics.
Key Houston Airbnb Performance Metrics Overview
Monthly Airbnb Revenue Variations & Income Potential in Houston (2026)
Understanding the monthly revenue variations for Airbnb listings in Houston is key to maximizing your short term rental income potential. Seasonality significantly impacts earnings. Our analysis, based on data from the past 12 months, shows that the peak revenue month for STRs in Houston is typically August, while January often presents the lowest earnings, highlighting opportunities for strategic pricing adjustments during shoulder and low seasons. Explore the typical Airbnb income in Houston across different performance tiers:
- Best-in-class properties (Top 10%) achieve $5,361+ monthly, often utilizing dynamic pricing and superior guest experiences.
- Strong performing properties (Top 25%) earn $3,595 or more, indicating effective management and desirable locations/amenities.
- Typical properties (Median) generate around $1,813 per month, representing the average market performance.
- Entry-level properties (Bottom 25%) see earnings around $825, often with potential for optimization.
Average Monthly Airbnb Earnings Trend in Houston
Houston Airbnb Occupancy Rate Trends (2026)
Maximize your bookings by understanding the Houston STR occupancy trends. Seasonal demand shifts significantly influence how often properties are booked. Typically, Augustsees the highest demand (peak season occupancy), while January experiences the lowest (low season). Effective strategies, like adjusting minimum stays or offering promotions, can boost occupancy during slower periods. Here's how different property tiers perform in Houston:
- Best-in-class properties (Top 10%) achieve 78%+ occupancy, indicating high desirability and potentially optimized availability.
- Strong performing properties (Top 25%) maintain 62% or higher occupancy, suggesting good market fit and guest satisfaction.
- Typical properties (Median) have an occupancy rate around 41%.
- Entry-level properties (Bottom 25%) average 19% occupancy, potentially facing higher vacancy.
Average Monthly Occupancy Rate Trend in Houston
Average Daily Rate (ADR) Airbnb Trends in Houston (2026)
Effective short term rental pricing strategy in Houston involves understanding monthly ADR fluctuations. The Average Daily Rate (ADR) for Airbnb in Houston typically peaks in June and dips lowest during December. Leveraging Airbnb dynamic pricing tools or strategies based on this seasonality can significantly boost revenue. Here's a look at the typical nightly rates achieved:
- Best-in-class properties (Top 10%) command rates of $381+ per night, often due to premium features or locations.
- Strong performing properties (Top 25%) achieve nightly rates of $194 or more.
- Typical properties (Median) charge around $133 per night.
- Entry-level properties (Bottom 25%) earn around $84 per night.
Average Daily Rate (ADR) Trend by Month in Houston
Get Live Houston Market Intelligence 👇

Explore Real-time Analytics
Airbnb Seasonality Analysis & Trends in Houston (2026)
Peak Season (August, July, June)
- Revenue averages $3,326 per month
- Occupancy rates average 50.6%
- Daily rates average $197
Shoulder Season
- Revenue averages $2,429 per month
- Occupancy maintains around 43.0%
- Daily rates hold near $176
Low Season (January, February, December)
- Revenue drops to average $1,525 per month
- Occupancy decreases to average 31.2%
- Daily rates adjust to average $164
Seasonality Insights for Houston
- The Airbnb seasonality in Houston shows highly seasonal trends requiring careful strategy. While the sections above show seasonal averages, it's also insightful to look at the extremes:
- During the high season, the absolute peak month showcases Houston's highest earning potential, with monthly revenues capable of climbing to $3,524, occupancy reaching a high of 52.8%, and ADRs peaking at $199.
- Conversely, the slowest single month of the year, typically falling within the low season, marks the market's lowest point. In this month, revenue might dip to $1,254, occupancy could drop to 23.2%, and ADRs may adjust down to $161.
- Understanding both the seasonal averages and these monthly peaks and troughs in revenue, occupancy, and ADR is crucial for maximizing your Airbnb profit potential in Houston.
Seasonal Strategies for Maximizing Profit
- Peak Season: Maximize revenue through premium pricing and potentially longer minimum stays. Ensure high availability.
- Low Season: Offer competitive pricing, special promotions (e.g., extended stay discounts), and flexible cancellation policies. Target off-season travelers like remote workers or budget-conscious guests.
- Shoulder Seasons: Implement dynamic pricing that balances peak and low rates. Target weekend travelers or specific events. Offer slightly more flexible terms than peak season.
- Regularly analyze your own performance against these Houston seasonality benchmarks and adjust your pricing and availability strategy accordingly.
Best Areas for Airbnb Investment in Houston (2026)
Exploring the top neighborhoods for short-term rentals in Houston? This section highlights key areas, outlining why they are attractive for hosts and guests, along with notable local attractions. Consider these locations based on your target guest profile and investment strategy.
| Neighborhood / Area | Why Host Here? (Target Guests & Appeal) | Key Attractions & Landmarks |
|---|---|---|
| Downtown Houston | The heart of the city filled with skyscrapers, dining, and entertainment options. Ideal for business travelers and tourists looking to explore Houston's vibrant urban life. | Minute Maid Park, Theatre District, Discovery Green, Houston Aquarium, George R. Brown Convention Center |
| The Heights | A historic neighborhood known for its charming bungalows and trendy shops. Popular with families and young professionals seeking a community atmosphere with easy access to downtown. | Heights Hike and Bike Trail, Washington Avenue, Shops on 19th Street, Diverse dining options, Buffalo Bayou Park |
| Midtown | A bustling, youthful area with bars, restaurants, and a vibrant nightlife scene. Attracts young travelers and those looking for entertainment close to downtown. | Midtown Park, The Continental Club, Local pubs and eateries, Art galleries, Public transport access |
| Montrose | An eclectic neighborhood known for its art scene, historic homes, and diverse dining. A favorite among creative individuals and those looking for unique experiences. | Menil Collection, Rothko Chapel, Montrose Street, Vibrant nightlife spots, Cultural events |
| Galleria | The city’s most upscale area featuring a major shopping mall, high-end restaurants, and luxury hotels. Attracts both leisure and business travelers. | The Galleria Mall, High-end fashion stores, Ice skating rink, Uptown Park, Fine dining restaurants |
| West University | A residential neighborhood with tree-lined streets and a suburban feel. Ideal for families and visitors looking for a quiet area close to urban amenities. | Rice University, West University Parks, Nearby shopping areas, Family-friendly vibe, Access to local dining options |
| Katy | A fast-growing suburb with family-friendly attractions and good schools. Perfect for those seeking a quieter lifestyle while still being close to Houston. | Katy Mills Mall, Typhoon Texas Waterpark, Parks and recreation areas, Historic downtown Katy, Dining options |
| Clear Lake | A scenic area near the water with parks and recreational activities. Attracts families and outdoor enthusiasts looking for a peaceful getaway near Houston. | NASA Johnson Space Center, Clear Lake Park, Water sports, Boating and fishing, Dining by the waterfront |
Understanding Airbnb License Requirements & STR Laws in Houston (2026)
While Houston, Alaska, United States currently shows low STR regulations, specific Airbnb license requirements might still exist or change. Always verify the latest short term rental regulations and Airbnb license requirements directly with local government authorities for Houston to ensure full compliance before hosting.
(Source: AirROI data, 2026, finding no licensed listings among those analyzed)
Top Performing Airbnb Properties in Houston (2026)
Benchmark your potential! Explore examples of top-performing Airbnb properties in Houstonbased on Trailing Twelve Month (TTM) revenue. Analyze their characteristics, revenue, occupancy rate, and ADR to understand what drives success in this market.

Wasilla 'Spruce Moose' Cabin: Lakefront + Hot Tub!
Entire Place • 2 bedrooms

Epic Alaskan Airplane Home DC-9
Entire Place • 3 bedrooms

DC-6 Airplane House
Entire Place • 2 bedrooms
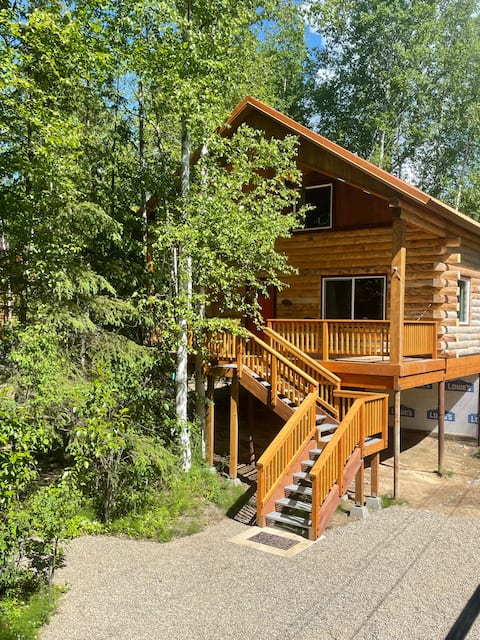
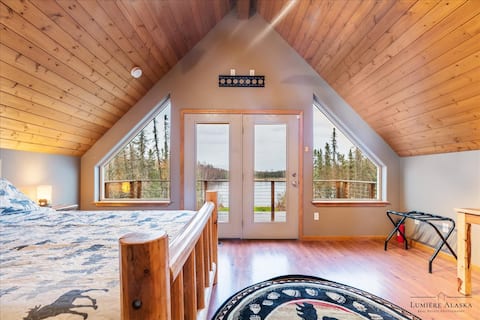
Riverfront, Authentic, Luxury Log Cabin-Bison
Entire Place • 1 bedroom
R n R Lake Escape, 2 bed, 2 bath Lakeside Cabin
Entire Place • 2 bedrooms

Riverfront, Authentic, Luxury Log Cabin-Black Bear
Entire Place • 1 bedroom
Note: Performance varies based on location, size, amenities, seasonality, and management quality. Data reflects the past 12 months.
Top Performing Airbnb Hosts in Houston (2026)
Learn from the best! This table showcases top-performing Airbnb hosts in Houston based on the number of properties managed and estimated total revenue over the past year. Analyze their scale and performance metrics.
| Host Name | Properties | Grossing Revenue | Stay Reviews | Avg Rating |
|---|---|---|---|---|
| Jon | 10 | $185,599 | 284 | 4.75/5.0 |
| Bonnie | 3 | $120,182 | 322 | 4.96/5.0 |
| Evolve | 2 | $95,104 | 39 | 4.73/5.0 |
| David Christopher | 1 | $41,916 | 59 | 4.95/5.0 |
| Jenny | 1 | $36,659 | 77 | 4.97/5.0 |
| Ron | 6 | $35,243 | 196 | 4.66/5.0 |
| Nicki | 1 | $25,670 | 57 | 4.96/5.0 |
| Robin | 1 | $18,159 | 451 | 4.95/5.0 |
| James | 1 | $17,147 | 80 | 4.91/5.0 |
| Khyle | 1 | $13,380 | 149 | 4.76/5.0 |
Analyzing the strategies of top hosts, such as their property selection, pricing, and guest communication, can offer valuable lessons for optimizing your own Airbnb operations in Houston.
Dive Deeper: Advanced Houston STR Market Data (2026)
Ready to unlock more insights? AirROI provides access to advanced metrics and comprehensive Airbnb data for Houston. Explore detailed analytics beyond this report to refine your investment strategy, optimize pricing, and maximize your vacation rental profits.
Explore Advanced MetricsHouston Short-Term Rental Market Composition (2026): Property & Room Types
Room Type Distribution
Property Type Distribution
Market Composition Insights for Houston
- The Houston Airbnb market composition is heavily skewed towards Entire Home/Apt listings, which make up 93.3% of the 30 active rentals. This indicates strong guest preference for privacy and space.
- Looking at the property type distribution in Houston, Outdoor/Unique properties are the most common (56.7%), reflecting the local real estate landscape.
- Houses represent a significant 30% portion, catering likely to families or larger groups.
- Smaller segments like others, apartment/condo, hotel/boutique, unique stays (combined 13.2%) offer potential for unique stay experiences.
Houston Airbnb Room Capacity Analysis (2026): Bedroom Distribution
Distribution of Listings by Number of Bedrooms
Room Capacity Insights for Houston
- The dominant room capacity in Houston is 1 bedroom listings, making up 50% of the market. This suggests a strong demand for properties suitable for couples or solo travelers.
- Together, 1 bedroom and 2 bedrooms properties represent 76.7% of the active Airbnb listings in Houston, indicating a high concentration in these sizes.
- Listings with 3+ bedrooms (6.7%) represent a smaller niche, potentially indicating an underserved market for larger group accommodations in Houston.
Houston Vacation Rental Guest Capacity Trends (2026)
Distribution of Listings by Guest Capacity
Guest Capacity Insights for Houston
- The most common guest capacity trend in Houston vacation rentals is listings accommodating 6 guests (23.3%). This suggests the primary traveler segment is likely larger groups.
- Properties designed for 6 guests and 5 guests dominate the Houston STR market, accounting for 40.0% of listings.
- 36.6% of properties accommodate 6+ guests, serving the market segment for larger families or group travel in Houston.
- On average, properties in Houston are equipped to host 4.4 guests.
Houston Airbnb Booking Patterns (2026): Available vs. Booked Days
Available Days Distribution
Booked Days Distribution
Booking Pattern Insights for Houston
- The most common availability pattern in Houston falls within the 271-366 days range, representing 46.7% of listings. This suggests many properties have significant open periods on their calendars.
- Approximately 80.0% of listings show high availability (181+ days open annually), indicating potential for increased bookings or specific owner usage patterns.
- For booked days, the 1-30 days range is most frequent in Houston (33.3%), reflecting common guest stay durations or potential owner blocking patterns.
- A notable 23.3% of properties secure long booking periods (181+ days booked per year), highlighting successful long-term rental strategies or significant owner usage.
Houston Airbnb Minimum Stay Requirements Analysis
Distribution of Listings by Minimum Night Requirement
1 Night
16 listings
53.3% of total
2 Nights
3 listings
10% of total
3 Nights
1 listings
3.3% of total
30+ Nights
10 listings
33.3% of total
Key Insights
- The most prevalent minimum stay requirement in Houston is 1 Night, adopted by 53.3% of listings. This highlights the market's preference for shorter, flexible bookings.
- A strong majority (63.3%) of the Houston Airbnb data shows acceptance of very short stays (1-2 nights), indicating a dynamic, high-turnover market.
- A significant segment (33.3%) caters to monthly stays (30+ nights) in Houston, pointing to opportunities in the extended-stay market.
Recommendations
- Align with the market by considering a 1 Night minimum stay, as 53.3% of Houston hosts use this setting.
- Explore offering discounts for stays of 30+ nights to attract the 33.3% of the market seeking extended stays.
- Adjust minimum nights based on seasonality – potentially shorter during low season and longer during peak demand periods in Houston.
Houston Airbnb Cancellation Policy Trends Analysis (2026)
Super Strict 60 Days
8 listings
26.7% of total
Flexible
2 listings
6.7% of total
Moderate
8 listings
26.7% of total
Firm
8 listings
26.7% of total
Strict
4 listings
13.3% of total
Cancellation Policy Insights for Houston
- The prevailing Airbnb cancellation policy trend in Houston is Super Strict 60 Days, used by 26.7% of listings.
- There's a relatively balanced mix between guest-friendly (33.4%) and stricter (40.0%) policies, offering choices for different guest needs.
Recommendations for Hosts
- Consider adopting a Super Strict 60 Days policy to align with the 26.7% market standard in Houston.
- Using a Strict policy might deter some guests, as only 13.3% of listings use it. Evaluate if potential revenue protection outweighs possible lower booking rates.
- Regularly review your cancellation policy against competitors and market demand shifts in Houston.
Houston STR Booking Lead Time Analysis (2026)
Average Booking Lead Time by Month
Booking Lead Time Insights for Houston
- The overall average booking lead time for vacation rentals in Houston is 50 days.
- Guests book furthest in advance for stays during August (average 97 days), likely coinciding with peak travel demand or local events.
- The shortest booking windows occur for stays in January (average 18 days), indicating more last-minute travel plans during this time.
- Seasonally, Summer (72 days avg.) sees the longest lead times, while Spring (32 days avg.) has the shortest, reflecting typical travel planning cycles.
Recommendations for Hosts
- Use the overall average lead time (50 days) as a baseline for your pricing and availability strategy in Houston.
- For August stays, consider implementing length-of-stay discounts or slightly higher rates for bookings made less than 97 days out to capitalize on advance planning.
- Target marketing efforts for the Summer season well in advance (at least 72 days) to capture early planners.
- Monitor your own booking lead times against these Houston averages to identify opportunities for dynamic pricing adjustments.
Popular & Essential Airbnb Amenities in Houston (2026)
Amenity Prevalence
Amenity Insights for Houston
- Essential amenities in Houston that guests expect include: Heating, Free parking on premises, Wifi. Lacking these (any) could significantly impact bookings.
- Popular amenities like Smoke alarm, Fire extinguisher, Fire pit are common but not universal. Offering these can provide a competitive edge.
Recommendations for Hosts
- Ensure your listing includes all essential amenities for Houston: Heating, Free parking on premises, Wifi.
- Prioritize adding missing essentials: Free parking on premises, Wifi.
- Consider adding popular differentiators like Smoke alarm or Fire extinguisher to increase appeal.
- Highlight unique or less common amenities you offer (e.g., hot tub, dedicated workspace, EV charger) in your listing description and photos.
- Regularly check competitor amenities in Houston to stay competitive.
Houston Airbnb Guest Demographics & Profile Analysis (2026)
Guest Profile Summary for Houston
- The typical guest profile for Airbnb in Houston consists of primarily domestic travelers (95%), often arriving from nearby Anchorage, typically belonging to the Post-2000s (Gen Z/Alpha) group (50%), primarily speaking English or Spanish.
- Domestic travelers account for 95.1% of guests.
- Key international markets include United States (95.1%) and Canada (1.5%).
- Top languages spoken are English (70.7%) followed by Spanish (8.2%).
- A significant demographic segment is the Post-2000s (Gen Z/Alpha) group, representing 50% of guests.
Recommendations for Hosts
- Target domestic marketing efforts towards travelers from Anchorage and Fairbanks.
- Tailor amenities and listing descriptions to appeal to the dominant Post-2000s (Gen Z/Alpha) demographic (e.g., highlight fast WiFi, smart home features, local guides).
- Highlight unique local experiences or amenities relevant to the primary guest profile.
- Consider seasonal promotions aligned with peak travel times for key origin markets.
Nearby Short-Term Rental Market Comparison
How does the Houston Airbnb market stack up against its neighbors? Compare key performance metrics like average monthly revenue, ADR, and occupancy rates in surrounding areas to understand the broader regional STR landscape.
| Market | Active Properties | Monthly Revenue | Daily Rate | Avg. Occupancy |
|---|---|---|---|---|
| Seward | 271 | $3,520 | $323.80 | 53% |
| Cooper Landing | 94 | $3,245 | $341.32 | 50% |
| Girdwood | 199 | $2,957 | $325.37 | 40% |
| Trapper Creek | 25 | $2,569 | $271.80 | 40% |
| Woodrow | 98 | $2,545 | $280.90 | 52% |
| Bear Creek | 98 | $2,489 | $243.13 | 54% |
| Wasilla | 296 | $2,360 | $212.22 | 48% |
| Anchorage | 2,099 | $2,324 | $218.00 | 49% |
| Talkeetna | 213 | $2,256 | $213.55 | 44% |
| Palmer | 310 | $2,181 | $208.17 | 45% |