Bear Creek Airbnb Market Analysis 2026: Short Term Rental Data & Vacation Rental Statistics in Alaska, United States
Is Airbnb profitable in Bear Creek in 2026? Explore comprehensive Airbnb analytics for Bear Creek, Alaska, United States to uncover income potential. This 2026 STR market report for Bear Creek, based on AirROI data from February 2025 to January 2026, reveals key trends in the niche market of 98 active listings.
Whether you're considering an Airbnb investment in Bear Creek, optimizing your existing vacation rental, or exploring rental arbitrage opportunities, understanding the Bear Creek Airbnb data is crucial. Leveraging the low regulation environment is key to maximizing your short term rental income potential. Let's dive into the specifics.
Key Bear Creek Airbnb Performance Metrics Overview
Monthly Airbnb Revenue Variations & Income Potential in Bear Creek (2026)
Understanding the monthly revenue variations for Airbnb listings in Bear Creek is key to maximizing your short term rental income potential. Seasonality significantly impacts earnings. Our analysis, based on data from the past 12 months, shows that the peak revenue month for STRs in Bear Creek is typically July, while January often presents the lowest earnings, highlighting opportunities for strategic pricing adjustments during shoulder and low seasons. Explore the typical Airbnb income in Bear Creek across different performance tiers:
- Best-in-class properties (Top 10%) achieve $6,571+ monthly, often utilizing dynamic pricing and superior guest experiences.
- Strong performing properties (Top 25%) earn $4,699 or more, indicating effective management and desirable locations/amenities.
- Typical properties (Median) generate around $3,145 per month, representing the average market performance.
- Entry-level properties (Bottom 25%) see earnings around $1,852, often with potential for optimization.
Average Monthly Airbnb Earnings Trend in Bear Creek
Bear Creek Airbnb Occupancy Rate Trends (2026)
Maximize your bookings by understanding the Bear Creek STR occupancy trends. Seasonal demand shifts significantly influence how often properties are booked. Typically, Julysees the highest demand (peak season occupancy), while January experiences the lowest (low season). Effective strategies, like adjusting minimum stays or offering promotions, can boost occupancy during slower periods. Here's how different property tiers perform in Bear Creek:
- Best-in-class properties (Top 10%) achieve 68%+ occupancy, indicating high desirability and potentially optimized availability.
- Strong performing properties (Top 25%) maintain 56% or higher occupancy, suggesting good market fit and guest satisfaction.
- Typical properties (Median) have an occupancy rate around 43%.
- Entry-level properties (Bottom 25%) average 28% occupancy, potentially facing higher vacancy.
Average Monthly Occupancy Rate Trend in Bear Creek
Average Daily Rate (ADR) Airbnb Trends in Bear Creek (2026)
Effective short term rental pricing strategy in Bear Creek involves understanding monthly ADR fluctuations. The Average Daily Rate (ADR) for Airbnb in Bear Creek typically peaks in July and dips lowest during March. Leveraging Airbnb dynamic pricing tools or strategies based on this seasonality can significantly boost revenue. Here's a look at the typical nightly rates achieved:
- Best-in-class properties (Top 10%) command rates of $362+ per night, often due to premium features or locations.
- Strong performing properties (Top 25%) achieve nightly rates of $291 or more.
- Typical properties (Median) charge around $215 per night.
- Entry-level properties (Bottom 25%) earn around $166 per night.
Average Daily Rate (ADR) Trend by Month in Bear Creek
Get Live Bear Creek Market Intelligence 👇

Explore Real-time Analytics
Airbnb Seasonality Analysis & Trends in Bear Creek (2026)
Peak Season (July, August, June)
- Revenue averages $6,807 per month
- Occupancy rates average 75.0%
- Daily rates average $254
Shoulder Season
- Revenue averages $2,987 per month
- Occupancy maintains around 36.4%
- Daily rates hold near $231
Low Season (January, February, March)
- Revenue drops to average $1,317 per month
- Occupancy decreases to average 21.3%
- Daily rates adjust to average $224
Seasonality Insights for Bear Creek
- The Airbnb seasonality in Bear Creek shows highly seasonal trends requiring careful strategy. While the sections above show seasonal averages, it's also insightful to look at the extremes:
- During the high season, the absolute peak month showcases Bear Creek's highest earning potential, with monthly revenues capable of climbing to $7,522, occupancy reaching a high of 81.5%, and ADRs peaking at $257.
- Conversely, the slowest single month of the year, typically falling within the low season, marks the market's lowest point. In this month, revenue might dip to $936, occupancy could drop to 14.5%, and ADRs may adjust down to $220.
- Understanding both the seasonal averages and these monthly peaks and troughs in revenue, occupancy, and ADR is crucial for maximizing your Airbnb profit potential in Bear Creek.
Seasonal Strategies for Maximizing Profit
- Peak Season: Maximize revenue through premium pricing and potentially longer minimum stays. Ensure high availability.
- Low Season: Offer competitive pricing, special promotions (e.g., extended stay discounts), and flexible cancellation policies. Target off-season travelers like remote workers or budget-conscious guests.
- Shoulder Seasons: Implement dynamic pricing that balances peak and low rates. Target weekend travelers or specific events. Offer slightly more flexible terms than peak season.
- Regularly analyze your own performance against these Bear Creek seasonality benchmarks and adjust your pricing and availability strategy accordingly.
Best Areas for Airbnb Investment in Bear Creek (2026)
Exploring the top neighborhoods for short-term rentals in Bear Creek? This section highlights key areas, outlining why they are attractive for hosts and guests, along with notable local attractions. Consider these locations based on your target guest profile and investment strategy.
| Neighborhood / Area | Why Host Here? (Target Guests & Appeal) | Key Attractions & Landmarks |
|---|---|---|
| Bear Valley | A scenic area located near the Chugach National Forest, perfect for nature lovers and outdoor activities. Its stunning landscapes and proximity to hiking trails attract both tourists and adventure seekers. | Chugach National Forest, Bear Valley Trail, Skiing and snowboarding areas, Fishing spots, Wildlife viewing opportunities |
| Bear Creek Village | A charming small community offering a quaint and cozy stay. Visitors appreciate the local culture and the sense of community, making it ideal for family getaways or romantic retreats. | Local shops and restaurants, Community events, Scenic vistas, Proximity to Bear Creek |
| Knik River | Known for its beautiful river views and abundant wildlife, Knik River offers visitors a unique Alaskan experience. Great for outdoor activities such as kayaking and fishing. | Knik Glacier, Knik River rafting, Wildlife photography, Hiking trails, Scenic boat tours |
| Talkeetna | A quirky town famous for its local arts scene and as a base for Denali National Park adventures. Attractive for those looking for a distinctive small-town feel combined with stunning scenery. | Denali National Park access, Talkeetna Historical Society Museum, Local art galleries, Suspension bridge, Festivals and fairs |
| Seward | A coastal town known for its picturesque views and access to Kenai Fjords National Park. Ideal for adventure tourists looking to explore the Alaskan wilderness. | Kenai Fjords National Park, Seward Boat Harbor, Exit Glacier, Seward Museum, Fishing charters |
| Homer | Known as the 'Halibut Fishing Capital of the World', Homer boasts beautiful landscapes and beaches. It's popular for both anglers and those seeking relaxation by the sea. | Kachemak Bay State Park, Homer Spit, Fishing tours, Art galleries, Whale watching tours |
| Anchorage | The largest city in Alaska, offering urban conveniences along with access to wilderness adventures. Great for those looking for both city life and outdoor activities in one place. | Tony Knowles Coastal Trail, Anchorage Museum, Wildlife Conservation Center, Flattop Mountain, Alaska Native Heritage Center |
| Girdwood | A year-round resort town known for its skiing and adventure tourism. It's a gateway to plenty of outdoor activities, making it highly sought after by tourists. | Alyeska Resort, Girdwood Brewing Company, Girdwood Nordic Ski Club, Hiking trails, Scenic tram rides |
Understanding Airbnb License Requirements & STR Laws in Bear Creek (2026)
While Bear Creek, Alaska, United States currently shows low STR regulations, specific Airbnb license requirements might still exist or change. Always verify the latest short term rental regulations and Airbnb license requirements directly with local government authorities for Bear Creek to ensure full compliance before hosting.
(Source: AirROI data, 2026, finding no licensed listings among those analyzed)
Top Performing Airbnb Properties in Bear Creek (2026)
Benchmark your potential! Explore examples of top-performing Airbnb properties in Bear Creekbased on Trailing Twelve Month (TTM) revenue. Analyze their characteristics, revenue, occupancy rate, and ADR to understand what drives success in this market.
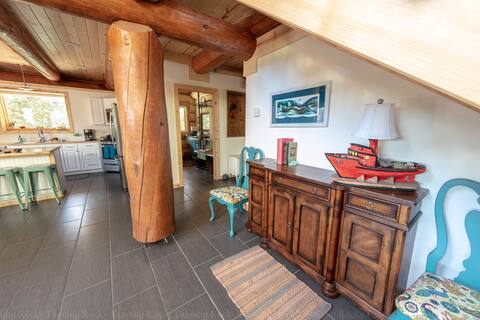
Alaskan Log Cabin
Entire Place • 3 bedrooms

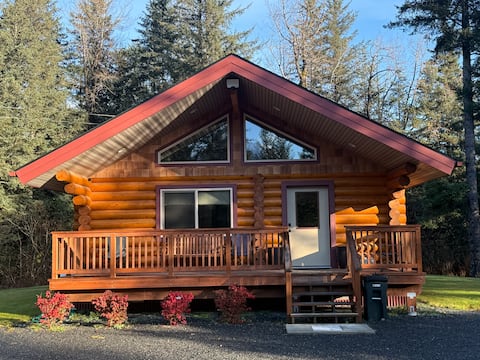
Peaks View Chalet
Entire Place • 2 bedrooms

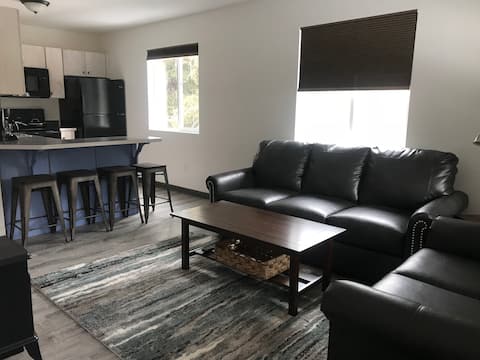
Exit Glacier Cottage
Entire Place • 2 bedrooms
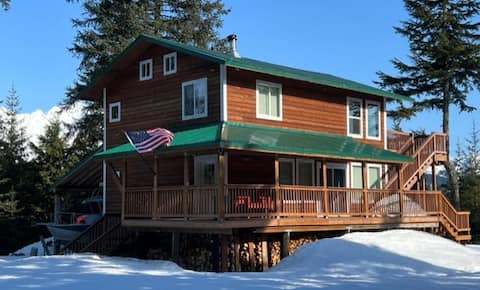
Clear Creek Cabin
Entire Place • 2 bedrooms
Alaska Alpine Meadow Retreat*
Entire Place • 3 bedrooms
Wil's Cabin
Entire Place • 3 bedrooms
Note: Performance varies based on location, size, amenities, seasonality, and management quality. Data reflects the past 12 months.
Top Performing Airbnb Hosts in Bear Creek (2026)
Learn from the best! This table showcases top-performing Airbnb hosts in Bear Creek based on the number of properties managed and estimated total revenue over the past year. Analyze their scale and performance metrics.
| Host Name | Properties | Grossing Revenue | Stay Reviews | Avg Rating |
|---|---|---|---|---|
| Danny | 9 | $303,849 | 968 | 4.82/5.0 |
| Julie | 2 | $155,279 | 191 | 4.99/5.0 |
| Brandon | 11 | $147,460 | 199 | 4.90/5.0 |
| Pacific Rentals | 4 | $133,915 | 265 | 4.92/5.0 |
| Jena | 3 | $129,626 | 296 | 4.96/5.0 |
| Angela | 3 | $113,300 | 732 | 4.77/5.0 |
| Kevin | 5 | $112,957 | 555 | 4.86/5.0 |
| Cassie | 2 | $103,107 | 169 | 4.91/5.0 |
| Maja | 3 | $96,438 | 89 | 4.93/5.0 |
| Elizabeth | 1 | $85,033 | 58 | 4.84/5.0 |
Analyzing the strategies of top hosts, such as their property selection, pricing, and guest communication, can offer valuable lessons for optimizing your own Airbnb operations in Bear Creek.
Dive Deeper: Advanced Bear Creek STR Market Data (2026)
Ready to unlock more insights? AirROI provides access to advanced metrics and comprehensive Airbnb data for Bear Creek. Explore detailed analytics beyond this report to refine your investment strategy, optimize pricing, and maximize your vacation rental profits.
Explore Advanced MetricsBear Creek Short-Term Rental Market Composition (2026): Property & Room Types
Room Type Distribution
Property Type Distribution
Market Composition Insights for Bear Creek
- The Bear Creek Airbnb market composition is heavily skewed towards Entire Home/Apt listings, which make up 87.8% of the 98 active rentals. This indicates strong guest preference for privacy and space.
- Looking at the property type distribution in Bear Creek, Outdoor/Unique properties are the most common (59.2%), reflecting the local real estate landscape.
- The presence of 6.1% Hotel/Boutique listings indicates integration with traditional hospitality.
- Smaller segments like others, unique stays (combined 4.1%) offer potential for unique stay experiences.
Bear Creek Airbnb Room Capacity Analysis (2026): Bedroom Distribution
Distribution of Listings by Number of Bedrooms
Room Capacity Insights for Bear Creek
- The dominant room capacity in Bear Creek is 1 bedroom listings, making up 36.7% of the market. This suggests a strong demand for properties suitable for couples or solo travelers.
- Together, 1 bedroom and 2 bedrooms properties represent 70.4% of the active Airbnb listings in Bear Creek, indicating a high concentration in these sizes.
- Listings with 3+ bedrooms (9.2%) represent a smaller niche, potentially indicating an underserved market for larger group accommodations in Bear Creek.
Bear Creek Vacation Rental Guest Capacity Trends (2026)
Distribution of Listings by Guest Capacity
Guest Capacity Insights for Bear Creek
- The most common guest capacity trend in Bear Creek vacation rentals is listings accommodating 4 guests (29.6%). This suggests the primary traveler segment is likely small families or groups.
- Properties designed for 4 guests and 6 guests dominate the Bear Creek STR market, accounting for 50.0% of listings.
- 26.6% of properties accommodate 6+ guests, serving the market segment for larger families or group travel in Bear Creek.
- On average, properties in Bear Creek are equipped to host 3.9 guests.
Bear Creek Airbnb Booking Patterns (2026): Available vs. Booked Days
Available Days Distribution
Booked Days Distribution
Booking Pattern Insights for Bear Creek
- The most common availability pattern in Bear Creek falls within the 181-270 days range, representing 62.2% of listings. This suggests many properties have significant open periods on their calendars.
- Approximately 95.9% of listings show high availability (181+ days open annually), indicating potential for increased bookings or specific owner usage patterns.
- For booked days, the 91-180 days range is most frequent in Bear Creek (63.3%), reflecting common guest stay durations or potential owner blocking patterns.
- A notable 4.1% of properties secure long booking periods (181+ days booked per year), highlighting successful long-term rental strategies or significant owner usage.
Bear Creek Airbnb Minimum Stay Requirements Analysis
Distribution of Listings by Minimum Night Requirement
1 Night
44 listings
44.9% of total
2 Nights
17 listings
17.3% of total
7-29 Nights
1 listings
1% of total
30+ Nights
36 listings
36.7% of total
Key Insights
- The most prevalent minimum stay requirement in Bear Creek is 1 Night, adopted by 44.9% of listings. This highlights the market's preference for shorter, flexible bookings.
- A strong majority (62.2%) of the Bear Creek Airbnb data shows acceptance of very short stays (1-2 nights), indicating a dynamic, high-turnover market.
- A significant segment (36.7%) caters to monthly stays (30+ nights) in Bear Creek, pointing to opportunities in the extended-stay market.
Recommendations
- Align with the market by considering a 1 Night minimum stay, as 44.9% of Bear Creek hosts use this setting.
- Explore offering discounts for stays of 30+ nights to attract the 36.7% of the market seeking extended stays.
- Adjust minimum nights based on seasonality – potentially shorter during low season and longer during peak demand periods in Bear Creek.
Bear Creek Airbnb Cancellation Policy Trends Analysis (2026)
Super Strict 30 Days
8 listings
8.2% of total
Super Strict 60 Days
2 listings
2% of total
Flexible
13 listings
13.3% of total
Moderate
19 listings
19.4% of total
Firm
43 listings
43.9% of total
Strict
13 listings
13.3% of total
Cancellation Policy Insights for Bear Creek
- The prevailing Airbnb cancellation policy trend in Bear Creek is Firm, used by 43.9% of listings.
- A majority (57.2%) of hosts in Bear Creek utilize Firm or Strict policies, indicating a market where hosts prioritize booking security.
Recommendations for Hosts
- Consider adopting a Firm policy to align with the 43.9% market standard in Bear Creek.
- Using a Strict policy might deter some guests, as only 13.3% of listings use it. Evaluate if potential revenue protection outweighs possible lower booking rates.
- Regularly review your cancellation policy against competitors and market demand shifts in Bear Creek.
Bear Creek STR Booking Lead Time Analysis (2026)
Average Booking Lead Time by Month
Booking Lead Time Insights for Bear Creek
- The overall average booking lead time for vacation rentals in Bear Creek is 106 days.
- Guests book furthest in advance for stays during April (average 128 days), likely coinciding with peak travel demand or local events.
- The shortest booking windows occur for stays in January (average 3 days), indicating more last-minute travel plans during this time.
- Seasonally, Summer (113 days avg.) sees the longest lead times, while Winter (22 days avg.) has the shortest, reflecting typical travel planning cycles.
Recommendations for Hosts
- Use the overall average lead time (106 days) as a baseline for your pricing and availability strategy in Bear Creek.
- For April stays, consider implementing length-of-stay discounts or slightly higher rates for bookings made less than 128 days out to capitalize on advance planning.
- During January, focus on last-minute booking availability and promotions, as guests book with very short notice (3 days avg.).
- Target marketing efforts for the Summer season well in advance (at least 113 days) to capture early planners.
- Monitor your own booking lead times against these Bear Creek averages to identify opportunities for dynamic pricing adjustments.
Popular & Essential Airbnb Amenities in Bear Creek (2026)
Amenity Prevalence
Amenity Insights for Bear Creek
- Popular amenities like Heating, Free parking on premises, Essentials are common but not universal. Offering these can provide a competitive edge.
- Warning: Wifi is not universally provided but is considered essential globally. Ensure reliable Wifi is offered.
Recommendations for Hosts
- Consider adding popular differentiators like Heating or Free parking on premises to increase appeal.
- Highlight unique or less common amenities you offer (e.g., hot tub, dedicated workspace, EV charger) in your listing description and photos.
- Regularly check competitor amenities in Bear Creek to stay competitive.
Bear Creek Airbnb Guest Demographics & Profile Analysis (2026)
Guest Profile Summary for Bear Creek
- The typical guest profile for Airbnb in Bear Creek consists of primarily domestic travelers (94%), often arriving from nearby Anchorage, typically belonging to the Post-2000s (Gen Z/Alpha) group (50%), primarily speaking English or Spanish.
- Domestic travelers account for 93.7% of guests.
- Key international markets include United States (93.7%) and Canada (0.8%).
- Top languages spoken are English (68.8%) followed by Spanish (8.8%).
- A significant demographic segment is the Post-2000s (Gen Z/Alpha) group, representing 50% of guests.
Recommendations for Hosts
- Target domestic marketing efforts towards travelers from Anchorage and Los Angeles.
- Tailor amenities and listing descriptions to appeal to the dominant Post-2000s (Gen Z/Alpha) demographic (e.g., highlight fast WiFi, smart home features, local guides).
- Highlight unique local experiences or amenities relevant to the primary guest profile.
- Consider seasonal promotions aligned with peak travel times for key origin markets.
Nearby Short-Term Rental Market Comparison
How does the Bear Creek Airbnb market stack up against its neighbors? Compare key performance metrics like average monthly revenue, ADR, and occupancy rates in surrounding areas to understand the broader regional STR landscape.
| Market | Active Properties | Monthly Revenue | Daily Rate | Avg. Occupancy |
|---|---|---|---|---|
| Seward | 271 | $3,520 | $323.80 | 53% |
| Cooper Landing | 94 | $3,245 | $341.32 | 50% |
| Girdwood | 199 | $2,957 | $325.37 | 40% |
| Woodrow | 98 | $2,545 | $280.90 | 52% |
| Wasilla | 296 | $2,360 | $212.22 | 48% |
| Anchorage | 2,099 | $2,324 | $218.00 | 49% |
| Palmer | 310 | $2,181 | $208.17 | 45% |
| Moose Pass | 18 | $1,937 | $283.21 | 43% |
| Houston | 30 | $1,668 | $195.80 | 36% |
| Sterling | 94 | $1,605 | $269.68 | 42% |