Anchorage Airbnb Market Analysis 2026: Short Term Rental Data & Vacation Rental Statistics in Alaska, United States
Is Airbnb profitable in Anchorage in 2026? Explore comprehensive Airbnb analytics for Anchorage, Alaska, United States to uncover income potential. This 2026 STR market report for Anchorage, based on AirROI data from February 2025 to January 2026, reveals key trends in the bustling market of 2,099 active listings.
Whether you're considering an Airbnb investment in Anchorage, optimizing your existing vacation rental, or exploring rental arbitrage opportunities, understanding the Anchorage Airbnb data is crucial. Leveraging the low regulation environment is key to maximizing your short term rental income potential. Let's dive into the specifics.
Key Anchorage Airbnb Performance Metrics Overview
Monthly Airbnb Revenue Variations & Income Potential in Anchorage (2026)
Understanding the monthly revenue variations for Airbnb listings in Anchorage is key to maximizing your short term rental income potential. Seasonality significantly impacts earnings. Our analysis, based on data from the past 12 months, shows that the peak revenue month for STRs in Anchorage is typically July, while February often presents the lowest earnings, highlighting opportunities for strategic pricing adjustments during shoulder and low seasons. Explore the typical Airbnb income in Anchorage across different performance tiers:
- Best-in-class properties (Top 10%) achieve $6,037+ monthly, often utilizing dynamic pricing and superior guest experiences.
- Strong performing properties (Top 25%) earn $4,098 or more, indicating effective management and desirable locations/amenities.
- Typical properties (Median) generate around $2,683 per month, representing the average market performance.
- Entry-level properties (Bottom 25%) see earnings around $1,487, often with potential for optimization.
Average Monthly Airbnb Earnings Trend in Anchorage
Anchorage Airbnb Occupancy Rate Trends (2026)
Maximize your bookings by understanding the Anchorage STR occupancy trends. Seasonal demand shifts significantly influence how often properties are booked. Typically, Julysees the highest demand (peak season occupancy), while January experiences the lowest (low season). Effective strategies, like adjusting minimum stays or offering promotions, can boost occupancy during slower periods. Here's how different property tiers perform in Anchorage:
- Best-in-class properties (Top 10%) achieve 85%+ occupancy, indicating high desirability and potentially optimized availability.
- Strong performing properties (Top 25%) maintain 72% or higher occupancy, suggesting good market fit and guest satisfaction.
- Typical properties (Median) have an occupancy rate around 51%.
- Entry-level properties (Bottom 25%) average 28% occupancy, potentially facing higher vacancy.
Average Monthly Occupancy Rate Trend in Anchorage
Average Daily Rate (ADR) Airbnb Trends in Anchorage (2026)
Effective short term rental pricing strategy in Anchorage involves understanding monthly ADR fluctuations. The Average Daily Rate (ADR) for Airbnb in Anchorage typically peaks in June and dips lowest during February. Leveraging Airbnb dynamic pricing tools or strategies based on this seasonality can significantly boost revenue. Here's a look at the typical nightly rates achieved:
- Best-in-class properties (Top 10%) command rates of $378+ per night, often due to premium features or locations.
- Strong performing properties (Top 25%) achieve nightly rates of $248 or more.
- Typical properties (Median) charge around $174 per night.
- Entry-level properties (Bottom 25%) earn around $126 per night.
Average Daily Rate (ADR) Trend by Month in Anchorage
Get Live Anchorage Market Intelligence 👇

Explore Real-time Analytics
Airbnb Seasonality Analysis & Trends in Anchorage (2026)
Peak Season (July, June, August)
- Revenue averages $5,080 per month
- Occupancy rates average 65.5%
- Daily rates average $239
Shoulder Season
- Revenue averages $2,804 per month
- Occupancy maintains around 46.8%
- Daily rates hold near $215
Low Season (January, February, April)
- Revenue drops to average $2,119 per month
- Occupancy decreases to average 41.8%
- Daily rates adjust to average $199
Seasonality Insights for Anchorage
- The Airbnb seasonality in Anchorage shows highly seasonal trends requiring careful strategy. While the sections above show seasonal averages, it's also insightful to look at the extremes:
- During the high season, the absolute peak month showcases Anchorage's highest earning potential, with monthly revenues capable of climbing to $5,270, occupancy reaching a high of 66.6%, and ADRs peaking at $242.
- Conversely, the slowest single month of the year, typically falling within the low season, marks the market's lowest point. In this month, revenue might dip to $2,027, occupancy could drop to 35.7%, and ADRs may adjust down to $188.
- Understanding both the seasonal averages and these monthly peaks and troughs in revenue, occupancy, and ADR is crucial for maximizing your Airbnb profit potential in Anchorage.
Seasonal Strategies for Maximizing Profit
- Peak Season: Maximize revenue through premium pricing and potentially longer minimum stays. Ensure high availability.
- Low Season: Offer competitive pricing, special promotions (e.g., extended stay discounts), and flexible cancellation policies. Target off-season travelers like remote workers or budget-conscious guests.
- Shoulder Seasons: Implement dynamic pricing that balances peak and low rates. Target weekend travelers or specific events. Offer slightly more flexible terms than peak season.
- Regularly analyze your own performance against these Anchorage seasonality benchmarks and adjust your pricing and availability strategy accordingly.
Best Areas for Airbnb Investment in Anchorage (2026)
Exploring the top neighborhoods for short-term rentals in Anchorage? This section highlights key areas, outlining why they are attractive for hosts and guests, along with notable local attractions. Consider these locations based on your target guest profile and investment strategy.
| Neighborhood / Area | Why Host Here? (Target Guests & Appeal) | Key Attractions & Landmarks |
|---|---|---|
| Downtown Anchorage | The city’s urban center with access to restaurants, shopping, and attractions. Great for visitors looking for city life amid stunning mountain views. | Anchorage Museum, Alaska Native Heritage Center, Ship Creek, 5th Avenue Mall, Tony Knowles Coastal Trail |
| Turnagain Arm | Known for its breathtaking views and outdoor activities. Perfect for nature lovers and those wanting an experience close to water and mountains. | Turnagain Arm Drive, Potter Marsh Bird Sanctuary, Kincaid Park, Beluga Point, Hope Point |
| South Anchorage | Family-friendly area with parks and outdoor activities. Ideal for tourists seeking a quieter experience with access to local amenities. | Baxter Bog, Kincaid Park, Hillside Park, South Anchorage Sports Complex, Tony Knowles Coastal Trail |
| Alaska Railroad Station | A hub for train travel enthusiasts, providing unique access to scenic railroads and outdoor adventures. | Alaska Railroad, Train rides to Seward and Denali, Nearby parks and trails, Girdwood Trail System, Wildlife viewing areas |
| Airport Heights | Residential area close to Ted Stevens Anchorage International Airport, making it convenient for travelers. | Airport Park, Nearby cafes and restaurants, Quick access to downtown, Anchorage Memorial Park, Flattop Mountain Trailhead |
| Wasilla | One of the fastest growing areas near Anchorage, popular for its outdoor recreation and small-town charm. | Wasilla Lake, Iditarod Trail Sled Dog Museum, Knik River, Local parks, Shopping centers |
| Exchange District | A vibrant area with nightlife, dining, and events, appealing to young travelers. | Ulu Factory, Downtown nightlife, Art galleries, Food trucks, Cultural events |
| Eagle River | A suburban area offering outdoor activities and family-friendly options, great for travelers looking for a home-like feel. | Eagle River Nature Center, Nearby hiking and biking trails, Local shopping areas, Scenic views of the Chugach Mountains, Eagle River Park |
Understanding Airbnb License Requirements & STR Laws in Anchorage (2026)
While Anchorage, Alaska, United States currently shows low STR regulations, specific Airbnb license requirements might still exist or change. Always verify the latest short term rental regulations and Airbnb license requirements directly with local government authorities for Anchorage to ensure full compliance before hosting.
(Source: AirROI data, 2026, based on 0% licensed listings)
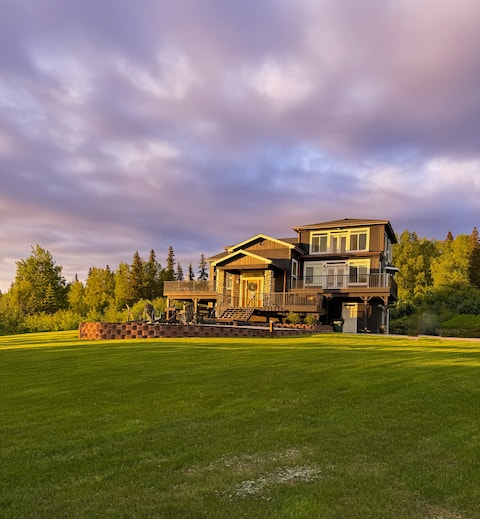
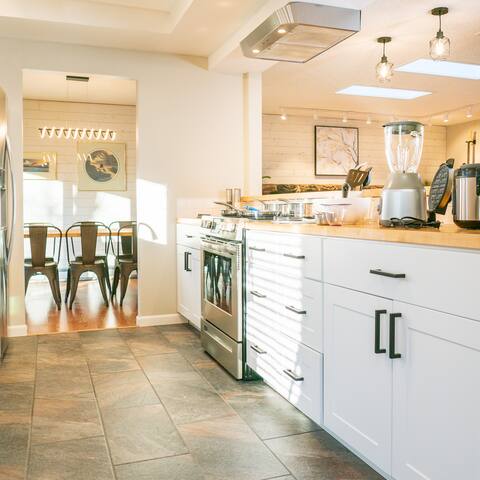
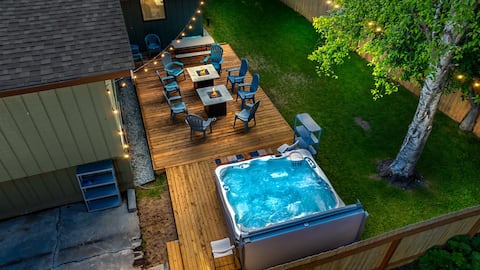
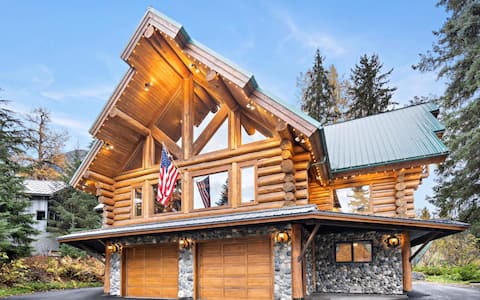
Top Performing Airbnb Properties in Anchorage (2026)
Benchmark your potential! Explore examples of top-performing Airbnb properties in Anchoragebased on Trailing Twelve Month (TTM) revenue. Analyze their characteristics, revenue, occupancy rate, and ADR to understand what drives success in this market.
Spacious Mountain Retreat- Hot Tub, Beautiful View
Entire Place • 5 bedrooms
Incredible Cinema, Warm Sauna, Relaxing King Beds!
Entire Place • 5 bedrooms
Cozy Spacious 4-Level Home | XL HotTub
Entire Place • 6 bedrooms
Misty Pines Lodge - Premier Mountainside Lodge
Entire Place • 5 bedrooms
(p)tarmigan ROOST: Luxury Mountain Lodge
Entire Place • 7 bedrooms

Unwind and Recharge in Anchorage
Entire Place • 4 bedrooms
Note: Performance varies based on location, size, amenities, seasonality, and management quality. Data reflects the past 12 months.
Top Performing Airbnb Hosts in Anchorage (2026)
Learn from the best! This table showcases top-performing Airbnb hosts in Anchorage based on the number of properties managed and estimated total revenue over the past year. Analyze their scale and performance metrics.
| Host Name | Properties | Grossing Revenue | Stay Reviews | Avg Rating |
|---|---|---|---|---|
| Casa Rentals | 48 | $2,076,162 | 2355 | 4.87/5.0 |
| Evolve | 47 | $1,346,955 | 1526 | 4.68/5.0 |
| Whitney | 31 | $1,272,872 | 3174 | 4.84/5.0 |
| Outpost Vacation Rentals | 26 | $844,968 | 1126 | 4.84/5.0 |
| Johanna | 21 | $604,360 | 3542 | 4.85/5.0 |
| Jeff | 29 | $550,044 | 679 | 4.77/5.0 |
| Aaron | 3 | $524,416 | 315 | 5.00/5.0 |
| Troy | 24 | $524,281 | 1852 | 4.94/5.0 |
| Chugach Properties | 7 | $514,171 | 139 | 4.94/5.0 |
| Nathan | 12 | $509,209 | 598 | 4.84/5.0 |
Analyzing the strategies of top hosts, such as their property selection, pricing, and guest communication, can offer valuable lessons for optimizing your own Airbnb operations in Anchorage.
Dive Deeper: Advanced Anchorage STR Market Data (2026)
Ready to unlock more insights? AirROI provides access to advanced metrics and comprehensive Airbnb data for Anchorage. Explore detailed analytics beyond this report to refine your investment strategy, optimize pricing, and maximize your vacation rental profits.
Explore Advanced MetricsAnchorage Short-Term Rental Market Composition (2026): Property & Room Types
Room Type Distribution
Property Type Distribution
Market Composition Insights for Anchorage
- The Anchorage Airbnb market composition is heavily skewed towards Entire Home/Apt listings, which make up 86.8% of the 2,099 active rentals. This indicates strong guest preference for privacy and space.
- Looking at the property type distribution in Anchorage, House properties are the most common (45.6%), reflecting the local real estate landscape.
- Houses represent a significant 45.6% portion, catering likely to families or larger groups.
- Smaller segments like hotel/boutique, outdoor/unique, unique stays (combined 7.5%) offer potential for unique stay experiences.
Anchorage Airbnb Room Capacity Analysis (2026): Bedroom Distribution
Distribution of Listings by Number of Bedrooms
Room Capacity Insights for Anchorage
- The dominant room capacity in Anchorage is 2 bedrooms listings, making up 33% of the market. This suggests a strong demand for properties suitable for couples or solo travelers.
- Together, 2 bedrooms and 1 bedroom properties represent 59.2% of the active Airbnb listings in Anchorage, indicating a high concentration in these sizes.
- A significant 26.9% of listings offer 3+ bedrooms, catering to larger groups and families seeking more space in Anchorage.
Anchorage Vacation Rental Guest Capacity Trends (2026)
Distribution of Listings by Guest Capacity
Guest Capacity Insights for Anchorage
- The most common guest capacity trend in Anchorage vacation rentals is listings accommodating 4 guests (26.2%). This suggests the primary traveler segment is likely small families or groups.
- Properties designed for 4 guests and 2 guests dominate the Anchorage STR market, accounting for 44.0% of listings.
- 33.6% of properties accommodate 6+ guests, serving the market segment for larger families or group travel in Anchorage.
- On average, properties in Anchorage are equipped to host 4.2 guests.
Anchorage Airbnb Booking Patterns (2026): Available vs. Booked Days
Available Days Distribution
Booked Days Distribution
Booking Pattern Insights for Anchorage
- The most common availability pattern in Anchorage falls within the 181-270 days range, representing 36.8% of listings. This suggests many properties have significant open periods on their calendars.
- Approximately 71.7% of listings show high availability (181+ days open annually), indicating potential for increased bookings or specific owner usage patterns.
- For booked days, the 91-180 days range is most frequent in Anchorage (37.7%), reflecting common guest stay durations or potential owner blocking patterns.
- A notable 28.8% of properties secure long booking periods (181+ days booked per year), highlighting successful long-term rental strategies or significant owner usage.
Anchorage Airbnb Minimum Stay Requirements Analysis
Distribution of Listings by Minimum Night Requirement
1 Night
846 listings
40.3% of total
2 Nights
410 listings
19.6% of total
3 Nights
152 listings
7.2% of total
4-6 Nights
67 listings
3.2% of total
7-29 Nights
93 listings
4.4% of total
30+ Nights
529 listings
25.2% of total
Key Insights
- The most prevalent minimum stay requirement in Anchorage is 1 Night, adopted by 40.3% of listings. This highlights the market's preference for shorter, flexible bookings.
- A significant segment (25.2%) caters to monthly stays (30+ nights) in Anchorage, pointing to opportunities in the extended-stay market.
Recommendations
- Align with the market by considering a 1 Night minimum stay, as 40.3% of Anchorage hosts use this setting.
- Explore offering discounts for stays of 30+ nights to attract the 25.2% of the market seeking extended stays.
- Adjust minimum nights based on seasonality – potentially shorter during low season and longer during peak demand periods in Anchorage.
Anchorage Airbnb Cancellation Policy Trends Analysis (2026)
Super Strict 60 Days
5 listings
0.2% of total
Super Strict 30 Days
38 listings
1.8% of total
Limited
24 listings
1.1% of total
Flexible
445 listings
21.3% of total
Moderate
663 listings
31.7% of total
Firm
630 listings
30.1% of total
Strict
287 listings
13.7% of total
Cancellation Policy Insights for Anchorage
- The prevailing Airbnb cancellation policy trend in Anchorage is Moderate, used by 31.7% of listings.
- There's a relatively balanced mix between guest-friendly (53.0%) and stricter (43.8%) policies, offering choices for different guest needs.
Recommendations for Hosts
- Consider adopting a Moderate policy to align with the 31.7% market standard in Anchorage.
- Using a Strict policy might deter some guests, as only 13.7% of listings use it. Evaluate if potential revenue protection outweighs possible lower booking rates.
- Regularly review your cancellation policy against competitors and market demand shifts in Anchorage.
Anchorage STR Booking Lead Time Analysis (2026)
Average Booking Lead Time by Month
Booking Lead Time Insights for Anchorage
- The overall average booking lead time for vacation rentals in Anchorage is 48 days.
- Guests book furthest in advance for stays during July (average 74 days), likely coinciding with peak travel demand or local events.
- The shortest booking windows occur for stays in January (average 24 days), indicating more last-minute travel plans during this time.
- Seasonally, Summer (69 days avg.) sees the longest lead times, while Winter (29 days avg.) has the shortest, reflecting typical travel planning cycles.
Recommendations for Hosts
- Use the overall average lead time (48 days) as a baseline for your pricing and availability strategy in Anchorage.
- For July stays, consider implementing length-of-stay discounts or slightly higher rates for bookings made less than 74 days out to capitalize on advance planning.
- Target marketing efforts for the Summer season well in advance (at least 69 days) to capture early planners.
- Monitor your own booking lead times against these Anchorage averages to identify opportunities for dynamic pricing adjustments.
Popular & Essential Airbnb Amenities in Anchorage (2026)
Amenity Prevalence
Amenity Insights for Anchorage
- Essential amenities in Anchorage that guests expect include: Smoke alarm, Wifi, Carbon monoxide alarm, Free parking on premises, TV. Lacking these (any) could significantly impact bookings.
- Popular amenities like Heating, Fire extinguisher, Kitchen are common but not universal. Offering these can provide a competitive edge.
Recommendations for Hosts
- Ensure your listing includes all essential amenities for Anchorage: Smoke alarm, Wifi, Carbon monoxide alarm, Free parking on premises, TV.
- Prioritize adding missing essentials: Smoke alarm, Wifi, Carbon monoxide alarm, Free parking on premises, TV.
- Consider adding popular differentiators like Heating or Fire extinguisher to increase appeal.
- Highlight unique or less common amenities you offer (e.g., hot tub, dedicated workspace, EV charger) in your listing description and photos.
- Regularly check competitor amenities in Anchorage to stay competitive.
Anchorage Airbnb Guest Demographics & Profile Analysis (2026)
Guest Profile Summary for Anchorage
- The typical guest profile for Airbnb in Anchorage consists of primarily domestic travelers (93%), often arriving from nearby Fairbanks, typically belonging to the Post-2000s (Gen Z/Alpha) group (50%), primarily speaking English or Spanish.
- Domestic travelers account for 93.0% of guests.
- Key international markets include United States (93%) and Canada (1.3%).
- Top languages spoken are English (71%) followed by Spanish (9.3%).
- A significant demographic segment is the Post-2000s (Gen Z/Alpha) group, representing 50% of guests.
Recommendations for Hosts
- Target domestic marketing efforts towards travelers from Fairbanks and Anchorage.
- Tailor amenities and listing descriptions to appeal to the dominant Post-2000s (Gen Z/Alpha) demographic (e.g., highlight fast WiFi, smart home features, local guides).
- Highlight unique local experiences or amenities relevant to the primary guest profile.
- Consider seasonal promotions aligned with peak travel times for key origin markets.
Nearby Short-Term Rental Market Comparison
How does the Anchorage Airbnb market stack up against its neighbors? Compare key performance metrics like average monthly revenue, ADR, and occupancy rates in surrounding areas to understand the broader regional STR landscape.
| Market | Active Properties | Monthly Revenue | Daily Rate | Avg. Occupancy |
|---|---|---|---|---|
| Seward | 271 | $3,520 | $323.80 | 53% |
| Cooper Landing | 94 | $3,245 | $341.32 | 50% |
| Girdwood | 199 | $2,957 | $325.37 | 40% |
| Trapper Creek | 25 | $2,569 | $271.80 | 40% |
| Woodrow | 98 | $2,545 | $280.90 | 52% |
| Bear Creek | 98 | $2,489 | $243.13 | 54% |
| Wasilla | 296 | $2,360 | $212.22 | 48% |
| Talkeetna | 213 | $2,256 | $213.55 | 44% |
| Palmer | 310 | $2,181 | $208.17 | 45% |
| Moose Pass | 18 | $1,937 | $283.21 | 43% |