Mobile Airbnb Market Analysis 2026: Short Term Rental Data & Vacation Rental Statistics in Alabama, United States
Is Airbnb profitable in Mobile in 2026? Explore comprehensive Airbnb analytics for Mobile, Alabama, United States to uncover income potential. This 2026 STR market report for Mobile, based on AirROI data from February 2025 to January 2026, reveals key trends in the market of 494 active listings.
Whether you're considering an Airbnb investment in Mobile, optimizing your existing vacation rental, or exploring rental arbitrage opportunities, understanding the Mobile Airbnb data is crucial. Leveraging the low regulation environment is key to maximizing your short term rental income potential. Let's dive into the specifics.
Key Mobile Airbnb Performance Metrics Overview
Monthly Airbnb Revenue Variations & Income Potential in Mobile (2026)
Understanding the monthly revenue variations for Airbnb listings in Mobile is key to maximizing your short term rental income potential. Seasonality significantly impacts earnings. Our analysis, based on data from the past 12 months, shows that the peak revenue month for STRs in Mobile is typically July, while January often presents the lowest earnings, highlighting opportunities for strategic pricing adjustments during shoulder and low seasons. Explore the typical Airbnb income in Mobile across different performance tiers:
- Best-in-class properties (Top 10%) achieve $4,396+ monthly, often utilizing dynamic pricing and superior guest experiences.
- Strong performing properties (Top 25%) earn $3,084 or more, indicating effective management and desirable locations/amenities.
- Typical properties (Median) generate around $1,865 per month, representing the average market performance.
- Entry-level properties (Bottom 25%) see earnings around $927, often with potential for optimization.
Average Monthly Airbnb Earnings Trend in Mobile
Mobile Airbnb Occupancy Rate Trends (2026)
Maximize your bookings by understanding the Mobile STR occupancy trends. Seasonal demand shifts significantly influence how often properties are booked. Typically, Julysees the highest demand (peak season occupancy), while January experiences the lowest (low season). Effective strategies, like adjusting minimum stays or offering promotions, can boost occupancy during slower periods. Here's how different property tiers perform in Mobile:
- Best-in-class properties (Top 10%) achieve 80%+ occupancy, indicating high desirability and potentially optimized availability.
- Strong performing properties (Top 25%) maintain 63% or higher occupancy, suggesting good market fit and guest satisfaction.
- Typical properties (Median) have an occupancy rate around 41%.
- Entry-level properties (Bottom 25%) average 21% occupancy, potentially facing higher vacancy.
Average Monthly Occupancy Rate Trend in Mobile
Average Daily Rate (ADR) Airbnb Trends in Mobile (2026)
Effective short term rental pricing strategy in Mobile involves understanding monthly ADR fluctuations. The Average Daily Rate (ADR) for Airbnb in Mobile typically peaks in January and dips lowest during April. Leveraging Airbnb dynamic pricing tools or strategies based on this seasonality can significantly boost revenue. Here's a look at the typical nightly rates achieved:
- Best-in-class properties (Top 10%) command rates of $261+ per night, often due to premium features or locations.
- Strong performing properties (Top 25%) achieve nightly rates of $195 or more.
- Typical properties (Median) charge around $137 per night.
- Entry-level properties (Bottom 25%) earn around $99 per night.
Average Daily Rate (ADR) Trend by Month in Mobile
Get Live Mobile Market Intelligence 👇

Explore Real-time Analytics
Airbnb Seasonality Analysis & Trends in Mobile (2026)
Peak Season (July, June, October)
- Revenue averages $2,505 per month
- Occupancy rates average 46.9%
- Daily rates average $161
Shoulder Season
- Revenue averages $2,272 per month
- Occupancy maintains around 43.2%
- Daily rates hold near $159
Low Season (January, April, September)
- Revenue drops to average $1,931 per month
- Occupancy decreases to average 39.4%
- Daily rates adjust to average $156
Seasonality Insights for Mobile
- The Airbnb seasonality in Mobile shows moderate seasonality with distinct peak and low periods. While the sections above show seasonal averages, it's also insightful to look at the extremes:
- During the high season, the absolute peak month showcases Mobile's highest earning potential, with monthly revenues capable of climbing to $2,642, occupancy reaching a high of 49.6%, and ADRs peaking at $170.
- Conversely, the slowest single month of the year, typically falling within the low season, marks the market's lowest point. In this month, revenue might dip to $1,777, occupancy could drop to 32.7%, and ADRs may adjust down to $144.
- Understanding both the seasonal averages and these monthly peaks and troughs in revenue, occupancy, and ADR is crucial for maximizing your Airbnb profit potential in Mobile.
Seasonal Strategies for Maximizing Profit
- Peak Season: Maximize revenue through premium pricing and potentially longer minimum stays. Ensure high availability.
- Low Season: Offer competitive pricing, special promotions (e.g., extended stay discounts), and flexible cancellation policies. Target off-season travelers like remote workers or budget-conscious guests.
- Shoulder Seasons: Implement dynamic pricing that balances peak and low rates. Target weekend travelers or specific events. Offer slightly more flexible terms than peak season.
- Regularly analyze your own performance against these Mobile seasonality benchmarks and adjust your pricing and availability strategy accordingly.
Best Areas for Airbnb Investment in Mobile (2026)
Exploring the top neighborhoods for short-term rentals in Mobile? This section highlights key areas, outlining why they are attractive for hosts and guests, along with notable local attractions. Consider these locations based on your target guest profile and investment strategy.
| Neighborhood / Area | Why Host Here? (Target Guests & Appeal) | Key Attractions & Landmarks |
|---|---|---|
| Downtown Mobile | Historic district with rich culture and a vibrant atmosphere. Attracts both business travelers and tourists looking to explore the local attractions and nightlife. | USS Alabama Battleship Memorial Park, Mobile Museum of Art, Mobile Symphony Orchestra, Exploreum Science Center, Fort Conde |
| Fairhope | Charming coastal town known for its scenic views and artistic community. Popular with families and couples seeking a relaxing getaway by the bay. | Fairhope Pier, Mobile Bay, Fairhope Museum of History, Gulf State Park, Local art galleries |
| Daphne | Beautiful waterfront city that provides access to nature and outdoor activities. Appeals to those looking for similar options to Fairhope but with a more affordable price point. | Eastern Shore Trail, Daphne Bayfront Park, Village Point Park Preserve, Local seafood restaurants, Muscle Shoals Sound Studio |
| Gulf Shores | Less than an hour away, this area is famous for its stunning beaches and family-friendly activities. A perfect spot for tourists looking to enjoy a beach vacation. | Gulf Shores Public Beach, Gulf State Park, Waterville USA, Alabama Gulf Coast Zoo |
| Old Dauphin Way | Historic neighborhood with beautiful architecture and a quaint feel. Attractive to guests looking for a peaceful, residential experience near downtown. | Historic homes tour, Mobile Botanical Gardens, Local cafes and shops, Langan Park |
| Spanish Fort | Located right by the Mobile Bay, this suburban community is ideal for guests wanting a quiet stay with easy access to water activities and nearby attractions. | Spanish Fort Town Center, Mobile Bay, Historic Blakeley State Park, Local dining options |
| The Battleship Parkway | A scenic drive offering views of Mobile Bay and easy access to outdoor activities. Attracts both tourists and locals looking for a day out. | USS Alabama Battleship, Fairhope and Gulf Shores access, Scenic outdoor areas, Local fishing spots |
| West Mobile | Residential area with a burgeoning dining and shopping scene, great for families or long-term stays. Offers a local experience away from the tourist spots. | Local parks, Shopping centers, Dining options, Family-friendly activities |
Understanding Airbnb License Requirements & STR Laws in Mobile (2026)
While Mobile, Alabama, United States currently shows low STR regulations, specific Airbnb license requirements might still exist or change. Always verify the latest short term rental regulations and Airbnb license requirements directly with local government authorities for Mobile to ensure full compliance before hosting.
(Source: AirROI data, 2026, finding no licensed listings among those analyzed)
Top Performing Airbnb Properties in Mobile (2026)
Benchmark your potential! Explore examples of top-performing Airbnb properties in Mobilebased on Trailing Twelve Month (TTM) revenue. Analyze their characteristics, revenue, occupancy rate, and ADR to understand what drives success in this market.
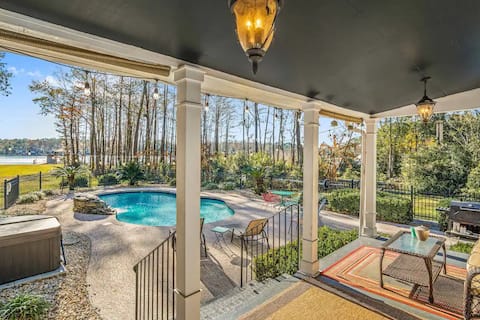
Cypress Grove - Dog River - Heated Pool
Entire Place • 4 bedrooms
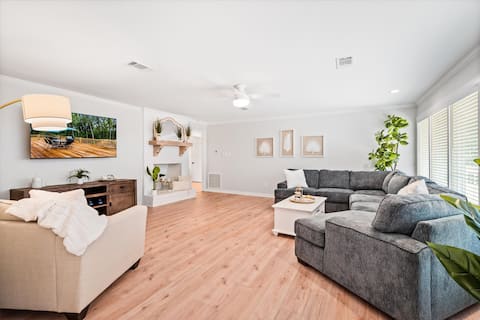
Ansley Manor 5br Home w/ Pool, Hot Tub & Game Room
Entire Place • 5 bedrooms
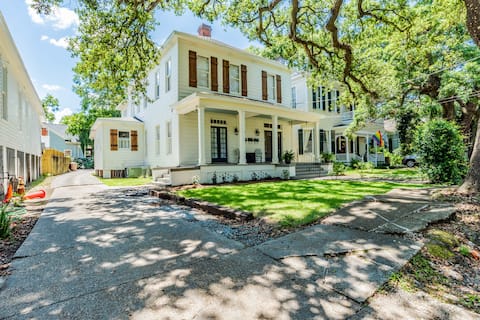
Dreamy Home-3 UNITS; Walk to Mardi Gras; Weddings
Entire Place • 4 bedrooms
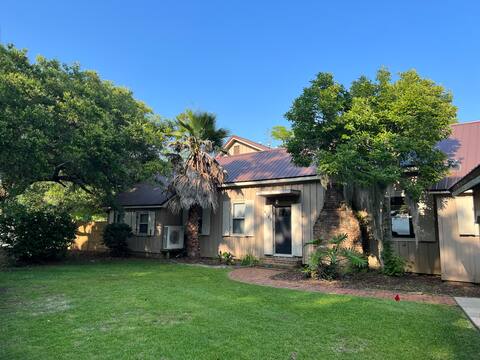
Bay In The Backyard
Entire Place • 3 bedrooms

Waterfront Home w/ Pool, RV Hookup, & River View
Entire Place • 4 bedrooms

Entire Family Home-2 UNITS-Projector&Pet-Friendly
Entire Place • 4 bedrooms
Note: Performance varies based on location, size, amenities, seasonality, and management quality. Data reflects the past 12 months.
Top Performing Airbnb Hosts in Mobile (2026)
Learn from the best! This table showcases top-performing Airbnb hosts in Mobile based on the number of properties managed and estimated total revenue over the past year. Analyze their scale and performance metrics.
| Host Name | Properties | Grossing Revenue | Stay Reviews | Avg Rating |
|---|---|---|---|---|
| Lydia | 21 | $526,780 | 1435 | 4.73/5.0 |
| Kate | 11 | $392,115 | 706 | 4.65/5.0 |
| Katie | 12 | $373,594 | 242 | 4.76/5.0 |
| Rachel | 6 | $257,853 | 346 | 4.58/5.0 |
| Joseph | 6 | $161,396 | 332 | 4.51/5.0 |
| Jeff | 2 | $150,093 | 158 | 4.96/5.0 |
| Todd | 6 | $146,338 | 2276 | 4.75/5.0 |
| Scott | 7 | $137,167 | 1052 | 4.84/5.0 |
| Douglas | 4 | $130,827 | 231 | 4.94/5.0 |
| Josh | 4 | $124,310 | 182 | 4.85/5.0 |
Analyzing the strategies of top hosts, such as their property selection, pricing, and guest communication, can offer valuable lessons for optimizing your own Airbnb operations in Mobile.
Dive Deeper: Advanced Mobile STR Market Data (2026)
Ready to unlock more insights? AirROI provides access to advanced metrics and comprehensive Airbnb data for Mobile. Explore detailed analytics beyond this report to refine your investment strategy, optimize pricing, and maximize your vacation rental profits.
Explore Advanced MetricsMobile Short-Term Rental Market Composition (2026): Property & Room Types
Room Type Distribution
Property Type Distribution
Market Composition Insights for Mobile
- The Mobile Airbnb market composition is heavily skewed towards Entire Home/Apt listings, which make up 89.5% of the 494 active rentals. This indicates strong guest preference for privacy and space.
- Looking at the property type distribution in Mobile, House properties are the most common (62.3%), reflecting the local real estate landscape.
- Houses represent a significant 62.3% portion, catering likely to families or larger groups.
- Smaller segments like hotel/boutique, others, outdoor/unique (combined 7.2%) offer potential for unique stay experiences.
Mobile Airbnb Room Capacity Analysis (2026): Bedroom Distribution
Distribution of Listings by Number of Bedrooms
Room Capacity Insights for Mobile
- The dominant room capacity in Mobile is 2 bedrooms listings, making up 28.9% of the market. This suggests a strong demand for properties suitable for couples or solo travelers.
- Together, 2 bedrooms and 1 bedroom properties represent 57.2% of the active Airbnb listings in Mobile, indicating a high concentration in these sizes.
- A significant 32.2% of listings offer 3+ bedrooms, catering to larger groups and families seeking more space in Mobile.
Mobile Vacation Rental Guest Capacity Trends (2026)
Distribution of Listings by Guest Capacity
Guest Capacity Insights for Mobile
- The most common guest capacity trend in Mobile vacation rentals is listings accommodating 4 guests (30%). This suggests the primary traveler segment is likely small families or groups.
- Properties designed for 4 guests and 8+ guests dominate the Mobile STR market, accounting for 46.6% of listings.
- 35.0% of properties accommodate 6+ guests, serving the market segment for larger families or group travel in Mobile.
- On average, properties in Mobile are equipped to host 4.4 guests.
Mobile Airbnb Booking Patterns (2026): Available vs. Booked Days
Available Days Distribution
Booked Days Distribution
Booking Pattern Insights for Mobile
- The most common availability pattern in Mobile falls within the 271-366 days range, representing 41.7% of listings. This suggests many properties have significant open periods on their calendars.
- Approximately 78.1% of listings show high availability (181+ days open annually), indicating potential for increased bookings or specific owner usage patterns.
- For booked days, the 91-180 days range is most frequent in Mobile (36.4%), reflecting common guest stay durations or potential owner blocking patterns.
- A notable 22.8% of properties secure long booking periods (181+ days booked per year), highlighting successful long-term rental strategies or significant owner usage.
Mobile Airbnb Minimum Stay Requirements Analysis
Distribution of Listings by Minimum Night Requirement
1 Night
163 listings
33% of total
2 Nights
181 listings
36.6% of total
3 Nights
41 listings
8.3% of total
4-6 Nights
7 listings
1.4% of total
7-29 Nights
21 listings
4.3% of total
30+ Nights
81 listings
16.4% of total
Key Insights
- The most prevalent minimum stay requirement in Mobile is 2 Nights, adopted by 36.6% of listings. This highlights the market's preference for shorter, flexible bookings.
- A strong majority (69.6%) of the Mobile Airbnb data shows acceptance of very short stays (1-2 nights), indicating a dynamic, high-turnover market.
- A significant segment (16.4%) caters to monthly stays (30+ nights) in Mobile, pointing to opportunities in the extended-stay market.
Recommendations
- Align with the market by considering a 2 Nights minimum stay, as 36.6% of Mobile hosts use this setting.
- Explore offering discounts for stays of 30+ nights to attract the 16.4% of the market seeking extended stays.
- Adjust minimum nights based on seasonality – potentially shorter during low season and longer during peak demand periods in Mobile.
Mobile Airbnb Cancellation Policy Trends Analysis (2026)
Super Strict 60 Days
1 listings
0.2% of total
Super Strict 30 Days
1 listings
0.2% of total
Limited
16 listings
3.3% of total
Flexible
136 listings
27.7% of total
Moderate
181 listings
36.9% of total
Firm
124 listings
25.3% of total
Strict
32 listings
6.5% of total
Cancellation Policy Insights for Mobile
- The prevailing Airbnb cancellation policy trend in Mobile is Moderate, used by 36.9% of listings.
- There's a relatively balanced mix between guest-friendly (64.6%) and stricter (31.8%) policies, offering choices for different guest needs.
- Strict cancellation policies are quite rare (6.5%), potentially making listings with this policy less competitive unless justified by high demand or property type.
Recommendations for Hosts
- Consider adopting a Moderate policy to align with the 36.9% market standard in Mobile.
- Using a Strict policy might deter some guests, as only 6.5% of listings use it. Evaluate if potential revenue protection outweighs possible lower booking rates.
- Regularly review your cancellation policy against competitors and market demand shifts in Mobile.
Mobile STR Booking Lead Time Analysis (2026)
Average Booking Lead Time by Month
Booking Lead Time Insights for Mobile
- The overall average booking lead time for vacation rentals in Mobile is 33 days.
- Guests book furthest in advance for stays during February (average 60 days), likely coinciding with peak travel demand or local events.
- The shortest booking windows occur for stays in September (average 18 days), indicating more last-minute travel plans during this time.
- Seasonally, Winter (42 days avg.) sees the longest lead times, while Fall (24 days avg.) has the shortest, reflecting typical travel planning cycles.
Recommendations for Hosts
- Use the overall average lead time (33 days) as a baseline for your pricing and availability strategy in Mobile.
- For February stays, consider implementing length-of-stay discounts or slightly higher rates for bookings made less than 60 days out to capitalize on advance planning.
- Target marketing efforts for the Winter season well in advance (at least 42 days) to capture early planners.
- Monitor your own booking lead times against these Mobile averages to identify opportunities for dynamic pricing adjustments.
Popular & Essential Airbnb Amenities in Mobile (2026)
Amenity Prevalence
Amenity Insights for Mobile
- Essential amenities in Mobile that guests expect include: Wifi, Air conditioning, Smoke alarm, TV. Lacking these (any) could significantly impact bookings.
- Popular amenities like Heating, Free parking on premises, Kitchen are common but not universal. Offering these can provide a competitive edge.
Recommendations for Hosts
- Ensure your listing includes all essential amenities for Mobile: Wifi, Air conditioning, Smoke alarm, TV.
- Prioritize adding missing essentials: Wifi, Air conditioning, Smoke alarm, TV.
- Consider adding popular differentiators like Heating or Free parking on premises to increase appeal.
- Highlight unique or less common amenities you offer (e.g., hot tub, dedicated workspace, EV charger) in your listing description and photos.
- Regularly check competitor amenities in Mobile to stay competitive.
Mobile Airbnb Guest Demographics & Profile Analysis (2026)
Guest Profile Summary for Mobile
- The typical guest profile for Airbnb in Mobile consists of primarily domestic travelers (97%), often arriving from nearby Mobile, typically belonging to the Post-2000s (Gen Z/Alpha) group (50%), primarily speaking English or Spanish.
- Domestic travelers account for 96.6% of guests.
- Key international markets include United States (96.6%) and United Kingdom (0.6%).
- Top languages spoken are English (76.9%) followed by Spanish (12%).
- A significant demographic segment is the Post-2000s (Gen Z/Alpha) group, representing 50% of guests.
Recommendations for Hosts
- Target domestic marketing efforts towards travelers from Mobile and Birmingham.
- Tailor amenities and listing descriptions to appeal to the dominant Post-2000s (Gen Z/Alpha) demographic (e.g., highlight fast WiFi, smart home features, local guides).
- Highlight unique local experiences or amenities relevant to the primary guest profile.
- Consider seasonal promotions aligned with peak travel times for key origin markets.
Nearby Short-Term Rental Market Comparison
How does the Mobile Airbnb market stack up against its neighbors? Compare key performance metrics like average monthly revenue, ADR, and occupancy rates in surrounding areas to understand the broader regional STR landscape.
| Market | Active Properties | Monthly Revenue | Daily Rate | Avg. Occupancy |
|---|---|---|---|---|
| Plaquemines Parish | 28 | $4,733 | $413.26 | 40% |
| Perdido Beach | 10 | $4,353 | $297.45 | 51% |
| Pensacola Beach | 968 | $4,082 | $443.49 | 39% |
| Gulf Shores | 4,957 | $3,593 | $385.93 | 40% |
| Baldwin County | 18 | $3,536 | $453.18 | 36% |
| Dauphin Island | 612 | $3,407 | $376.02 | 38% |
| Fairhope | 201 | $3,335 | $295.20 | 43% |
| Orange Beach | 4,106 | $3,271 | $396.08 | 37% |
| Escambia County | 115 | $3,028 | $443.63 | 38% |
| Gulf Breeze | 563 | $2,972 | $333.27 | 41% |