Irondale Airbnb Market Analysis 2025: Short Term Rental Data & Vacation Rental Statistics in Alabama, United States
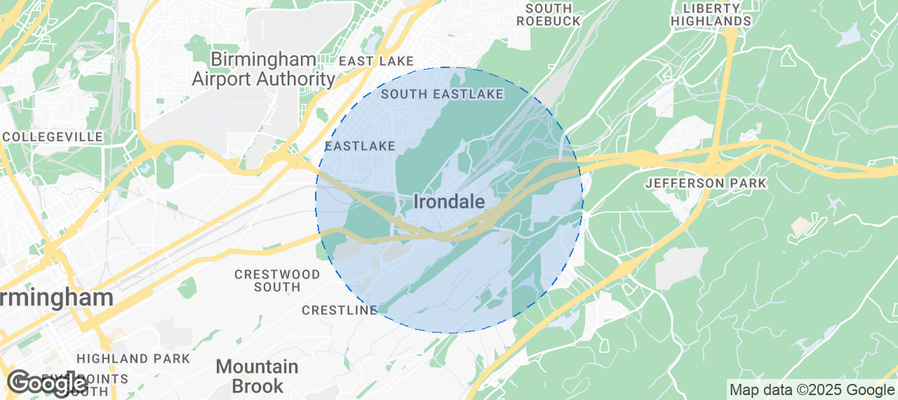
Is Airbnb profitable in Irondale in 2025? Explore comprehensive Airbnb analytics for Irondale, Alabama, United States to uncover income potential. This 2025 STR market report for Irondale, based on AirROI data from August 2024 to July 2025, reveals key trends in the niche market of 19 active listings.
Whether you're considering an Airbnb investment in Irondale, optimizing your existing vacation rental, or exploring rental arbitrage opportunities, understanding the Irondale Airbnb data is crucial. Understanding the local regulations is key to maximizing your short term rental income potential. Let's dive into the specifics.
Key Irondale Airbnb Performance Metrics Overview
Monthly Airbnb Revenue Variations & Income Potential in Irondale (2025)
Understanding the monthly revenue variations for Airbnb listings in Irondale is key to maximizing your short term rental income potential. Seasonality significantly impacts earnings. Our analysis, based on data from the past 12 months, shows that the peak revenue month for STRs in Irondale is typically August, while January often presents the lowest earnings, highlighting opportunities for strategic pricing adjustments during shoulder and low seasons. Explore the typical Airbnb income in Irondale across different performance tiers:
- Best-in-class properties (Top 10%) achieve $4,961+ monthly, often utilizing dynamic pricing and superior guest experiences.
- Strong performing properties (Top 25%) earn $2,147 or more, indicating effective management and desirable locations/amenities.
- Typical properties (Median) generate around $1,089 per month, representing the average market performance.
- Entry-level properties (Bottom 25%) see earnings around $506, often with potential for optimization.
Average Monthly Airbnb Earnings Trend in Irondale
Irondale Airbnb Occupancy Rate Trends (2025)
Maximize your bookings by understanding the Irondale STR occupancy trends. Seasonal demand shifts significantly influence how often properties are booked. Typically, Augustsees the highest demand (peak season occupancy), while October experiences the lowest (low season). Effective strategies, like adjusting minimum stays or offering promotions, can boost occupancy during slower periods. Here's how different property tiers perform in Irondale:
- Best-in-class properties (Top 10%) achieve 71%+ occupancy, indicating high desirability and potentially optimized availability.
- Strong performing properties (Top 25%) maintain 57% or higher occupancy, suggesting good market fit and guest satisfaction.
- Typical properties (Median) have an occupancy rate around 36%.
- Entry-level properties (Bottom 25%) average 22% occupancy, potentially facing higher vacancy.
Average Monthly Occupancy Rate Trend in Irondale
Average Daily Rate (ADR) Airbnb Trends in Irondale (2025)
Effective short term rental pricing strategy in Irondale involves understanding monthly ADR fluctuations. The Average Daily Rate (ADR) for Airbnb in Irondale typically peaks in June and dips lowest during March. Leveraging Airbnb dynamic pricing tools or strategies based on this seasonality can significantly boost revenue. Here's a look at the typical nightly rates achieved:
- Best-in-class properties (Top 10%) command rates of $142+ per night, often due to premium features or locations.
- Strong performing properties (Top 25%) achieve nightly rates of $114 or more.
- Typical properties (Median) charge around $83 per night.
- Entry-level properties (Bottom 25%) earn around $38 per night.
Average Daily Rate (ADR) Trend by Month in Irondale
Get Live Irondale Market Intelligence 👇
Explore Real-time Analytics
Airbnb Seasonality Analysis & Trends in Irondale (2025)
Peak Season (August, June, September)
- Revenue averages $2,312 per month
- Occupancy rates average 49.2%
- Daily rates average $94
Shoulder Season
- Revenue averages $1,625 per month
- Occupancy maintains around 41.2%
- Daily rates hold near $90
Low Season (January, October, December)
- Revenue drops to average $1,086 per month
- Occupancy decreases to average 29.7%
- Daily rates adjust to average $91
Seasonality Insights for Irondale
- The Airbnb seasonality in Irondale shows highly seasonal trends requiring careful strategy. While the sections above show seasonal averages, it's also insightful to look at the extremes:
- During the high season, the absolute peak month showcases Irondale's highest earning potential, with monthly revenues capable of climbing to $2,449, occupancy reaching a high of 63.2%, and ADRs peaking at $98.
- Conversely, the slowest single month of the year, typically falling within the low season, marks the market's lowest point. In this month, revenue might dip to $952, occupancy could drop to 24.9%, and ADRs may adjust down to $82.
- Understanding both the seasonal averages and these monthly peaks and troughs in revenue, occupancy, and ADR is crucial for maximizing your Airbnb profit potential in Irondale.
Seasonal Strategies for Maximizing Profit
- Peak Season: Maximize revenue through premium pricing and potentially longer minimum stays. Ensure high availability.
- Low Season: Offer competitive pricing, special promotions (e.g., extended stay discounts), and flexible cancellation policies. Target off-season travelers like remote workers or budget-conscious guests.
- Shoulder Seasons: Implement dynamic pricing that balances peak and low rates. Target weekend travelers or specific events. Offer slightly more flexible terms than peak season.
- Regularly analyze your own performance against these Irondale seasonality benchmarks and adjust your pricing and availability strategy accordingly.
Best Areas for Airbnb Investment in Irondale (2025)
Exploring the top neighborhoods for short-term rentals in Irondale? This section highlights key areas, outlining why they are attractive for hosts and guests, along with notable local attractions. Consider these locations based on your target guest profile and investment strategy.
| Neighborhood / Area | Why Host Here? (Target Guests & Appeal) | Key Attractions & Landmarks |
|---|---|---|
| Irondale Historic District | Rich in history with charming older homes, this area attracts guests interested in local culture and history. Its proximity to regional attractions makes it appealing to various travelers. | Historic Irondale Cafe, Irondale Historical Society, Parks and recreation centers, Regional attractions such as the Birmingham Zoo |
| Highway 78 Corridor | Convenient access to major highways and retail establishments makes this area popular with families and business travelers. It's perfect for visitors seeking easy commutes to Birmingham. | Shopping centers, Local restaurants, Parks nearby, Easy access to transportation routes |
| Woodland Hills | A tranquil residential area that provides a quiet retreat for travelers. It appeals to those looking for a peaceful stay close to nature and outdoor activities. | Parks and hiking trails, Local nature reserves, Community events, Family-friendly environment |
| Leeds | Nearby Leeds offers a growing community vibe and local attractions, making it a great choice for those wanting a mix of suburban and urban experiences. | Barber Motorsports Park, Historic downtown, Local dining options, Staging events in Expo facilities |
| Birmingham Area (East side) | The eastern side of Birmingham, close to Irondale, presents a mix of attractions, dining, and nightlife. Perfect for guests wanting to explore both cities easily. | Downtown Birmingham attractions, Local breweries, Parks and recreation facilities, Cultural experiences |
| Local Parks vicinity | Proximity to parks makes this area popular among visitors who enjoy outdoor activities such as hiking, picnicking, and spending time in nature. | Ruffner Mountain Nature Preserve, Local playgrounds, Wildwood Park, Outdoor recreation |
| Mountain Brook | Adjacent to Irondale, this affluent area is known for its upscale lifestyle, appealing to guests looking for luxury accommodation options. | Shops and boutiques, Fine dining, Beautiful residential areas, Community art events |
| Cahaba Heights | A family-friendly neighborhood that offers a balance of urban and suburban life, perfect for family travelers and visitors seeking a calm atmosphere. | Local schools, Community parks, Suburban shopping districts, Close to Birmingham |
Understanding Airbnb License Requirements & STR Laws in Irondale (2025)
With 11% of listings showing registration in 2025, understanding potential Airbnb license requirements is crucial in Irondale. Always verify the latest short term rental regulations and Airbnb license requirements directly with local government authorities for Irondale to ensure full compliance before hosting.
(Source: AirROI data, 2025, based on 11% licensed listings)
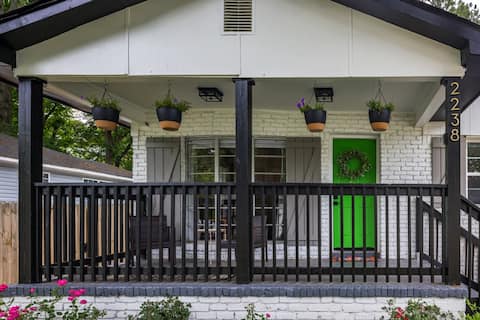
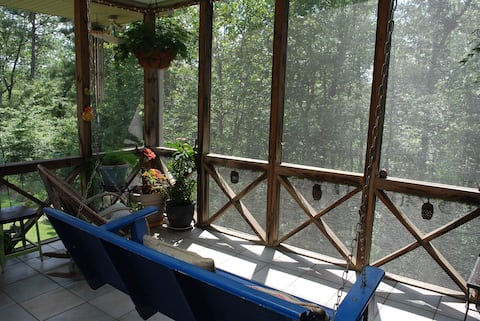
Top Performing Airbnb Properties in Irondale (2025)
Benchmark your potential! Explore examples of top-performing Airbnb properties in Irondalebased on Trailing Twelve Month (TTM) revenue. Analyze their characteristics, revenue, occupancy rate, and ADR to understand what drives success in this market.

The Cabin of Birmingham
Entire Place • 3 bedrooms

A Home Away From Home!
Entire Place • 3 bedrooms
Whistle Stop Bungalow
Entire Place • 3 bedrooms
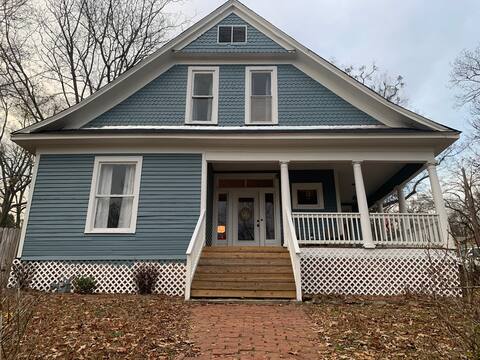
Big Blue House at Whistle Stop
Entire Place • 4 bedrooms
Peaceful, Clean Apartment at our Home
Entire Place • 1 bedroom
House in Wonderful Irondale
Entire Place • 2 bedrooms
Note: Performance varies based on location, size, amenities, seasonality, and management quality. Data reflects the past 12 months.
Top Performing Airbnb Hosts in Irondale (2025)
Learn from the best! This table showcases top-performing Airbnb hosts in Irondale based on the number of properties managed and estimated total revenue over the past year. Analyze their scale and performance metrics.
| Host Name | Properties | Grossing Revenue | Stay Reviews | Avg Rating |
|---|---|---|---|---|
| Terri | 1 | $59,427 | 166 | 4.70/5.0 |
| Lisa | 1 | $10,110 | 28 | 4.50/5.0 |
| Jarrod | 1 | $10,043 | 2 | Not Rated |
| Emma | 1 | $9,993 | 2 | Not Rated |
| Reem H | 2 | $9,693 | 7 | 4.57/5.0 |
| Alan | 1 | $9,311 | 115 | 4.99/5.0 |
| Sectric | 1 | $6,784 | 385 | 4.89/5.0 |
| Carlous | 1 | $4,728 | 7 | 5.00/5.0 |
| Angela | 1 | $4,298 | 187 | 4.94/5.0 |
| Brittany | 4 | $3,843 | 9 | 4.83/5.0 |
Analyzing the strategies of top hosts, such as their property selection, pricing, and guest communication, can offer valuable lessons for optimizing your own Airbnb operations in Irondale.
Dive Deeper: Advanced Irondale STR Market Data (2025)
Ready to unlock more insights? AirROI provides access to advanced metrics and comprehensive Airbnb data for Irondale. Explore detailed analytics beyond this report to refine your investment strategy, optimize pricing, and maximize your vacation rental profits.
Explore Advanced MetricsIrondale Short-Term Rental Market Composition (2025): Property & Room Types
Room Type Distribution
Property Type Distribution
Market Composition Insights for Irondale
- The Irondale Airbnb market composition is heavily skewed towards Entire Home/Apt listings, which make up 52.6% of the 19 active rentals. This indicates strong guest preference for privacy and space.
- However, a notable 47.4% share for Private Rooms suggests opportunities for budget-conscious travelers or hosts renting out spare rooms.
- Looking at the property type distribution in Irondale, House properties are the most common (84.2%), reflecting the local real estate landscape.
- Houses represent a significant 84.2% portion, catering likely to families or larger groups.
Irondale Airbnb Room Capacity Analysis (2025): Bedroom Distribution
Distribution of Listings by Number of Bedrooms
Room Capacity Insights for Irondale
- The dominant room capacity in Irondale is 3 bedrooms listings, making up 26.3% of the market. This suggests a strong demand for properties suitable for families or small groups.
- Together, 3 bedrooms and 2 bedrooms properties represent 42.1% of the active Airbnb listings in Irondale, indicating a high concentration in these sizes.
- A significant 31.6% of listings offer 3+ bedrooms, catering to larger groups and families seeking more space in Irondale.
Irondale Vacation Rental Guest Capacity Trends (2025)
Distribution of Listings by Guest Capacity
Guest Capacity Insights for Irondale
- The most common guest capacity trend in Irondale vacation rentals is listings accommodating 6 guests (21.1%). This suggests the primary traveler segment is likely larger groups.
- Properties designed for 6 guests and 2 guests dominate the Irondale STR market, accounting for 31.6% of listings.
- 31.6% of properties accommodate 6+ guests, serving the market segment for larger families or group travel in Irondale.
- On average, properties in Irondale are equipped to host 3.0 guests.
Irondale Airbnb Booking Patterns (2025): Available vs. Booked Days
Available Days Distribution
Booked Days Distribution
Booking Pattern Insights for Irondale
- The most common availability pattern in Irondale falls within the 271-366 days range, representing 84.2% of listings. This suggests many properties have significant open periods on their calendars.
- Approximately 94.7% of listings show high availability (181+ days open annually), indicating potential for increased bookings or specific owner usage patterns.
- For booked days, the 31-90 days range is most frequent in Irondale (47.4%), reflecting common guest stay durations or potential owner blocking patterns.
- A notable 5.3% of properties secure long booking periods (181+ days booked per year), highlighting successful long-term rental strategies or significant owner usage.
Irondale Airbnb Minimum Stay Requirements Analysis
Distribution of Listings by Minimum Night Requirement
1 Night
3 listings
15.8% of total
2 Nights
1 listings
5.3% of total
7-29 Nights
4 listings
21.1% of total
30+ Nights
11 listings
57.9% of total
Key Insights
- The most prevalent minimum stay requirement in Irondale is 30+ Nights, adopted by 57.9% of listings. This highlights the market's preference for longer commitments.
- A significant segment (57.9%) caters to monthly stays (30+ nights) in Irondale, pointing to opportunities in the extended-stay market.
Recommendations
- Align with the market by considering a 30+ Nights minimum stay, as 57.9% of Irondale hosts use this setting.
- If feasible, allowing 1-night stays, especially midweek or during low season, could capture last-minute bookings, as only 15.8% currently do.
- Explore offering discounts for stays of 30+ nights to attract the 57.9% of the market seeking extended stays.
- Adjust minimum nights based on seasonality – potentially shorter during low season and longer during peak demand periods in Irondale.
Irondale Airbnb Cancellation Policy Trends Analysis (2025)
Flexible
7 listings
36.8% of total
Moderate
8 listings
42.1% of total
Firm
4 listings
21.1% of total
Cancellation Policy Insights for Irondale
- The prevailing Airbnb cancellation policy trend in Irondale is Moderate, used by 42.1% of listings.
- The market strongly favors guest-friendly terms, with 78.9% of listings offering Flexible or Moderate policies. This suggests guests in Irondale may expect booking flexibility.
Recommendations for Hosts
- Consider adopting a Moderate policy to align with the 42.1% market standard in Irondale.
- Regularly review your cancellation policy against competitors and market demand shifts in Irondale.
Irondale STR Booking Lead Time Analysis (2025)
Average Booking Lead Time by Month
Booking Lead Time Insights for Irondale
- The overall average booking lead time for vacation rentals in Irondale is 31 days.
- Guests book furthest in advance for stays during October (average 128 days), likely coinciding with peak travel demand or local events.
- The shortest booking windows occur for stays in December (average 17 days), indicating more last-minute travel plans during this time.
- Seasonally, Fall (68 days avg.) sees the longest lead times, while Winter (23 days avg.) has the shortest, reflecting typical travel planning cycles.
Recommendations for Hosts
- Use the overall average lead time (31 days) as a baseline for your pricing and availability strategy in Irondale.
- For October stays, consider implementing length-of-stay discounts or slightly higher rates for bookings made less than 128 days out to capitalize on advance planning.
- Target marketing efforts for the Fall season well in advance (at least 68 days) to capture early planners.
- Monitor your own booking lead times against these Irondale averages to identify opportunities for dynamic pricing adjustments.
Popular & Essential Airbnb Amenities in Irondale (2025)
Amenity Prevalence
Amenity Insights for Irondale
- Essential amenities in Irondale that guests expect include: Wifi, Free parking on premises, Air conditioning, Kitchen, TV. Lacking these (any) could significantly impact bookings.
- Popular amenities like Washer, Smoke alarm, Carbon monoxide alarm are common but not universal. Offering these can provide a competitive edge.
Recommendations for Hosts
- Ensure your listing includes all essential amenities for Irondale: Wifi, Free parking on premises, Air conditioning, Kitchen, TV.
- Consider adding popular differentiators like Washer or Smoke alarm to increase appeal.
- Highlight unique or less common amenities you offer (e.g., hot tub, dedicated workspace, EV charger) in your listing description and photos.
- Regularly check competitor amenities in Irondale to stay competitive.
Irondale Airbnb Guest Demographics & Profile Analysis (2025)
Guest Profile Summary for Irondale
- The typical guest profile for Airbnb in Irondale consists of primarily domestic travelers (98%), often arriving from nearby Birmingham, typically belonging to the Post-2000s (Gen Z/Alpha) group (50%), primarily speaking English or Spanish.
- Domestic travelers account for 98.0% of guests.
- Key international markets include United States (98%) and DC (2%).
- Top languages spoken are English (81.8%) followed by Spanish (18.2%).
- A significant demographic segment is the Post-2000s (Gen Z/Alpha) group, representing 50% of guests.
Recommendations for Hosts
- Target domestic marketing efforts towards travelers from Birmingham and Dallas.
- Tailor amenities and listing descriptions to appeal to the dominant Post-2000s (Gen Z/Alpha) demographic (e.g., highlight fast WiFi, smart home features, local guides).
- Highlight unique local experiences or amenities relevant to the primary guest profile.
- Consider seasonal promotions aligned with peak travel times for key origin markets.
Nearby Short-Term Rental Market Comparison
How does the Irondale Airbnb market stack up against its neighbors? Compare key performance metrics like average monthly revenue, ADR, and occupancy rates in surrounding areas to understand the broader regional STR landscape.
| Market | Active Properties | Monthly Revenue | Daily Rate | Avg. Occupancy |
|---|---|---|---|---|
| Bremen | 23 | $5,048 | $567.36 | 33% |
| Millbrook | 12 | $4,876 | $265.79 | 59% |
| Arley | 46 | $4,706 | $498.13 | 37% |
| Shelby | 12 | $4,251 | $296.04 | 48% |
| Houston | 13 | $4,032 | $528.17 | 35% |
| Cedar Bluff | 32 | $4,030 | $392.75 | 38% |
| Equality | 12 | $3,836 | $616.52 | 29% |
| Jacksons' Gap | 48 | $3,777 | $453.03 | 37% |
| Lookout Mountain | 75 | $3,696 | $319.05 | 50% |
| Crane Hill | 99 | $3,291 | $422.65 | 35% |