Dauphin Island Airbnb Market Analysis 2026: Short Term Rental Data & Vacation Rental Statistics in Alabama, United States
Is Airbnb profitable in Dauphin Island in 2026? Explore comprehensive Airbnb analytics for Dauphin Island, Alabama, United States to uncover income potential. This 2026 STR market report for Dauphin Island, based on AirROI data from February 2025 to January 2026, reveals key trends in the market of 612 active listings.
Whether you're considering an Airbnb investment in Dauphin Island, optimizing your existing vacation rental, or exploring rental arbitrage opportunities, understanding the Dauphin Island Airbnb data is crucial. Leveraging the low regulation environment is key to maximizing your short term rental income potential. Let's dive into the specifics.
Key Dauphin Island Airbnb Performance Metrics Overview
Monthly Airbnb Revenue Variations & Income Potential in Dauphin Island (2026)
Understanding the monthly revenue variations for Airbnb listings in Dauphin Island is key to maximizing your short term rental income potential. Seasonality significantly impacts earnings. Our analysis, based on data from the past 12 months, shows that the peak revenue month for STRs in Dauphin Island is typically July, while January often presents the lowest earnings, highlighting opportunities for strategic pricing adjustments during shoulder and low seasons. Explore the typical Airbnb income in Dauphin Island across different performance tiers:
- Best-in-class properties (Top 10%) achieve $9,625+ monthly, often utilizing dynamic pricing and superior guest experiences.
- Strong performing properties (Top 25%) earn $6,071 or more, indicating effective management and desirable locations/amenities.
- Typical properties (Median) generate around $3,709 per month, representing the average market performance.
- Entry-level properties (Bottom 25%) see earnings around $1,945, often with potential for optimization.
Average Monthly Airbnb Earnings Trend in Dauphin Island
Dauphin Island Airbnb Occupancy Rate Trends (2026)
Maximize your bookings by understanding the Dauphin Island STR occupancy trends. Seasonal demand shifts significantly influence how often properties are booked. Typically, Junesees the highest demand (peak season occupancy), while January experiences the lowest (low season). Effective strategies, like adjusting minimum stays or offering promotions, can boost occupancy during slower periods. Here's how different property tiers perform in Dauphin Island:
- Best-in-class properties (Top 10%) achieve 72%+ occupancy, indicating high desirability and potentially optimized availability.
- Strong performing properties (Top 25%) maintain 56% or higher occupancy, suggesting good market fit and guest satisfaction.
- Typical properties (Median) have an occupancy rate around 36%.
- Entry-level properties (Bottom 25%) average 19% occupancy, potentially facing higher vacancy.
Average Monthly Occupancy Rate Trend in Dauphin Island
Average Daily Rate (ADR) Airbnb Trends in Dauphin Island (2026)
Effective short term rental pricing strategy in Dauphin Island involves understanding monthly ADR fluctuations. The Average Daily Rate (ADR) for Airbnb in Dauphin Island typically peaks in June and dips lowest during February. Leveraging Airbnb dynamic pricing tools or strategies based on this seasonality can significantly boost revenue. Here's a look at the typical nightly rates achieved:
- Best-in-class properties (Top 10%) command rates of $606+ per night, often due to premium features or locations.
- Strong performing properties (Top 25%) achieve nightly rates of $462 or more.
- Typical properties (Median) charge around $331 per night.
- Entry-level properties (Bottom 25%) earn around $249 per night.
Average Daily Rate (ADR) Trend by Month in Dauphin Island
Get Live Dauphin Island Market Intelligence 👇

Explore Real-time Analytics
Airbnb Seasonality Analysis & Trends in Dauphin Island (2026)
Peak Season (July, June, May)
- Revenue averages $7,544 per month
- Occupancy rates average 53.1%
- Daily rates average $454
Shoulder Season
- Revenue averages $4,231 per month
- Occupancy maintains around 38.6%
- Daily rates hold near $353
Low Season (January, February, December)
- Revenue drops to average $2,470 per month
- Occupancy decreases to average 25.9%
- Daily rates adjust to average $325
Seasonality Insights for Dauphin Island
- The Airbnb seasonality in Dauphin Island shows highly seasonal trends requiring careful strategy. While the sections above show seasonal averages, it's also insightful to look at the extremes:
- During the high season, the absolute peak month showcases Dauphin Island's highest earning potential, with monthly revenues capable of climbing to $8,836, occupancy reaching a high of 59.9%, and ADRs peaking at $479.
- Conversely, the slowest single month of the year, typically falling within the low season, marks the market's lowest point. In this month, revenue might dip to $2,087, occupancy could drop to 19.7%, and ADRs may adjust down to $288.
- Understanding both the seasonal averages and these monthly peaks and troughs in revenue, occupancy, and ADR is crucial for maximizing your Airbnb profit potential in Dauphin Island.
Seasonal Strategies for Maximizing Profit
- Peak Season: Maximize revenue through premium pricing and potentially longer minimum stays. Ensure high availability.
- Low Season: Offer competitive pricing, special promotions (e.g., extended stay discounts), and flexible cancellation policies. Target off-season travelers like remote workers or budget-conscious guests.
- Shoulder Seasons: Implement dynamic pricing that balances peak and low rates. Target weekend travelers or specific events. Offer slightly more flexible terms than peak season.
- Regularly analyze your own performance against these Dauphin Island seasonality benchmarks and adjust your pricing and availability strategy accordingly.
Best Areas for Airbnb Investment in Dauphin Island (2026)
Exploring the top neighborhoods for short-term rentals in Dauphin Island? This section highlights key areas, outlining why they are attractive for hosts and guests, along with notable local attractions. Consider these locations based on your target guest profile and investment strategy.
| Neighborhood / Area | Why Host Here? (Target Guests & Appeal) | Key Attractions & Landmarks |
|---|---|---|
| East End | Known for its beautiful beaches and family-friendly atmosphere, the East End is perfect for those looking to experience the natural beauty and relaxation that Dauphin Island offers. | Dauphin Island Sea Lab, East End Beach, Bird Sanctuary, Fishing Pier, Fort Gaines |
| West End | A quieter area that boasts stunning sunsets and spacious beaches, the West End is ideal for visitors seeking tranquility and natural landscapes. | West End Beach, Dauphin Island Golf Club, Public Boat Launch, Historic Homes, Nature Trails |
| Middle Island | This area is less developed but offers a unique view of the Gulf and is great for those looking for seclusion and serenity away from the crowds. | Middle Island Beach, Nature Observation, Kayaking Opportunities, Fishing Spots, Bird Watching |
| Fort Gaines | Home to a historic stone fort, this area attracts history buffs as well as families interested in educational experiences while enjoying beach time. | Fort Gaines, Dauphin Island Heritage and Arts Council, Historic Site Tours, Nearby Beaches, Visitor Center |
| Dauphin Island Marina | Popular for boaters and fishing enthusiasts, this area provides access to charters and beautiful waterfront views, making it appealing for vacationers. | Dauphin Island Marina, Boat Rentals and Charters, Fishing Excursions, Waterfront Dining, Sunset Views |
| Dauphin Island Sea Lab | An educational cornerstone of the island, the Sea Lab draws eco-tourists and families interested in marine science and conservation. | Dauphin Island Sea Lab, Marine Science Programs, Educational Tours, Aquarium Exhibits, Nature Trails |
| Pelican Point | Known for luxurious rental homes and stunning beach access, Pelican Point is a favourite among those seeking upscale vacation experiences. | Private Beaches, Luxury Rentals, Scenic Views, Golf Proximity, Restaurants |
| Shell Beach | This area is characterized by its unique shell-covered shore and is great for families looking for beachcombing and seaside fun. | Shell Collecting, Public Beach Access, Picnic Areas, Nearby Shops, Family-friendly Activities |
Understanding Airbnb License Requirements & STR Laws in Dauphin Island (2026)
While Dauphin Island, Alabama, United States currently shows low STR regulations, specific Airbnb license requirements might still exist or change. Always verify the latest short term rental regulations and Airbnb license requirements directly with local government authorities for Dauphin Island to ensure full compliance before hosting.
(Source: AirROI data, 2026, finding no licensed listings among those analyzed)
Top Performing Airbnb Properties in Dauphin Island (2026)
Benchmark your potential! Explore examples of top-performing Airbnb properties in Dauphin Islandbased on Trailing Twelve Month (TTM) revenue. Analyze their characteristics, revenue, occupancy rate, and ADR to understand what drives success in this market.
006 Salty Kisses by ACP Vacation Rentals
Entire Place • 4 bedrooms
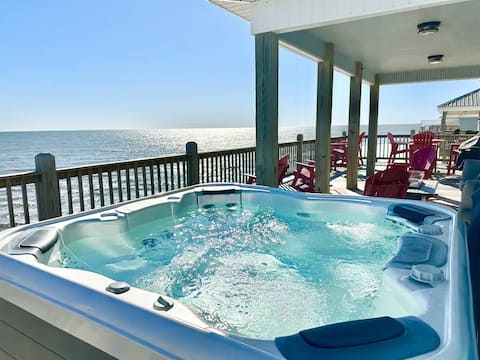
Oceanfront | Hot tub | Hammock + Swings | Loaded
Entire Place • 4 bedrooms

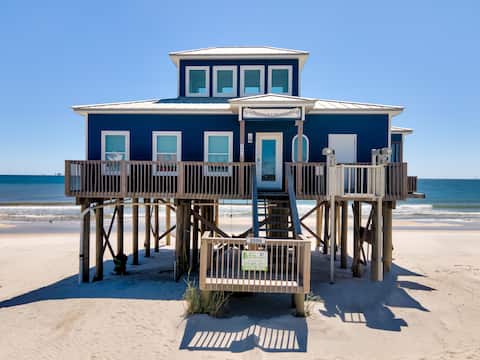
Ocean Front Private Beach Vibes
Entire Place • 5 bedrooms

Coral Sands | sand is better than snow. Book today
Entire Place • 4 bedrooms
007 Hammack's Hammock by ACP Vacation Rentals
Entire Place • 2 bedrooms
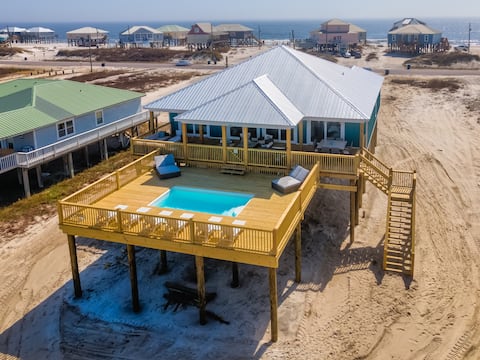
Private pool, bayfront beach, kayaks!
Entire Place • 5 bedrooms
Note: Performance varies based on location, size, amenities, seasonality, and management quality. Data reflects the past 12 months.
Top Performing Airbnb Hosts in Dauphin Island (2026)
Learn from the best! This table showcases top-performing Airbnb hosts in Dauphin Island based on the number of properties managed and estimated total revenue over the past year. Analyze their scale and performance metrics.
| Host Name | Properties | Grossing Revenue | Stay Reviews | Avg Rating |
|---|---|---|---|---|
| Dauphin Island Beach Rentals | 119 | $7,389,568 | 1939 | 4.69/5.0 |
| ACP Vacation Rentals | 128 | $5,555,257 | 1115 | 4.73/5.0 |
| Sara | 50 | $2,025,944 | 150 | 4.86/5.0 |
| Jennifer | 26 | $1,372,606 | 593 | 4.91/5.0 |
| Vacasa Alabama | 62 | $767,316 | 2150 | 4.61/5.0 |
| Vacasa Alabama | 46 | $625,142 | 832 | 4.62/5.0 |
| Evolve | 9 | $474,863 | 454 | 4.82/5.0 |
| Meg | 17 | $460,714 | 1448 | 4.82/5.0 |
| Austin | 5 | $350,644 | 127 | 4.97/5.0 |
| Karin | 6 | $290,734 | 384 | 4.90/5.0 |
Analyzing the strategies of top hosts, such as their property selection, pricing, and guest communication, can offer valuable lessons for optimizing your own Airbnb operations in Dauphin Island.
Dive Deeper: Advanced Dauphin Island STR Market Data (2026)
Ready to unlock more insights? AirROI provides access to advanced metrics and comprehensive Airbnb data for Dauphin Island. Explore detailed analytics beyond this report to refine your investment strategy, optimize pricing, and maximize your vacation rental profits.
Explore Advanced MetricsDauphin Island Short-Term Rental Market Composition (2026): Property & Room Types
Room Type Distribution
Property Type Distribution
Market Composition Insights for Dauphin Island
- The Dauphin Island Airbnb market composition is heavily skewed towards Entire Home/Apt listings, which make up 99.5% of the 612 active rentals. This indicates strong guest preference for privacy and space.
- Looking at the property type distribution in Dauphin Island, House properties are the most common (78.4%), reflecting the local real estate landscape.
- Houses represent a significant 78.4% portion, catering likely to families or larger groups.
- Smaller segments like hotel/boutique, outdoor/unique (combined 0.7%) offer potential for unique stay experiences.
Dauphin Island Airbnb Room Capacity Analysis (2026): Bedroom Distribution
Distribution of Listings by Number of Bedrooms
Room Capacity Insights for Dauphin Island
- The dominant room capacity in Dauphin Island is 4 bedrooms listings, making up 31.9% of the market. This suggests a strong demand for properties suitable for families or small groups.
- Together, 4 bedrooms and 3 bedrooms properties represent 63.1% of the active Airbnb listings in Dauphin Island, indicating a high concentration in these sizes.
- A significant 75.7% of listings offer 3+ bedrooms, catering to larger groups and families seeking more space in Dauphin Island.
Dauphin Island Vacation Rental Guest Capacity Trends (2026)
Distribution of Listings by Guest Capacity
Guest Capacity Insights for Dauphin Island
- The most common guest capacity trend in Dauphin Island vacation rentals is listings accommodating 8+ guests (65%). This suggests the primary traveler segment is likely larger groups.
- Properties designed for 8+ guests and 6 guests dominate the Dauphin Island STR market, accounting for 85.9% of listings.
- 91.1% of properties accommodate 6+ guests, serving the market segment for larger families or group travel in Dauphin Island.
- On average, properties in Dauphin Island are equipped to host 7.2 guests.
Dauphin Island Airbnb Booking Patterns (2026): Available vs. Booked Days
Available Days Distribution
Booked Days Distribution
Booking Pattern Insights for Dauphin Island
- The most common availability pattern in Dauphin Island falls within the 271-366 days range, representing 47.1% of listings. This suggests many properties have significant open periods on their calendars.
- Approximately 85.5% of listings show high availability (181+ days open annually), indicating potential for increased bookings or specific owner usage patterns.
- For booked days, the 91-180 days range is most frequent in Dauphin Island (40%), reflecting common guest stay durations or potential owner blocking patterns.
- A notable 15.4% of properties secure long booking periods (181+ days booked per year), highlighting successful long-term rental strategies or significant owner usage.
Dauphin Island Airbnb Minimum Stay Requirements Analysis
Distribution of Listings by Minimum Night Requirement
1 Night
3 listings
0.5% of total
2 Nights
58 listings
9.5% of total
3 Nights
211 listings
34.5% of total
4-6 Nights
44 listings
7.2% of total
7-29 Nights
19 listings
3.1% of total
30+ Nights
276 listings
45.2% of total
Key Insights
- The most prevalent minimum stay requirement in Dauphin Island is 30+ Nights, adopted by 45.2% of listings. This highlights the market's preference for longer commitments.
- Very short stays (1-2 nights) are less common (10.0%), suggesting hosts prefer slightly longer bookings to optimize turnover.
- A significant segment (45.2%) caters to monthly stays (30+ nights) in Dauphin Island, pointing to opportunities in the extended-stay market.
Recommendations
- Align with the market by considering a 30+ Nights minimum stay, as 45.2% of Dauphin Island hosts use this setting.
- If feasible, allowing 1-night stays, especially midweek or during low season, could capture last-minute bookings, as only 0.5% currently do.
- Explore offering discounts for stays of 30+ nights to attract the 45.2% of the market seeking extended stays.
- Adjust minimum nights based on seasonality – potentially shorter during low season and longer during peak demand periods in Dauphin Island.
Dauphin Island Airbnb Cancellation Policy Trends Analysis (2026)
Super Strict 30 Days
207 listings
33.9% of total
Limited
14 listings
2.3% of total
Super Strict 60 Days
128 listings
21% of total
Flexible
17 listings
2.8% of total
Moderate
54 listings
8.9% of total
Firm
166 listings
27.2% of total
Strict
24 listings
3.9% of total
Cancellation Policy Insights for Dauphin Island
- The prevailing Airbnb cancellation policy trend in Dauphin Island is Super Strict 30 Days, used by 33.9% of listings.
- There's a relatively balanced mix between guest-friendly (11.7%) and stricter (31.1%) policies, offering choices for different guest needs.
- Strict cancellation policies are quite rare (3.9%), potentially making listings with this policy less competitive unless justified by high demand or property type.
Recommendations for Hosts
- Consider adopting a Super Strict 30 Days policy to align with the 33.9% market standard in Dauphin Island.
- Using a Strict policy might deter some guests, as only 3.9% of listings use it. Evaluate if potential revenue protection outweighs possible lower booking rates.
- Regularly review your cancellation policy against competitors and market demand shifts in Dauphin Island.
Dauphin Island STR Booking Lead Time Analysis (2026)
Average Booking Lead Time by Month
Booking Lead Time Insights for Dauphin Island
- The overall average booking lead time for vacation rentals in Dauphin Island is 69 days.
- Guests book furthest in advance for stays during June (average 84 days), likely coinciding with peak travel demand or local events.
- The shortest booking windows occur for stays in February (average 49 days), indicating more last-minute travel plans during this time.
- Seasonally, Summer (78 days avg.) sees the longest lead times, while Winter (60 days avg.) has the shortest, reflecting typical travel planning cycles.
Recommendations for Hosts
- Use the overall average lead time (69 days) as a baseline for your pricing and availability strategy in Dauphin Island.
- For June stays, consider implementing length-of-stay discounts or slightly higher rates for bookings made less than 84 days out to capitalize on advance planning.
- Target marketing efforts for the Summer season well in advance (at least 78 days) to capture early planners.
- Monitor your own booking lead times against these Dauphin Island averages to identify opportunities for dynamic pricing adjustments.
Popular & Essential Airbnb Amenities in Dauphin Island (2026)
Amenity Prevalence
Amenity Insights for Dauphin Island
- Essential amenities in Dauphin Island that guests expect include: Air conditioning, Kitchen, Wifi, Dishes and silverware, Refrigerator, Free parking on premises, Microwave, TV, Smoke alarm, Heating. Lacking these (any) could significantly impact bookings.
Recommendations for Hosts
- Ensure your listing includes all essential amenities for Dauphin Island: Air conditioning, Kitchen, Wifi, Dishes and silverware, Refrigerator, Free parking on premises, Microwave, TV, Smoke alarm, Heating.
- Prioritize adding missing essentials: Kitchen, Wifi, Dishes and silverware, Refrigerator, Free parking on premises, Microwave, TV, Smoke alarm, Heating.
- Highlight unique or less common amenities you offer (e.g., hot tub, dedicated workspace, EV charger) in your listing description and photos.
- Regularly check competitor amenities in Dauphin Island to stay competitive.
Dauphin Island Airbnb Guest Demographics & Profile Analysis (2026)
Guest Profile Summary for Dauphin Island
- The typical guest profile for Airbnb in Dauphin Island consists of primarily domestic travelers (99%), often arriving from nearby Mobile, typically belonging to the Post-2000s (Gen Z/Alpha) group (50%), primarily speaking English or Spanish.
- Domestic travelers account for 98.6% of guests.
- Key international markets include United States (98.6%) and Canada (0.3%).
- Top languages spoken are English (83.9%) followed by Spanish (7.2%).
- A significant demographic segment is the Post-2000s (Gen Z/Alpha) group, representing 50% of guests.
Recommendations for Hosts
- Target domestic marketing efforts towards travelers from Mobile and Birmingham.
- Tailor amenities and listing descriptions to appeal to the dominant Post-2000s (Gen Z/Alpha) demographic (e.g., highlight fast WiFi, smart home features, local guides).
- Highlight unique local experiences or amenities relevant to the primary guest profile.
- Consider seasonal promotions aligned with peak travel times for key origin markets.
Nearby Short-Term Rental Market Comparison
How does the Dauphin Island Airbnb market stack up against its neighbors? Compare key performance metrics like average monthly revenue, ADR, and occupancy rates in surrounding areas to understand the broader regional STR landscape.
| Market | Active Properties | Monthly Revenue | Daily Rate | Avg. Occupancy |
|---|---|---|---|---|
| Plaquemines Parish | 28 | $4,733 | $413.26 | 40% |
| Perdido Beach | 10 | $4,353 | $297.45 | 51% |
| Pensacola Beach | 968 | $4,082 | $443.49 | 39% |
| Gulf Shores | 4,957 | $3,593 | $385.93 | 40% |
| Baldwin County | 18 | $3,536 | $453.18 | 36% |
| Fairhope | 201 | $3,335 | $295.20 | 43% |
| Orange Beach | 4,106 | $3,271 | $396.08 | 37% |
| Escambia County | 115 | $3,028 | $443.63 | 38% |
| Gulf Breeze | 563 | $2,972 | $333.27 | 41% |
| Perdido Key | 166 | $2,930 | $346.56 | 39% |