Birmingham Airbnb Market Analysis 2026: Short Term Rental Data & Vacation Rental Statistics in Alabama, United States
Is Airbnb profitable in Birmingham in 2026? Explore comprehensive Airbnb analytics for Birmingham, Alabama, United States to uncover income potential. This 2026 STR market report for Birmingham, based on AirROI data from February 2025 to January 2026, reveals key trends in the market of 890 active listings.
Whether you're considering an Airbnb investment in Birmingham, optimizing your existing vacation rental, or exploring rental arbitrage opportunities, understanding the Birmingham Airbnb data is crucial. Leveraging the low regulation environment is key to maximizing your short term rental income potential. Let's dive into the specifics.
Key Birmingham Airbnb Performance Metrics Overview
Monthly Airbnb Revenue Variations & Income Potential in Birmingham (2026)
Understanding the monthly revenue variations for Airbnb listings in Birmingham is key to maximizing your short term rental income potential. Seasonality significantly impacts earnings. Our analysis, based on data from the past 12 months, shows that the peak revenue month for STRs in Birmingham is typically October, while January often presents the lowest earnings, highlighting opportunities for strategic pricing adjustments during shoulder and low seasons. Explore the typical Airbnb income in Birmingham across different performance tiers:
- Best-in-class properties (Top 10%) achieve $5,349+ monthly, often utilizing dynamic pricing and superior guest experiences.
- Strong performing properties (Top 25%) earn $3,405 or more, indicating effective management and desirable locations/amenities.
- Typical properties (Median) generate around $1,981 per month, representing the average market performance.
- Entry-level properties (Bottom 25%) see earnings around $994, often with potential for optimization.
Average Monthly Airbnb Earnings Trend in Birmingham
Birmingham Airbnb Occupancy Rate Trends (2026)
Maximize your bookings by understanding the Birmingham STR occupancy trends. Seasonal demand shifts significantly influence how often properties are booked. Typically, Junesees the highest demand (peak season occupancy), while January experiences the lowest (low season). Effective strategies, like adjusting minimum stays or offering promotions, can boost occupancy during slower periods. Here's how different property tiers perform in Birmingham:
- Best-in-class properties (Top 10%) achieve 79%+ occupancy, indicating high desirability and potentially optimized availability.
- Strong performing properties (Top 25%) maintain 63% or higher occupancy, suggesting good market fit and guest satisfaction.
- Typical properties (Median) have an occupancy rate around 41%.
- Entry-level properties (Bottom 25%) average 21% occupancy, potentially facing higher vacancy.
Average Monthly Occupancy Rate Trend in Birmingham
Average Daily Rate (ADR) Airbnb Trends in Birmingham (2026)
Effective short term rental pricing strategy in Birmingham involves understanding monthly ADR fluctuations. The Average Daily Rate (ADR) for Airbnb in Birmingham typically peaks in October and dips lowest during February. Leveraging Airbnb dynamic pricing tools or strategies based on this seasonality can significantly boost revenue. Here's a look at the typical nightly rates achieved:
- Best-in-class properties (Top 10%) command rates of $343+ per night, often due to premium features or locations.
- Strong performing properties (Top 25%) achieve nightly rates of $230 or more.
- Typical properties (Median) charge around $156 per night.
- Entry-level properties (Bottom 25%) earn around $114 per night.
Average Daily Rate (ADR) Trend by Month in Birmingham
Get Live Birmingham Market Intelligence 👇

Explore Real-time Analytics
Airbnb Seasonality Analysis & Trends in Birmingham (2026)
Peak Season (October, June, December)
- Revenue averages $3,239 per month
- Occupancy rates average 46.3%
- Daily rates average $217
Shoulder Season
- Revenue averages $2,631 per month
- Occupancy maintains around 43.3%
- Daily rates hold near $191
Low Season (January, February, April)
- Revenue drops to average $2,071 per month
- Occupancy decreases to average 39.3%
- Daily rates adjust to average $176
Seasonality Insights for Birmingham
- The Airbnb seasonality in Birmingham shows moderate seasonality with distinct peak and low periods. While the sections above show seasonal averages, it's also insightful to look at the extremes:
- During the high season, the absolute peak month showcases Birmingham's highest earning potential, with monthly revenues capable of climbing to $3,343, occupancy reaching a high of 49.7%, and ADRs peaking at $233.
- Conversely, the slowest single month of the year, typically falling within the low season, marks the market's lowest point. In this month, revenue might dip to $1,951, occupancy could drop to 31.9%, and ADRs may adjust down to $160.
- Understanding both the seasonal averages and these monthly peaks and troughs in revenue, occupancy, and ADR is crucial for maximizing your Airbnb profit potential in Birmingham.
Seasonal Strategies for Maximizing Profit
- Peak Season: Maximize revenue through premium pricing and potentially longer minimum stays. Ensure high availability.
- Low Season: Offer competitive pricing, special promotions (e.g., extended stay discounts), and flexible cancellation policies. Target off-season travelers like remote workers or budget-conscious guests.
- Shoulder Seasons: Implement dynamic pricing that balances peak and low rates. Target weekend travelers or specific events. Offer slightly more flexible terms than peak season.
- Regularly analyze your own performance against these Birmingham seasonality benchmarks and adjust your pricing and availability strategy accordingly.
Best Areas for Airbnb Investment in Birmingham (2026)
Exploring the top neighborhoods for short-term rentals in Birmingham? This section highlights key areas, outlining why they are attractive for hosts and guests, along with notable local attractions. Consider these locations based on your target guest profile and investment strategy.
| Neighborhood / Area | Why Host Here? (Target Guests & Appeal) | Key Attractions & Landmarks |
|---|---|---|
| Southside | A lively neighborhood known for its vibrant culture and proximity to the University of Alabama at Birmingham. Ideal for hosting students, professionals, and visitors to local events and healthcare facilities. | Railroad Park, UAB Hospital, Vulcan Park and Museum, Barber Vintage Motorsports Museum, Birmingham Zoo, Alabama Theatre |
| Downtown | The heart of Birmingham, with a mix of historic and modern architecture. Great for tourists wanting to explore the city’s history, culture, and nightlife. | Birmingham Civil Rights Institute, McWane Science Center, Legacy Arena, The Lyric Theatre, Regions Field, Pioneers Museum |
| Mountain Brook | An affluent suburban area known for its beautiful neighborhoods and upscale shopping. Attractive to visitors seeking a quiet, upscale experience close to the city. | Railroad Park, The Birmingham Botanical Gardens, Mountain Brook Village, Shades Creek Greenway, Birmingham Zoo |
| Avondale | A trendy neighborhood with a growing arts and food scene. Perfect for young travelers and visitors looking for a unique experience with local breweries and eateries. | Avondale Brewing Company, Birmingham Botanical Gardens, Avondale Park, The Pizitz Food Hall |
| Homewood | A charming suburb with a tight-knit community feel, great for families and visitors wanting a quieter stay while being close to Birmingham attractions. | Homewood Park, The Shoppes at Homewood, Birmingham Zoo, Library at Homewood |
| Vestavia Hills | A peaceful suburban area known for its family-friendly environment and excellent schools. Ideal for guests looking for a relaxing atmosphere near Birmingham. | Cahaba Heights Park, Vestavia Hills City Center, Cahaba River |
| Irondale | Known for its historical significance and proximity to local attractions. Attracts those interested in the history and scenic nature of the area. | The Irondale Cafe, Birmingham Botanical Gardens, Cahaba River National Wildlife Refuge |
| Trussville | A growing suburban community with a family-oriented environment, close to shopping and outdoor activities. Appeals to guests looking for a blend of city and nature. | Trussville Mall, Cahaba River, Trussville's Historic District |
Understanding Airbnb License Requirements & STR Laws in Birmingham (2026)
While Birmingham, Alabama, United States currently shows low STR regulations, specific Airbnb license requirements might still exist or change. Always verify the latest short term rental regulations and Airbnb license requirements directly with local government authorities for Birmingham to ensure full compliance before hosting.
(Source: AirROI data, 2026, based on 0% licensed listings)
Top Performing Airbnb Properties in Birmingham (2026)
Benchmark your potential! Explore examples of top-performing Airbnb properties in Birminghambased on Trailing Twelve Month (TTM) revenue. Analyze their characteristics, revenue, occupancy rate, and ADR to understand what drives success in this market.
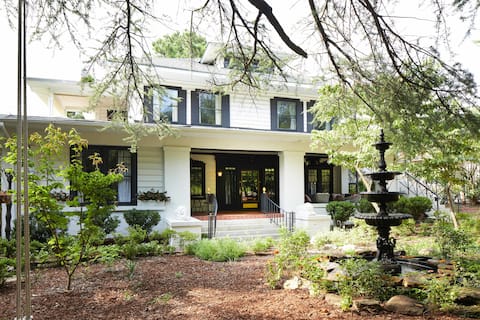
Eden Brae - Birmingham's Premier Retreat
Entire Place • 8 bedrooms
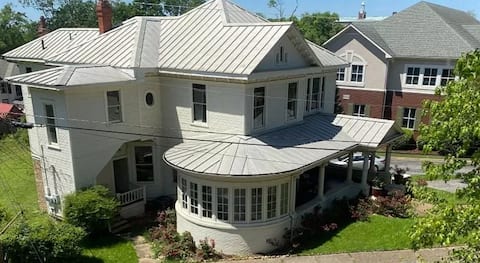
7BR Mansion B'ham Tree House
Entire Place • 7 bedrooms
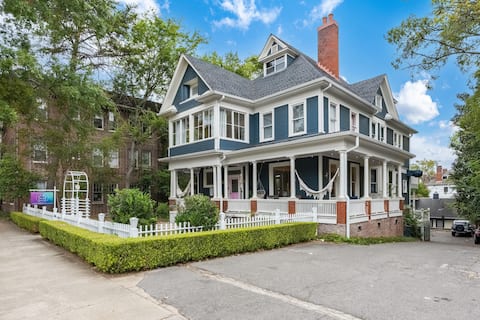
Charles on 11th: Historic Gem, Events & Groups!
Entire Place • 7 bedrooms
Vulcan's Knee: 6bdrm Mansion ~ Speakeasy ~ Library
Entire Place • 6 bedrooms

Perfect House For Groups - 4 Suites, 8 Beds, 5 TVs
Entire Place • 4 bedrooms

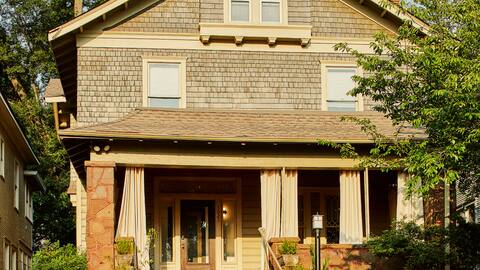
Apt2@EdenBrae - Walkable Southern Gothic Mansion
Entire Place • 2 bedrooms
Note: Performance varies based on location, size, amenities, seasonality, and management quality. Data reflects the past 12 months.
Top Performing Airbnb Hosts in Birmingham (2026)
Learn from the best! This table showcases top-performing Airbnb hosts in Birmingham based on the number of properties managed and estimated total revenue over the past year. Analyze their scale and performance metrics.
| Host Name | Properties | Grossing Revenue | Stay Reviews | Avg Rating |
|---|---|---|---|---|
| Emma | 13 | $1,456,003 | 4692 | 4.94/5.0 |
| Charles | 78 | $743,167 | 2477 | 4.86/5.0 |
| Mason Homes | 37 | $700,199 | 987 | 4.63/5.0 |
| Mark | 9 | $652,072 | 661 | 4.92/5.0 |
| Delaine | 6 | $557,048 | 711 | 4.92/5.0 |
| Matthew | 13 | $484,022 | 1451 | 4.96/5.0 |
| Sarah | 14 | $474,350 | 899 | 4.90/5.0 |
| Eric | 34 | $468,068 | 127 | 3.61/5.0 |
| Clint | 12 | $462,697 | 423 | 4.92/5.0 |
| Sandra | 23 | $450,351 | 412 | 4.83/5.0 |
Analyzing the strategies of top hosts, such as their property selection, pricing, and guest communication, can offer valuable lessons for optimizing your own Airbnb operations in Birmingham.
Dive Deeper: Advanced Birmingham STR Market Data (2026)
Ready to unlock more insights? AirROI provides access to advanced metrics and comprehensive Airbnb data for Birmingham. Explore detailed analytics beyond this report to refine your investment strategy, optimize pricing, and maximize your vacation rental profits.
Explore Advanced MetricsBirmingham Short-Term Rental Market Composition (2026): Property & Room Types
Room Type Distribution
Property Type Distribution
Market Composition Insights for Birmingham
- The Birmingham Airbnb market composition is heavily skewed towards Entire Home/Apt listings, which make up 92% of the 890 active rentals. This indicates strong guest preference for privacy and space.
- Looking at the property type distribution in Birmingham, Apartment/Condo properties are the most common (49.4%), reflecting the local real estate landscape.
- Houses represent a significant 47.1% portion, catering likely to families or larger groups.
- Smaller segments like hotel/boutique, others, outdoor/unique (combined 3.5%) offer potential for unique stay experiences.
Birmingham Airbnb Room Capacity Analysis (2026): Bedroom Distribution
Distribution of Listings by Number of Bedrooms
Room Capacity Insights for Birmingham
- The dominant room capacity in Birmingham is 1 bedroom listings, making up 31.6% of the market. This suggests a strong demand for properties suitable for couples or solo travelers.
- Together, 1 bedroom and 2 bedrooms properties represent 56.4% of the active Airbnb listings in Birmingham, indicating a high concentration in these sizes.
- A significant 35.4% of listings offer 3+ bedrooms, catering to larger groups and families seeking more space in Birmingham.
Birmingham Vacation Rental Guest Capacity Trends (2026)
Distribution of Listings by Guest Capacity
Guest Capacity Insights for Birmingham
- The most common guest capacity trend in Birmingham vacation rentals is listings accommodating 8+ guests (26.6%). This suggests the primary traveler segment is likely larger groups.
- Properties designed for 8+ guests and 2 guests dominate the Birmingham STR market, accounting for 47.9% of listings.
- 43.4% of properties accommodate 6+ guests, serving the market segment for larger families or group travel in Birmingham.
- On average, properties in Birmingham are equipped to host 4.8 guests.
Birmingham Airbnb Booking Patterns (2026): Available vs. Booked Days
Available Days Distribution
Booked Days Distribution
Booking Pattern Insights for Birmingham
- The most common availability pattern in Birmingham falls within the 271-366 days range, representing 47.6% of listings. This suggests many properties have significant open periods on their calendars.
- Approximately 79.5% of listings show high availability (181+ days open annually), indicating potential for increased bookings or specific owner usage patterns.
- For booked days, the 31-90 days range is most frequent in Birmingham (32.2%), reflecting common guest stay durations or potential owner blocking patterns.
- A notable 22.1% of properties secure long booking periods (181+ days booked per year), highlighting successful long-term rental strategies or significant owner usage.
Birmingham Airbnb Minimum Stay Requirements Analysis
Distribution of Listings by Minimum Night Requirement
1 Night
354 listings
39.8% of total
2 Nights
218 listings
24.5% of total
3 Nights
46 listings
5.2% of total
4-6 Nights
30 listings
3.4% of total
7-29 Nights
34 listings
3.8% of total
30+ Nights
208 listings
23.4% of total
Key Insights
- The most prevalent minimum stay requirement in Birmingham is 1 Night, adopted by 39.8% of listings. This highlights the market's preference for shorter, flexible bookings.
- A strong majority (64.3%) of the Birmingham Airbnb data shows acceptance of very short stays (1-2 nights), indicating a dynamic, high-turnover market.
- A significant segment (23.4%) caters to monthly stays (30+ nights) in Birmingham, pointing to opportunities in the extended-stay market.
Recommendations
- Align with the market by considering a 1 Night minimum stay, as 39.8% of Birmingham hosts use this setting.
- Explore offering discounts for stays of 30+ nights to attract the 23.4% of the market seeking extended stays.
- Adjust minimum nights based on seasonality – potentially shorter during low season and longer during peak demand periods in Birmingham.
Birmingham Airbnb Cancellation Policy Trends Analysis (2026)
Limited
10 listings
1.1% of total
Super Strict 60 Days
6 listings
0.7% of total
Super Strict 30 Days
14 listings
1.6% of total
Flexible
171 listings
19.3% of total
Moderate
267 listings
30.1% of total
Firm
245 listings
27.7% of total
Strict
173 listings
19.5% of total
Cancellation Policy Insights for Birmingham
- The prevailing Airbnb cancellation policy trend in Birmingham is Moderate, used by 30.1% of listings.
- There's a relatively balanced mix between guest-friendly (49.4%) and stricter (47.2%) policies, offering choices for different guest needs.
Recommendations for Hosts
- Consider adopting a Moderate policy to align with the 30.1% market standard in Birmingham.
- Regularly review your cancellation policy against competitors and market demand shifts in Birmingham.
Birmingham STR Booking Lead Time Analysis (2026)
Average Booking Lead Time by Month
Booking Lead Time Insights for Birmingham
- The overall average booking lead time for vacation rentals in Birmingham is 37 days.
- Guests book furthest in advance for stays during October (average 60 days), likely coinciding with peak travel demand or local events.
- The shortest booking windows occur for stays in February (average 18 days), indicating more last-minute travel plans during this time.
- Seasonally, Fall (50 days avg.) sees the longest lead times, while Winter (21 days avg.) has the shortest, reflecting typical travel planning cycles.
Recommendations for Hosts
- Use the overall average lead time (37 days) as a baseline for your pricing and availability strategy in Birmingham.
- For October stays, consider implementing length-of-stay discounts or slightly higher rates for bookings made less than 60 days out to capitalize on advance planning.
- Target marketing efforts for the Fall season well in advance (at least 50 days) to capture early planners.
- Monitor your own booking lead times against these Birmingham averages to identify opportunities for dynamic pricing adjustments.
Popular & Essential Airbnb Amenities in Birmingham (2026)
Amenity Prevalence
Amenity Insights for Birmingham
- Essential amenities in Birmingham that guests expect include: Wifi, Air conditioning, Smoke alarm, TV, Heating. Lacking these (any) could significantly impact bookings.
- Popular amenities like Hot water, Kitchen, Dishes and silverware are common but not universal. Offering these can provide a competitive edge.
Recommendations for Hosts
- Ensure your listing includes all essential amenities for Birmingham: Wifi, Air conditioning, Smoke alarm, TV, Heating.
- Prioritize adding missing essentials: Wifi, Air conditioning, Smoke alarm, TV, Heating.
- Consider adding popular differentiators like Hot water or Kitchen to increase appeal.
- Highlight unique or less common amenities you offer (e.g., hot tub, dedicated workspace, EV charger) in your listing description and photos.
- Regularly check competitor amenities in Birmingham to stay competitive.
Birmingham Airbnb Guest Demographics & Profile Analysis (2026)
Guest Profile Summary for Birmingham
- The typical guest profile for Airbnb in Birmingham consists of primarily domestic travelers (96%), often arriving from nearby Birmingham, typically belonging to the Post-2000s (Gen Z/Alpha) group (50%), primarily speaking English or Spanish.
- Domestic travelers account for 95.8% of guests.
- Key international markets include United States (95.8%) and Canada (0.8%).
- Top languages spoken are English (78.3%) followed by Spanish (11.1%).
- A significant demographic segment is the Post-2000s (Gen Z/Alpha) group, representing 50% of guests.
Recommendations for Hosts
- Target domestic marketing efforts towards travelers from Birmingham and Atlanta.
- Tailor amenities and listing descriptions to appeal to the dominant Post-2000s (Gen Z/Alpha) demographic (e.g., highlight fast WiFi, smart home features, local guides).
- Highlight unique local experiences or amenities relevant to the primary guest profile.
- Consider seasonal promotions aligned with peak travel times for key origin markets.
Nearby Short-Term Rental Market Comparison
How does the Birmingham Airbnb market stack up against its neighbors? Compare key performance metrics like average monthly revenue, ADR, and occupancy rates in surrounding areas to understand the broader regional STR landscape.
| Market | Active Properties | Monthly Revenue | Daily Rate | Avg. Occupancy |
|---|---|---|---|---|
| Gilmer County | 26 | $5,298 | $459.59 | 40% |
| Fannin County | 42 | $4,574 | $435.93 | 38% |
| East Ellijay | 15 | $4,415 | $368.05 | 41% |
| Epworth | 79 | $4,411 | $406.97 | 40% |
| Millbrook | 13 | $4,317 | $283.83 | 51% |
| Jacksons' Gap | 45 | $4,249 | $467.96 | 37% |
| Shelby | 13 | $4,186 | $327.90 | 46% |
| Waleska | 45 | $4,041 | $373.64 | 42% |
| Blue Ridge | 1,346 | $3,859 | $347.45 | 41% |
| Cedar Bluff | 37 | $3,805 | $390.28 | 36% |