Cwmbelan Airbnb Market Analysis 2026: Short Term Rental Data & Vacation Rental Statistics in Wales, United Kingdom
Is Airbnb profitable in Cwmbelan in 2026? Explore comprehensive Airbnb analytics for Cwmbelan, Wales, United Kingdom to uncover income potential. This 2026 STR market report for Cwmbelan, based on AirROI data from February 2025 to January 2026, reveals key trends in the niche market of 20 active listings.
Whether you're considering an Airbnb investment in Cwmbelan, optimizing your existing vacation rental, or exploring rental arbitrage opportunities, understanding the Cwmbelan Airbnb data is crucial. Leveraging the low regulation environment is key to maximizing your short term rental income potential. Let's dive into the specifics.
Key Cwmbelan Airbnb Performance Metrics Overview
Monthly Airbnb Revenue Variations & Income Potential in Cwmbelan (2026)
Understanding the monthly revenue variations for Airbnb listings in Cwmbelan is key to maximizing your short term rental income potential. Seasonality significantly impacts earnings. Our analysis, based on data from the past 12 months, shows that the peak revenue month for STRs in Cwmbelan is typically August, while January often presents the lowest earnings, highlighting opportunities for strategic pricing adjustments during shoulder and low seasons. Explore the typical Airbnb income in Cwmbelan across different performance tiers:
- Best-in-class properties (Top 10%) achieve $4,361+ monthly, often utilizing dynamic pricing and superior guest experiences.
- Strong performing properties (Top 25%) earn $2,829 or more, indicating effective management and desirable locations/amenities.
- Typical properties (Median) generate around $1,740 per month, representing the average market performance.
- Entry-level properties (Bottom 25%) see earnings around $1,255, often with potential for optimization.
Average Monthly Airbnb Earnings Trend in Cwmbelan
Cwmbelan Airbnb Occupancy Rate Trends (2026)
Maximize your bookings by understanding the Cwmbelan STR occupancy trends. Seasonal demand shifts significantly influence how often properties are booked. Typically, Augustsees the highest demand (peak season occupancy), while January experiences the lowest (low season). Effective strategies, like adjusting minimum stays or offering promotions, can boost occupancy during slower periods. Here's how different property tiers perform in Cwmbelan:
- Best-in-class properties (Top 10%) achieve 56%+ occupancy, indicating high desirability and potentially optimized availability.
- Strong performing properties (Top 25%) maintain 46% or higher occupancy, suggesting good market fit and guest satisfaction.
- Typical properties (Median) have an occupancy rate around 37%.
- Entry-level properties (Bottom 25%) average 28% occupancy, potentially facing higher vacancy.
Average Monthly Occupancy Rate Trend in Cwmbelan
Average Daily Rate (ADR) Airbnb Trends in Cwmbelan (2026)
Effective short term rental pricing strategy in Cwmbelan involves understanding monthly ADR fluctuations. The Average Daily Rate (ADR) for Airbnb in Cwmbelan typically peaks in June and dips lowest during April. Leveraging Airbnb dynamic pricing tools or strategies based on this seasonality can significantly boost revenue. Here's a look at the typical nightly rates achieved:
- Best-in-class properties (Top 10%) command rates of $167+ per night, often due to premium features or locations.
- Strong performing properties (Top 25%) achieve nightly rates of $154 or more.
- Typical properties (Median) charge around $135 per night.
- Entry-level properties (Bottom 25%) earn around $121 per night.
Average Daily Rate (ADR) Trend by Month in Cwmbelan
Get Live Cwmbelan Market Intelligence 👇

Explore Real-time Analytics
Airbnb Seasonality Analysis & Trends in Cwmbelan (2026)
Peak Season (August, December, October)
- Revenue averages $3,102 per month
- Occupancy rates average 48.0%
- Daily rates average $185
Shoulder Season
- Revenue averages $2,205 per month
- Occupancy maintains around 41.3%
- Daily rates hold near $183
Low Season (January, February, November)
- Revenue drops to average $1,319 per month
- Occupancy decreases to average 20.2%
- Daily rates adjust to average $181
Seasonality Insights for Cwmbelan
- The Airbnb seasonality in Cwmbelan shows highly seasonal trends requiring careful strategy. While the sections above show seasonal averages, it's also insightful to look at the extremes:
- During the high season, the absolute peak month showcases Cwmbelan's highest earning potential, with monthly revenues capable of climbing to $3,326, occupancy reaching a high of 74.6%, and ADRs peaking at $190.
- Conversely, the slowest single month of the year, typically falling within the low season, marks the market's lowest point. In this month, revenue might dip to $560, occupancy could drop to 6.0%, and ADRs may adjust down to $179.
- Understanding both the seasonal averages and these monthly peaks and troughs in revenue, occupancy, and ADR is crucial for maximizing your Airbnb profit potential in Cwmbelan.
Seasonal Strategies for Maximizing Profit
- Peak Season: Maximize revenue through premium pricing and potentially longer minimum stays. Ensure high availability.
- Low Season: Offer competitive pricing, special promotions (e.g., extended stay discounts), and flexible cancellation policies. Target off-season travelers like remote workers or budget-conscious guests.
- Shoulder Seasons: Implement dynamic pricing that balances peak and low rates. Target weekend travelers or specific events. Offer slightly more flexible terms than peak season.
- Regularly analyze your own performance against these Cwmbelan seasonality benchmarks and adjust your pricing and availability strategy accordingly.
Best Areas for Airbnb Investment in Cwmbelan (2026)
Exploring the top neighborhoods for short-term rentals in Cwmbelan? This section highlights key areas, outlining why they are attractive for hosts and guests, along with notable local attractions. Consider these locations based on your target guest profile and investment strategy.
| Neighborhood / Area | Why Host Here? (Target Guests & Appeal) | Key Attractions & Landmarks |
|---|---|---|
| Cwmbelan Village | A picturesque village in the Brecon Beacons with stunning natural scenery, attracting tourists for outdoor activities like hiking and cycling. | Brecon Beacons National Park, Cwmbelan Waterfall, Walking trails, Local pubs and eateries |
| Llandrindod Wells | A charming spa town known for its historical architecture and serene lake, ideal for those seeking relaxation and healing retreats. | Llandrindod Wells Lake, Rock Park, National Cycle Museum, Spa and wellness centers |
| Builth Wells | Famous for its events and exhibitions, particularly the Royal Welsh Show, attracting visitors year-round. | Wyeside Arts Centre, Builth Wells Castle, River Wye, Royal Welsh Show |
| Hay-on-Wye | The famous 'Book Town', known for its literary festivals and charming bookshops; a haven for book lovers and tourists. | Hay Festival, Hay-on-Wye Bookshops, River Wye, The Old Electric Shop |
| Crickhowell | A picturesque town ideal for walking and outdoor adventures, with a vibrant local community and scenic views. | Crickhowell Castle, The Black Mountains, Local markets, Canoe trips on the River Usk |
| Pontypool | A gateway to the South Wales Valleys, offering a mix of urban life and access to nature, popular among a variety of travelers. | Pontypool Park, The Tranch, Local history museums, Nearby hiking trails |
| Abergavenny | Known as the 'Gateway to Wales', Abergavenny has a rich history and is famous for its food festival, attracting culinary enthusiasts. | Abergavenny Food Festival, Abergavenny Castle, Brecon Beacon views, Local shops and cafes |
| Monmouth | A historic town with a vibrant arts scene and access to the beautiful Wye Valley, appealing to cultural travelers and outdoor enthusiasts. | Monmouth Castle, The Wye Bridge, Shire Hall, Wye Valley |
Understanding Airbnb License Requirements & STR Laws in Cwmbelan (2026)
While Cwmbelan, Wales, United Kingdom currently shows low STR regulations, specific Airbnb license requirements might still exist or change. Always verify the latest short term rental regulations and Airbnb license requirements directly with local government authorities for Cwmbelan to ensure full compliance before hosting.
(Source: AirROI data, 2026, finding no licensed listings among those analyzed)
Top Performing Airbnb Properties in Cwmbelan (2026)
Benchmark your potential! Explore examples of top-performing Airbnb properties in Cwmbelanbased on Trailing Twelve Month (TTM) revenue. Analyze their characteristics, revenue, occupancy rate, and ADR to understand what drives success in this market.
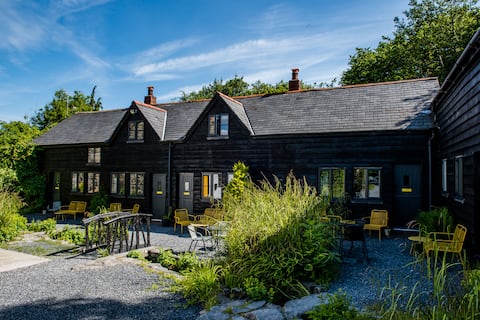
Glyngynwydd Cottages Group Accommodation
Entire Place • 8 bedrooms
2 Bed in Cwmbelan (95815)
Entire Place • 2 bedrooms
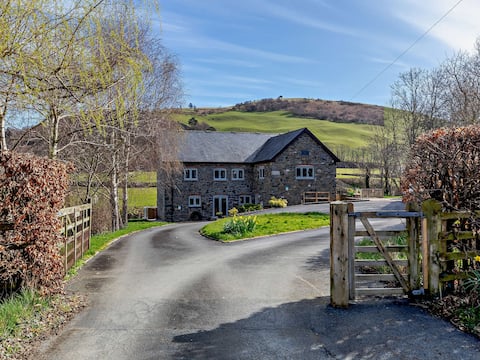
Ty Uchaf Glyngwyn Cottages
Entire Place • 2 bedrooms

Ty Isaf Glyngwyn Cottages
Entire Place • 2 bedrooms
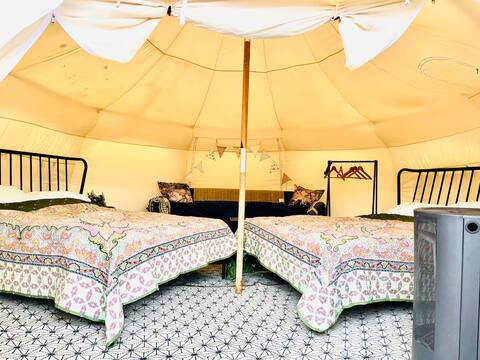
Lotus Belle 2
Entire Place • 1 bedroom

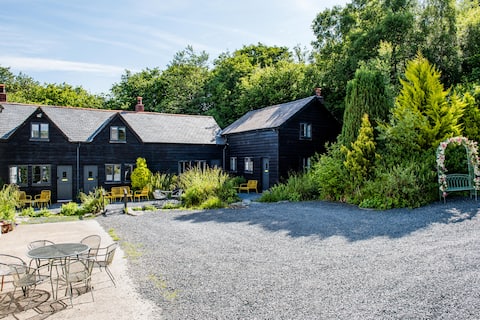
Ty Canol Mawr Glyngynwydd Cottages
Entire Place • 2 bedrooms
Note: Performance varies based on location, size, amenities, seasonality, and management quality. Data reflects the past 12 months.
Top Performing Airbnb Hosts in Cwmbelan (2026)
Learn from the best! This table showcases top-performing Airbnb hosts in Cwmbelan based on the number of properties managed and estimated total revenue over the past year. Analyze their scale and performance metrics.
| Host Name | Properties | Grossing Revenue | Stay Reviews | Avg Rating |
|---|---|---|---|---|
| Carla | 6 | $169,136 | 353 | 4.92/5.0 |
| Elsie Maria | 9 | $109,982 | 175 | 4.90/5.0 |
| Suzanne | 4 | $44,222 | 30 | 4.97/5.0 |
| Holidaycottages.Co.Uk | 1 | $24,988 | 1 | Not Rated |
Analyzing the strategies of top hosts, such as their property selection, pricing, and guest communication, can offer valuable lessons for optimizing your own Airbnb operations in Cwmbelan.
Dive Deeper: Advanced Cwmbelan STR Market Data (2026)
Ready to unlock more insights? AirROI provides access to advanced metrics and comprehensive Airbnb data for Cwmbelan. Explore detailed analytics beyond this report to refine your investment strategy, optimize pricing, and maximize your vacation rental profits.
Explore Advanced MetricsCwmbelan Short-Term Rental Market Composition (2026): Property & Room Types
Room Type Distribution
Property Type Distribution
Market Composition Insights for Cwmbelan
- The Cwmbelan Airbnb market composition is heavily skewed towards Entire Home/Apt listings, which make up 100% of the 20 active rentals. This indicates strong guest preference for privacy and space.
- Looking at the property type distribution in Cwmbelan, Outdoor/Unique properties are the most common (55%), reflecting the local real estate landscape.
- Houses represent a significant 35% portion, catering likely to families or larger groups.
Cwmbelan Airbnb Room Capacity Analysis (2026): Bedroom Distribution
Distribution of Listings by Number of Bedrooms
Room Capacity Insights for Cwmbelan
- The dominant room capacity in Cwmbelan is 1 bedroom listings, making up 60% of the market. This suggests a strong demand for properties suitable for couples or solo travelers.
- Together, 1 bedroom and 2 bedrooms properties represent 95.0% of the active Airbnb listings in Cwmbelan, indicating a high concentration in these sizes.
- With over half the market (60%) consisting of studios or 1-bedroom units, Cwmbelan is particularly well-suited for individuals or couples.
- Listings with 3+ bedrooms (5.0%) represent a smaller niche, potentially indicating an underserved market for larger group accommodations in Cwmbelan.
Cwmbelan Vacation Rental Guest Capacity Trends (2026)
Distribution of Listings by Guest Capacity
Guest Capacity Insights for Cwmbelan
- The most common guest capacity trend in Cwmbelan vacation rentals is listings accommodating 5 guests (65%). This suggests the primary traveler segment is likely larger groups.
- Properties designed for 5 guests and 4 guests dominate the Cwmbelan STR market, accounting for 90.0% of listings.
- On average, properties in Cwmbelan are equipped to host 4.8 guests.
Cwmbelan Airbnb Booking Patterns (2026): Available vs. Booked Days
Available Days Distribution
Booked Days Distribution
Booking Pattern Insights for Cwmbelan
- The most common availability pattern in Cwmbelan falls within the 181-270 days range, representing 55% of listings. This suggests many properties have significant open periods on their calendars.
- Approximately 100.0% of listings show high availability (181+ days open annually), indicating potential for increased bookings or specific owner usage patterns.
- For booked days, the 91-180 days range is most frequent in Cwmbelan (55%), reflecting common guest stay durations or potential owner blocking patterns.
Cwmbelan Airbnb Minimum Stay Requirements Analysis
Distribution of Listings by Minimum Night Requirement
1 Night
9 listings
45% of total
2 Nights
8 listings
40% of total
30+ Nights
3 listings
15% of total
Key Insights
- The most prevalent minimum stay requirement in Cwmbelan is 1 Night, adopted by 45% of listings. This highlights the market's preference for shorter, flexible bookings.
- A strong majority (85.0%) of the Cwmbelan Airbnb data shows acceptance of very short stays (1-2 nights), indicating a dynamic, high-turnover market.
- A significant segment (15%) caters to monthly stays (30+ nights) in Cwmbelan, pointing to opportunities in the extended-stay market.
Recommendations
- Align with the market by considering a 1 Night minimum stay, as 45% of Cwmbelan hosts use this setting.
- Explore offering discounts for stays of 30+ nights to attract the 15% of the market seeking extended stays.
- Adjust minimum nights based on seasonality – potentially shorter during low season and longer during peak demand periods in Cwmbelan.
Cwmbelan Airbnb Cancellation Policy Trends Analysis (2026)
Super Strict 60 Days
1 listings
5% of total
Flexible
10 listings
50% of total
Firm
8 listings
40% of total
Strict
1 listings
5% of total
Cancellation Policy Insights for Cwmbelan
- The prevailing Airbnb cancellation policy trend in Cwmbelan is Flexible, used by 50% of listings.
- There's a relatively balanced mix between guest-friendly (50.0%) and stricter (45.0%) policies, offering choices for different guest needs.
- Strict cancellation policies are quite rare (5%), potentially making listings with this policy less competitive unless justified by high demand or property type.
Recommendations for Hosts
- Consider adopting a Flexible policy to align with the 50% market standard in Cwmbelan.
- Using a Strict policy might deter some guests, as only 5% of listings use it. Evaluate if potential revenue protection outweighs possible lower booking rates.
- Regularly review your cancellation policy against competitors and market demand shifts in Cwmbelan.
Cwmbelan STR Booking Lead Time Analysis (2026)
Average Booking Lead Time by Month
Booking Lead Time Insights for Cwmbelan
- The overall average booking lead time for vacation rentals in Cwmbelan is 108 days.
- Guests book furthest in advance for stays during December (average 248 days), likely coinciding with peak travel demand or local events.
- The shortest booking windows occur for stays in January (average 39 days), indicating more last-minute travel plans during this time.
- Seasonally, Fall (188 days avg.) sees the longest lead times, while Winter (116 days avg.) has the shortest, reflecting typical travel planning cycles.
Recommendations for Hosts
- Use the overall average lead time (108 days) as a baseline for your pricing and availability strategy in Cwmbelan.
- For December stays, consider implementing length-of-stay discounts or slightly higher rates for bookings made less than 248 days out to capitalize on advance planning.
- Target marketing efforts for the Fall season well in advance (at least 188 days) to capture early planners.
- Monitor your own booking lead times against these Cwmbelan averages to identify opportunities for dynamic pricing adjustments.
Popular & Essential Airbnb Amenities in Cwmbelan (2026)
Amenity Prevalence
Amenity Insights for Cwmbelan
- Essential amenities in Cwmbelan that guests expect include: Free parking on premises, Pets allowed, Kitchen. Lacking these (any) could significantly impact bookings.
- Popular amenities like Heating, Cooking basics, Carbon monoxide alarm are common but not universal. Offering these can provide a competitive edge.
- Warning: Wifi is not universally provided but is considered essential globally. Ensure reliable Wifi is offered.
Recommendations for Hosts
- Ensure your listing includes all essential amenities for Cwmbelan: Free parking on premises, Pets allowed, Kitchen.
- Prioritize adding missing essentials: Kitchen.
- Consider adding popular differentiators like Heating or Cooking basics to increase appeal.
- Highlight unique or less common amenities you offer (e.g., hot tub, dedicated workspace, EV charger) in your listing description and photos.
- Regularly check competitor amenities in Cwmbelan to stay competitive.
Cwmbelan Airbnb Guest Demographics & Profile Analysis (2026)
Guest Profile Summary for Cwmbelan
- The typical guest profile for Airbnb in Cwmbelan consists of primarily domestic travelers (93%), often arriving from nearby England, typically belonging to the Post-2000s (Gen Z/Alpha) group (50%), primarily speaking English or Italian.
- Domestic travelers account for 93.4% of guests.
- Key international markets include United Kingdom (93.4%) and United States (1.6%).
- Top languages spoken are English (77.8%) followed by Italian (11.1%).
- A significant demographic segment is the Post-2000s (Gen Z/Alpha) group, representing 50% of guests.
Recommendations for Hosts
- Target domestic marketing efforts towards travelers from England and London.
- Tailor amenities and listing descriptions to appeal to the dominant Post-2000s (Gen Z/Alpha) demographic (e.g., highlight fast WiFi, smart home features, local guides).
- Highlight unique local experiences or amenities relevant to the primary guest profile.
- Consider seasonal promotions aligned with peak travel times for key origin markets.
Nearby Short-Term Rental Market Comparison
How does the Cwmbelan Airbnb market stack up against its neighbors? Compare key performance metrics like average monthly revenue, ADR, and occupancy rates in surrounding areas to understand the broader regional STR landscape.
| Market | Active Properties | Monthly Revenue | Daily Rate | Avg. Occupancy |
|---|---|---|---|---|
| Chew Magna | 13 | $7,041 | $430.65 | 44% |
| Englishcombe | 15 | $6,734 | $511.35 | 53% |
| East Knoyle | 10 | $6,300 | $407.06 | 44% |
| Long Sutton | 18 | $6,029 | $383.58 | 46% |
| Withington | 10 | $5,690 | $499.79 | 44% |
| Ashley | 13 | $5,497 | $364.68 | 54% |
| Bont-dolgadfan | 10 | $5,458 | $293.24 | 58% |
| Freshford | 12 | $5,333 | $317.81 | 58% |
| Grosmont | 11 | $5,211 | $459.67 | 55% |
| Milverton | 10 | $5,067 | $377.17 | 48% |