Cardiff Airbnb Market Analysis 2026: Short Term Rental Data & Vacation Rental Statistics in Wales, United Kingdom
Is Airbnb profitable in Cardiff in 2026? Explore comprehensive Airbnb analytics for Cardiff, Wales, United Kingdom to uncover income potential. This 2026 STR market report for Cardiff, based on AirROI data from February 2025 to January 2026, reveals key trends in the bustling market of 1,474 active listings.
Whether you're considering an Airbnb investment in Cardiff, optimizing your existing vacation rental, or exploring rental arbitrage opportunities, understanding the Cardiff Airbnb data is crucial. Leveraging the low regulation environment is key to maximizing your short term rental income potential. Let's dive into the specifics.
Key Cardiff Airbnb Performance Metrics Overview
Monthly Airbnb Revenue Variations & Income Potential in Cardiff (2026)
Understanding the monthly revenue variations for Airbnb listings in Cardiff is key to maximizing your short term rental income potential. Seasonality significantly impacts earnings. Our analysis, based on data from the past 12 months, shows that the peak revenue month for STRs in Cardiff is typically July, while January often presents the lowest earnings, highlighting opportunities for strategic pricing adjustments during shoulder and low seasons. Explore the typical Airbnb income in Cardiff across different performance tiers:
- Best-in-class properties (Top 10%) achieve $6,058+ monthly, often utilizing dynamic pricing and superior guest experiences.
- Strong performing properties (Top 25%) earn $3,615 or more, indicating effective management and desirable locations/amenities.
- Typical properties (Median) generate around $1,998 per month, representing the average market performance.
- Entry-level properties (Bottom 25%) see earnings around $933, often with potential for optimization.
Average Monthly Airbnb Earnings Trend in Cardiff
Cardiff Airbnb Occupancy Rate Trends (2026)
Maximize your bookings by understanding the Cardiff STR occupancy trends. Seasonal demand shifts significantly influence how often properties are booked. Typically, Julysees the highest demand (peak season occupancy), while January experiences the lowest (low season). Effective strategies, like adjusting minimum stays or offering promotions, can boost occupancy during slower periods. Here's how different property tiers perform in Cardiff:
- Best-in-class properties (Top 10%) achieve 81%+ occupancy, indicating high desirability and potentially optimized availability.
- Strong performing properties (Top 25%) maintain 64% or higher occupancy, suggesting good market fit and guest satisfaction.
- Typical properties (Median) have an occupancy rate around 41%.
- Entry-level properties (Bottom 25%) average 19% occupancy, potentially facing higher vacancy.
Average Monthly Occupancy Rate Trend in Cardiff
Average Daily Rate (ADR) Airbnb Trends in Cardiff (2026)
Effective short term rental pricing strategy in Cardiff involves understanding monthly ADR fluctuations. The Average Daily Rate (ADR) for Airbnb in Cardiff typically peaks in July and dips lowest during April. Leveraging Airbnb dynamic pricing tools or strategies based on this seasonality can significantly boost revenue. Here's a look at the typical nightly rates achieved:
- Best-in-class properties (Top 10%) command rates of $415+ per night, often due to premium features or locations.
- Strong performing properties (Top 25%) achieve nightly rates of $256 or more.
- Typical properties (Median) charge around $165 per night.
- Entry-level properties (Bottom 25%) earn around $111 per night.
Average Daily Rate (ADR) Trend by Month in Cardiff
Get Live Cardiff Market Intelligence 👇

Explore Real-time Analytics
Airbnb Seasonality Analysis & Trends in Cardiff (2026)
Peak Season (July, June, August)
- Revenue averages $3,666 per month
- Occupancy rates average 47.3%
- Daily rates average $241
Shoulder Season
- Revenue averages $2,870 per month
- Occupancy maintains around 43.6%
- Daily rates hold near $222
Low Season (January, February, March)
- Revenue drops to average $2,180 per month
- Occupancy decreases to average 36.4%
- Daily rates adjust to average $207
Seasonality Insights for Cardiff
- The Airbnb seasonality in Cardiff shows highly seasonal trends requiring careful strategy. While the sections above show seasonal averages, it's also insightful to look at the extremes:
- During the high season, the absolute peak month showcases Cardiff's highest earning potential, with monthly revenues capable of climbing to $4,321, occupancy reaching a high of 52.0%, and ADRs peaking at $255.
- Conversely, the slowest single month of the year, typically falling within the low season, marks the market's lowest point. In this month, revenue might dip to $1,721, occupancy could drop to 30.5%, and ADRs may adjust down to $204.
- Understanding both the seasonal averages and these monthly peaks and troughs in revenue, occupancy, and ADR is crucial for maximizing your Airbnb profit potential in Cardiff.
Seasonal Strategies for Maximizing Profit
- Peak Season: Maximize revenue through premium pricing and potentially longer minimum stays. Ensure high availability.
- Low Season: Offer competitive pricing, special promotions (e.g., extended stay discounts), and flexible cancellation policies. Target off-season travelers like remote workers or budget-conscious guests.
- Shoulder Seasons: Implement dynamic pricing that balances peak and low rates. Target weekend travelers or specific events. Offer slightly more flexible terms than peak season.
- Regularly analyze your own performance against these Cardiff seasonality benchmarks and adjust your pricing and availability strategy accordingly.
Best Areas for Airbnb Investment in Cardiff (2026)
Exploring the top neighborhoods for short-term rentals in Cardiff? This section highlights key areas, outlining why they are attractive for hosts and guests, along with notable local attractions. Consider these locations based on your target guest profile and investment strategy.
| Neighborhood / Area | Why Host Here? (Target Guests & Appeal) | Key Attractions & Landmarks |
|---|---|---|
| Cardiff Bay | A vibrant waterfront area known for its stunning views, restaurants, and entertainment. It's popular among tourists for attractions like the Wales Millennium Centre and is ideal for short-term rentals due to its scenic location. | Wales Millennium Centre, Cardiff International White Water, Doctor Who Experience, Cardiff Bay Barrage, The Senedd |
| Cathays | A lively neighborhood popular with students and young professionals due to its proximity to Cardiff University and the city center. Its vibrant atmosphere makes it a great location for short-term stays. | Cardiff University, Cathays Park, National Museum Cardiff, Bute Park, Roath Park |
| City Centre | The heart of Cardiff, known for its shopping, dining, and attractions. It's a prime location for visitors looking to explore the city and enjoy urban amenities. | Cardiff Castle, St David's Shopping Centre, Cardiff Market, Principality Stadium, The Hayes |
| Roath | A culturally rich area known for its parks, cafes, and charming streets. It attracts families and tourists looking for a more relaxed stay within reach of the city center. | Roath Park, The Roath Park Lake, The Norwegian Church Arts Centre, The Botanical Gardens, The Regina Gallery |
| Merthyr Tydfil | A growing area close to nature and popular for adventure tourism. It attracts visitors looking for outdoor activities in the nearby Brecon Beacons. | Parc Taf Bargoed, Brecon Mountain Railway, Cyfarthfa Castle, Merthyr Tydfil Leisure Centre, BikePark Wales |
| Llandaff | A historic area with beautiful architecture and a peaceful atmosphere, known for Llandaff Cathedral. It is appealing for visitors wanting a tranquil stay not far from Cardiff's hustle. | Llandaff Cathedral, Hyde Park, Victoria Park, Llandaff Fields, Cardiff Golf Club |
| Treforest | Home to the University of South Wales, this area is favored by students and visiting academics. It provides affordable accommodations in a vibrant university community. | University of South Wales, Treforest Industrial Estate, Local cafes, Treforest Train Station, Nearby hiking trails |
| Spenmoss | An up-and-coming area with a mix of modern and traditional homes. It's becoming popular for short-term rentals due to its proximity to transport links and the city. | Railway access, Local parks, Community events, Shopping options, Dining establishments |
Understanding Airbnb License Requirements & STR Laws in Cardiff (2026)
While Cardiff, Wales, United Kingdom currently shows low STR regulations, specific Airbnb license requirements might still exist or change. Always verify the latest short term rental regulations and Airbnb license requirements directly with local government authorities for Cardiff to ensure full compliance before hosting.
(Source: AirROI data, 2026, based on 1% licensed listings)
Top Performing Airbnb Properties in Cardiff (2026)
Benchmark your potential! Explore examples of top-performing Airbnb properties in Cardiffbased on Trailing Twelve Month (TTM) revenue. Analyze their characteristics, revenue, occupancy rate, and ADR to understand what drives success in this market.

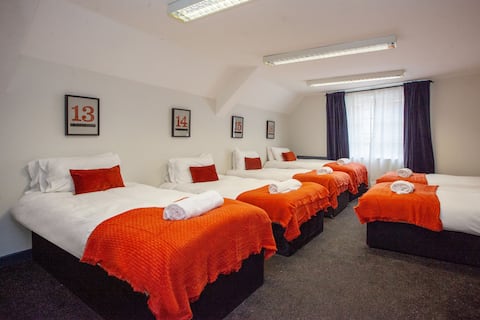
Hen & Stag pad with inside hot tub & party room
Entire Place • 6 bedrooms
higgihaus 107 Sleeps up to 22 Hens Stags
Entire Place • 4 bedrooms

higgihaus 5 Sleeps 14-16 Hens Stags Big
Entire Place • 7 bedrooms
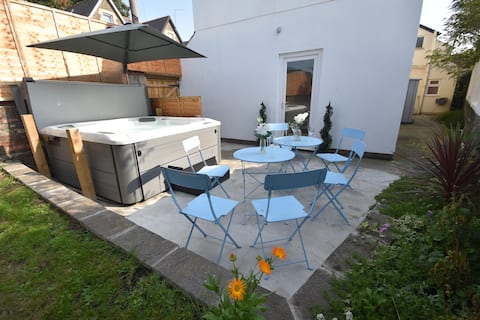
Hot tub staghouse near city center, garden & games arcade
Entire Place • 4 bedrooms

City hot tub stag house nr city centre & games rm
Entire Place • 4 bedrooms

Family home with fabulous space/great location
Entire Place • 3 bedrooms
Note: Performance varies based on location, size, amenities, seasonality, and management quality. Data reflects the past 12 months.
Top Performing Airbnb Hosts in Cardiff (2026)
Learn from the best! This table showcases top-performing Airbnb hosts in Cardiff based on the number of properties managed and estimated total revenue over the past year. Analyze their scale and performance metrics.
| Host Name | Properties | Grossing Revenue | Stay Reviews | Avg Rating |
|---|---|---|---|---|
| Cohost Partners | 48 | $1,811,697 | 968 | 4.40/5.0 |
| Jaymin | 44 | $1,312,308 | 2504 | 4.73/5.0 |
| StayRight | 40 | $900,864 | 561 | 4.19/5.0 |
| Claire | 29 | $819,990 | 726 | 4.73/5.0 |
| Qasim | 8 | $746,052 | 164 | 4.06/5.0 |
| Property Promise | 21 | $734,145 | 1679 | 4.33/5.0 |
| Luke | 7 | $721,736 | 194 | 4.80/5.0 |
| Mike | 17 | $631,279 | 1310 | 4.77/5.0 |
| Sarah | 4 | $540,112 | 281 | 4.82/5.0 |
| Jay | 12 | $505,306 | 1033 | 4.92/5.0 |
Analyzing the strategies of top hosts, such as their property selection, pricing, and guest communication, can offer valuable lessons for optimizing your own Airbnb operations in Cardiff.
Dive Deeper: Advanced Cardiff STR Market Data (2026)
Ready to unlock more insights? AirROI provides access to advanced metrics and comprehensive Airbnb data for Cardiff. Explore detailed analytics beyond this report to refine your investment strategy, optimize pricing, and maximize your vacation rental profits.
Explore Advanced MetricsCardiff Short-Term Rental Market Composition (2026): Property & Room Types
Room Type Distribution
Property Type Distribution
Market Composition Insights for Cardiff
- The Cardiff Airbnb market composition is heavily skewed towards Entire Home/Apt listings, which make up 76.9% of the 1,474 active rentals. This indicates strong guest preference for privacy and space.
- Looking at the property type distribution in Cardiff, Apartment/Condo properties are the most common (52.3%), reflecting the local real estate landscape.
- Houses represent a significant 41.9% portion, catering likely to families or larger groups.
- Smaller segments like hotel/boutique, others, outdoor/unique, unique stays (combined 5.8%) offer potential for unique stay experiences.
Cardiff Airbnb Room Capacity Analysis (2026): Bedroom Distribution
Distribution of Listings by Number of Bedrooms
Room Capacity Insights for Cardiff
- The dominant room capacity in Cardiff is 1 bedroom listings, making up 29.6% of the market. This suggests a strong demand for properties suitable for couples or solo travelers.
- Together, 1 bedroom and 2 bedrooms properties represent 58.6% of the active Airbnb listings in Cardiff, indicating a high concentration in these sizes.
- A significant 21.8% of listings offer 3+ bedrooms, catering to larger groups and families seeking more space in Cardiff.
Cardiff Vacation Rental Guest Capacity Trends (2026)
Distribution of Listings by Guest Capacity
Guest Capacity Insights for Cardiff
- The most common guest capacity trend in Cardiff vacation rentals is listings accommodating 4 guests (21.9%). This suggests the primary traveler segment is likely small families or groups.
- Properties designed for 4 guests and 2 guests dominate the Cardiff STR market, accounting for 41.4% of listings.
- 27.2% of properties accommodate 6+ guests, serving the market segment for larger families or group travel in Cardiff.
- On average, properties in Cardiff are equipped to host 3.6 guests.
Cardiff Airbnb Booking Patterns (2026): Available vs. Booked Days
Available Days Distribution
Booked Days Distribution
Booking Pattern Insights for Cardiff
- The most common availability pattern in Cardiff falls within the 271-366 days range, representing 42.8% of listings. This suggests many properties have significant open periods on their calendars.
- Approximately 74.8% of listings show high availability (181+ days open annually), indicating potential for increased bookings or specific owner usage patterns.
- For booked days, the 91-180 days range is most frequent in Cardiff (32.4%), reflecting common guest stay durations or potential owner blocking patterns.
- A notable 26.4% of properties secure long booking periods (181+ days booked per year), highlighting successful long-term rental strategies or significant owner usage.
Cardiff Airbnb Minimum Stay Requirements Analysis
Distribution of Listings by Minimum Night Requirement
1 Night
610 listings
41.5% of total
2 Nights
205 listings
13.9% of total
3 Nights
20 listings
1.4% of total
4-6 Nights
72 listings
4.9% of total
7-29 Nights
71 listings
4.8% of total
30+ Nights
493 listings
33.5% of total
Key Insights
- The most prevalent minimum stay requirement in Cardiff is 1 Night, adopted by 41.5% of listings. This highlights the market's preference for shorter, flexible bookings.
- A significant segment (33.5%) caters to monthly stays (30+ nights) in Cardiff, pointing to opportunities in the extended-stay market.
Recommendations
- Align with the market by considering a 1 Night minimum stay, as 41.5% of Cardiff hosts use this setting.
- Explore offering discounts for stays of 30+ nights to attract the 33.5% of the market seeking extended stays.
- Adjust minimum nights based on seasonality – potentially shorter during low season and longer during peak demand periods in Cardiff.
Cardiff Airbnb Cancellation Policy Trends Analysis (2026)
Super Strict 30 Days
15 listings
1% of total
Refundable
2 listings
0.1% of total
Super Strict 60 Days
55 listings
3.7% of total
Limited
9 listings
0.6% of total
Non-refundable
1 listings
0.1% of total
Flexible
315 listings
21.4% of total
Moderate
460 listings
31.3% of total
Firm
428 listings
29.1% of total
Strict
184 listings
12.5% of total
Cancellation Policy Insights for Cardiff
- The prevailing Airbnb cancellation policy trend in Cardiff is Moderate, used by 31.3% of listings.
- There's a relatively balanced mix between guest-friendly (52.7%) and stricter (41.6%) policies, offering choices for different guest needs.
Recommendations for Hosts
- Consider adopting a Moderate policy to align with the 31.3% market standard in Cardiff.
- Using a Strict policy might deter some guests, as only 12.5% of listings use it. Evaluate if potential revenue protection outweighs possible lower booking rates.
- Regularly review your cancellation policy against competitors and market demand shifts in Cardiff.
Cardiff STR Booking Lead Time Analysis (2026)
Average Booking Lead Time by Month
Booking Lead Time Insights for Cardiff
- The overall average booking lead time for vacation rentals in Cardiff is 61 days.
- Guests book furthest in advance for stays during July (average 95 days), likely coinciding with peak travel demand or local events.
- The shortest booking windows occur for stays in January (average 35 days), indicating more last-minute travel plans during this time.
- Seasonally, Summer (71 days avg.) sees the longest lead times, while Winter (44 days avg.) has the shortest, reflecting typical travel planning cycles.
Recommendations for Hosts
- Use the overall average lead time (61 days) as a baseline for your pricing and availability strategy in Cardiff.
- For July stays, consider implementing length-of-stay discounts or slightly higher rates for bookings made less than 95 days out to capitalize on advance planning.
- Target marketing efforts for the Summer season well in advance (at least 71 days) to capture early planners.
- Monitor your own booking lead times against these Cardiff averages to identify opportunities for dynamic pricing adjustments.
Popular & Essential Airbnb Amenities in Cardiff (2026)
Amenity Prevalence
Amenity Insights for Cardiff
- Essential amenities in Cardiff that guests expect include: Wifi, Smoke alarm. Lacking these (any) could significantly impact bookings.
- Popular amenities like Heating, Kitchen, TV are common but not universal. Offering these can provide a competitive edge.
Recommendations for Hosts
- Ensure your listing includes all essential amenities for Cardiff: Wifi, Smoke alarm.
- Prioritize adding missing essentials: Wifi, Smoke alarm.
- Consider adding popular differentiators like Heating or Kitchen to increase appeal.
- Highlight unique or less common amenities you offer (e.g., hot tub, dedicated workspace, EV charger) in your listing description and photos.
- Regularly check competitor amenities in Cardiff to stay competitive.
Cardiff Airbnb Guest Demographics & Profile Analysis (2026)
Guest Profile Summary for Cardiff
- The typical guest profile for Airbnb in Cardiff consists of primarily domestic travelers (77%), often arriving from nearby England, typically belonging to the Post-2000s (Gen Z/Alpha) group (50%), primarily speaking English or French.
- Domestic travelers account for 76.8% of guests.
- Key international markets include United Kingdom (76.8%) and United States (5.2%).
- Top languages spoken are English (60.2%) followed by French (8.4%).
- A significant demographic segment is the Post-2000s (Gen Z/Alpha) group, representing 50% of guests.
Recommendations for Hosts
- Target domestic marketing efforts towards travelers from England and London.
- Tailor amenities and listing descriptions to appeal to the dominant Post-2000s (Gen Z/Alpha) demographic (e.g., highlight fast WiFi, smart home features, local guides).
- Highlight unique local experiences or amenities relevant to the primary guest profile.
- Consider seasonal promotions aligned with peak travel times for key origin markets.
Nearby Short-Term Rental Market Comparison
How does the Cardiff Airbnb market stack up against its neighbors? Compare key performance metrics like average monthly revenue, ADR, and occupancy rates in surrounding areas to understand the broader regional STR landscape.
| Market | Active Properties | Monthly Revenue | Daily Rate | Avg. Occupancy |
|---|---|---|---|---|
| Chew Magna | 13 | $7,041 | $430.65 | 44% |
| Englishcombe | 15 | $6,734 | $511.35 | 53% |
| East Knoyle | 10 | $6,300 | $407.06 | 44% |
| Long Sutton | 18 | $6,029 | $383.58 | 46% |
| Withington | 10 | $5,690 | $499.79 | 44% |
| Ashley | 13 | $5,497 | $364.68 | 54% |
| Bont-dolgadfan | 10 | $5,458 | $293.24 | 58% |
| Freshford | 12 | $5,333 | $317.81 | 58% |
| Grosmont | 11 | $5,211 | $459.67 | 55% |
| Milverton | 10 | $5,067 | $377.17 | 48% |