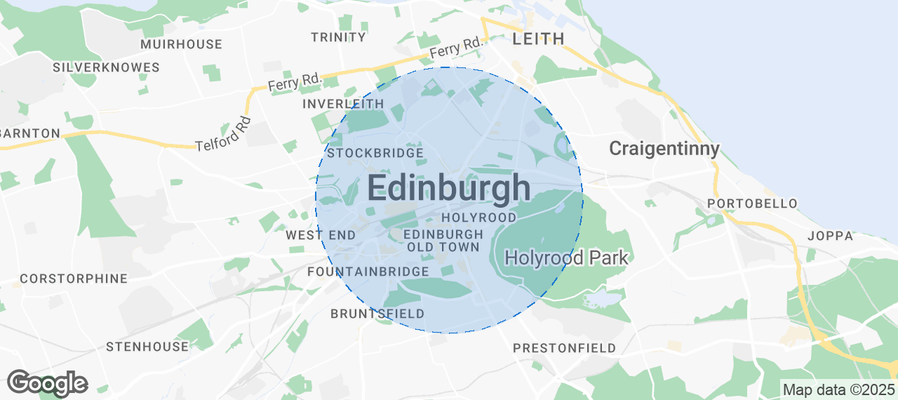
Edinburgh Airbnb Market Analysis 2026: Short Term Rental Data & Vacation Rental Statistics in Scotland, United Kingdom
Is Airbnb profitable in Edinburgh in 2026? Explore comprehensive Airbnb analytics for Edinburgh, Scotland, United Kingdom to uncover income potential. This 2026 STR market report for Edinburgh, based on AirROI data from February 2025 to January 2026, reveals key trends in the market of 363 active listings.
Whether you're considering an Airbnb investment in Edinburgh, optimizing your existing vacation rental, or exploring rental arbitrage opportunities, understanding the Edinburgh Airbnb data is crucial. Understanding the local regulations is key to maximizing your short term rental income potential. Let's dive into the specifics.
Key Edinburgh Airbnb Performance Metrics Overview
Monthly Airbnb Revenue Variations & Income Potential in Edinburgh (2026)
Understanding the monthly revenue variations for Airbnb listings in Edinburgh is key to maximizing your short term rental income potential. Seasonality significantly impacts earnings. Our analysis, based on data from the past 12 months, shows that the peak revenue month for STRs in Edinburgh is typically August, while May often presents the lowest earnings, highlighting opportunities for strategic pricing adjustments during shoulder and low seasons. Explore the typical Airbnb income in Edinburgh across different performance tiers:
- Best-in-class properties (Top 10%) achieve $8,926+ monthly, often utilizing dynamic pricing and superior guest experiences.
- Strong performing properties (Top 25%) earn $6,652 or more, indicating effective management and desirable locations/amenities.
- Typical properties (Median) generate around $4,432 per month, representing the average market performance.
- Entry-level properties (Bottom 25%) see earnings around $2,726, often with potential for optimization.
Average Monthly Airbnb Earnings Trend in Edinburgh
Edinburgh Airbnb Occupancy Rate Trends (2026)
Maximize your bookings by understanding the Edinburgh STR occupancy trends. Seasonal demand shifts significantly influence how often properties are booked. Typically, Augustsees the highest demand (peak season occupancy), while May experiences the lowest (low season). Effective strategies, like adjusting minimum stays or offering promotions, can boost occupancy during slower periods. Here's how different property tiers perform in Edinburgh:
- Best-in-class properties (Top 10%) achieve 74%+ occupancy, indicating high desirability and potentially optimized availability.
- Strong performing properties (Top 25%) maintain 65% or higher occupancy, suggesting good market fit and guest satisfaction.
- Typical properties (Median) have an occupancy rate around 53%.
- Entry-level properties (Bottom 25%) average 35% occupancy, potentially facing higher vacancy.
Average Monthly Occupancy Rate Trend in Edinburgh
Average Daily Rate (ADR) Airbnb Trends in Edinburgh (2026)
Effective short term rental pricing strategy in Edinburgh involves understanding monthly ADR fluctuations. The Average Daily Rate (ADR) for Airbnb in Edinburgh typically peaks in August and dips lowest during January. Leveraging Airbnb dynamic pricing tools or strategies based on this seasonality can significantly boost revenue. Here's a look at the typical nightly rates achieved:
- Best-in-class properties (Top 10%) command rates of $545+ per night, often due to premium features or locations.
- Strong performing properties (Top 25%) achieve nightly rates of $397 or more.
- Typical properties (Median) charge around $299 per night.
- Entry-level properties (Bottom 25%) earn around $205 per night.
Average Daily Rate (ADR) Trend by Month in Edinburgh
Get Live Edinburgh Market Intelligence 👇
Explore Real-time Analytics
Airbnb Seasonality Analysis & Trends in Edinburgh (2026)
Peak Season (August, June, July)
- Revenue averages $7,507 per month
- Occupancy rates average 65.8%
- Daily rates average $370
Shoulder Season
- Revenue averages $4,380 per month
- Occupancy maintains around 47.6%
- Daily rates hold near $291
Low Season (February, March, May)
- Revenue drops to average $541 per month
- Occupancy decreases to average 4.7%
- Daily rates adjust to average $364
Seasonality Insights for Edinburgh
- The Airbnb seasonality in Edinburgh shows highly seasonal trends requiring careful strategy. While the sections above show seasonal averages, it's also insightful to look at the extremes:
- During the high season, the absolute peak month showcases Edinburgh's highest earning potential, with monthly revenues capable of climbing to $7,927, occupancy reaching a high of 67.5%, and ADRs peaking at $386.
- Conversely, the slowest single month of the year, typically falling within the low season, marks the market's lowest point. In this month, revenue might dip to $0, occupancy could drop to 0.0%, and ADRs may adjust down to $246.
- Understanding both the seasonal averages and these monthly peaks and troughs in revenue, occupancy, and ADR is crucial for maximizing your Airbnb profit potential in Edinburgh.
Seasonal Strategies for Maximizing Profit
- Peak Season: Maximize revenue through premium pricing and potentially longer minimum stays. Ensure high availability.
- Low Season: Offer competitive pricing, special promotions (e.g., extended stay discounts), and flexible cancellation policies. Target off-season travelers like remote workers or budget-conscious guests.
- Shoulder Seasons: Implement dynamic pricing that balances peak and low rates. Target weekend travelers or specific events. Offer slightly more flexible terms than peak season.
- Regularly analyze your own performance against these Edinburgh seasonality benchmarks and adjust your pricing and availability strategy accordingly.
Best Areas for Airbnb Investment in Edinburgh (2026)
Exploring the top neighborhoods for short-term rentals in Edinburgh? This section highlights key areas, outlining why they are attractive for hosts and guests, along with notable local attractions. Consider these locations based on your target guest profile and investment strategy.
| Neighborhood / Area | Why Host Here? (Target Guests & Appeal) | Key Attractions & Landmarks |
|---|---|---|
| Old Town | Historic heart of Edinburgh, home to iconic landmarks and a vibrant atmosphere. Perfect for tourists wanting to explore Edinburgh's rich heritage. | Edinburgh Castle, Royal Mile, Holyrood Palace, St Giles' Cathedral, Scott Monument, Scotch Whisky Experience |
| New Town | Georgian architecture and a UNESCO World Heritage site with shops, restaurants, and a more contemporary vibe. Attracts visitors looking for both history and modern comforts. | Princes Street, George Street, Scott Monument, National Gallery of Scotland, Calton Hill, Charlotte Square |
| Leith | Once a bustling port, now a trendy area known for its waterfront, restaurants, and arts scene. Ideal for those seeking a more local experience away from the tourist spots. | Royal Yacht Britannia, Leith Walk, Ocean Terminal, Leith Theatre, Water of Leith Walkway, Docklands |
| Portobello | Famous for its beach and seaside promenade, Portobello is a charming area attracting families and beach lovers. Offers a unique coastal experience within the city. | Portobello Beach, Promenade, Portobello Swim Centre, The Velvet Easel Gallery, The Dreadnought, The Espy |
| West End | Trendy area close to attractions like the Usher Hall and the Scottish National Gallery of Modern Art. Popular for both leisure and business travelers. | Usher Hall, Scottish National Gallery of Modern Art, The Water of Leith, St Mary's Cathedral, The Cameo Cinema, The Edinburgh International Festival |
| Bruntsfield | A lively neighborhood with a mix of cafes, independent shops, and parks. It appeals to students and young professionals due to its vibrant community. | Bruntsfield Links, The Meadows, Cameo Cinema, Bruntsfield Place, The Church Hill Theatre, Local cafes and eateries |
| Morningside | Known for its charming streets, independent shops, and proximity to the beautiful Pentland Hills. Great for families and those seeking a quiet neighborhood with amenities. | Morningside Park, The Botanics, Church Hill Theatre, Local boutiques, Morningside Golf Club, Cafés and restaurants |
| Stockbridge | A picturesque neighborhood with a village feel, renowned for its local markets and food scene. Ideal for visitors looking for an authentic Edinburgh experience. | Stockbridge Market, Water of Leith, Inverleith Park, St Stephen's Church, Local shops and eateries, The Botanic Garden |
Understanding Airbnb License Requirements & STR Laws in Edinburgh (2026)
With 18% of listings showing registration in 2026, understanding potential Airbnb license requirements is crucial in Edinburgh. Always verify the latest short term rental regulations and Airbnb license requirements directly with local government authorities for Edinburgh to ensure full compliance before hosting.
(Source: AirROI data, 2026, based on 18% licensed listings)
Top Performing Airbnb Properties in Edinburgh (2026)
Benchmark your potential! Explore examples of top-performing Airbnb properties in Edinburghbased on Trailing Twelve Month (TTM) revenue. Analyze their characteristics, revenue, occupancy rate, and ADR to understand what drives success in this market.

Prestigious City Centre Private Entrance House
Entire Place • 4 bedrooms

The Jewel Box, Luxury 4 Bed 3 Bath Penthouse Apt
Entire Place • 4 bedrooms

Private and Prestigious Luxury Home
Entire Place • 6 bedrooms

Elegant 3-BR Central Princes Street Apt with View
Entire Place • 3 bedrooms

Luxury New Town 4-Bed with Views
Entire Place • 4 bedrooms

Bell Suite - 2 Bed 2 Bath Luxury Apartment
Entire Place • 2 bedrooms
Note: Performance varies based on location, size, amenities, seasonality, and management quality. Data reflects the past 12 months.
Top Performing Airbnb Hosts in Edinburgh (2026)
Learn from the best! This table showcases top-performing Airbnb hosts in Edinburgh based on the number of properties managed and estimated total revenue over the past year. Analyze their scale and performance metrics.
| Host Name | Properties | Grossing Revenue | Stay Reviews | Avg Rating |
|---|---|---|---|---|
| Joivy Scotland | 19 | $901,257 | 182 | 4.55/5.0 |
| Dragon | 15 | $817,308 | 62 | 4.81/5.0 |
| Craig | 9 | $500,809 | 255 | 4.86/5.0 |
| Host-Ed | 7 | $449,150 | 96 | 4.91/5.0 |
| Mystayinn Limited | 15 | $418,746 | 193 | 4.29/5.0 |
| Karin Louise | 7 | $372,187 | 55 | 4.67/5.0 |
| Rentir | 7 | $343,899 | 203 | 4.81/5.0 |
| Levi | 6 | $333,740 | 152 | 4.89/5.0 |
| Doug | 6 | $281,180 | 219 | 4.92/5.0 |
| Aaron | 2 | $199,498 | 134 | 4.68/5.0 |
Analyzing the strategies of top hosts, such as their property selection, pricing, and guest communication, can offer valuable lessons for optimizing your own Airbnb operations in Edinburgh.
Dive Deeper: Advanced Edinburgh STR Market Data (2026)
Ready to unlock more insights? AirROI provides access to advanced metrics and comprehensive Airbnb data for Edinburgh. Explore detailed analytics beyond this report to refine your investment strategy, optimize pricing, and maximize your vacation rental profits.
Explore Advanced MetricsEdinburgh Short-Term Rental Market Composition (2026): Property & Room Types
Room Type Distribution
Property Type Distribution
Market Composition Insights for Edinburgh
- The Edinburgh Airbnb market composition is heavily skewed towards Entire Home/Apt listings, which make up 76.3% of the 363 active rentals. This indicates strong guest preference for privacy and space.
- Looking at the property type distribution in Edinburgh, Apartment/Condo properties are the most common (83.2%), reflecting the local real estate landscape.
- Smaller segments like hotel/boutique, others, outdoor/unique (combined 2.3%) offer potential for unique stay experiences.
Edinburgh Airbnb Room Capacity Analysis (2026): Bedroom Distribution
Distribution of Listings by Number of Bedrooms
Room Capacity Insights for Edinburgh
- The dominant room capacity in Edinburgh is 2 bedrooms listings, making up 33.1% of the market. This suggests a strong demand for properties suitable for couples or solo travelers.
- Together, 2 bedrooms and 1 bedroom properties represent 60.9% of the active Airbnb listings in Edinburgh, indicating a high concentration in these sizes.
Edinburgh Vacation Rental Guest Capacity Trends (2026)
Distribution of Listings by Guest Capacity
Guest Capacity Insights for Edinburgh
- The most common guest capacity trend in Edinburgh vacation rentals is listings accommodating 4 guests (33.1%). This suggests the primary traveler segment is likely small families or groups.
- Properties designed for 4 guests and 2 guests dominate the Edinburgh STR market, accounting for 52.1% of listings.
- 17.9% of properties accommodate 6+ guests, serving the market segment for larger families or group travel in Edinburgh.
- On average, properties in Edinburgh are equipped to host 3.3 guests.
Edinburgh Airbnb Booking Patterns (2026): Available vs. Booked Days
Available Days Distribution
Booked Days Distribution
Booking Pattern Insights for Edinburgh
- The most common availability pattern in Edinburgh falls within the 181-270 days range, representing 44.4% of listings. This suggests many properties have significant open periods on their calendars.
- Approximately 83.5% of listings show high availability (181+ days open annually), indicating potential for increased bookings or specific owner usage patterns.
- For booked days, the 91-180 days range is most frequent in Edinburgh (46%), reflecting common guest stay durations or potential owner blocking patterns.
- A notable 17.9% of properties secure long booking periods (181+ days booked per year), highlighting successful long-term rental strategies or significant owner usage.
Edinburgh Airbnb Minimum Stay Requirements Analysis
Distribution of Listings by Minimum Night Requirement
1 Night
65 listings
17.9% of total
2 Nights
58 listings
16% of total
3 Nights
22 listings
6.1% of total
4-6 Nights
11 listings
3% of total
7-29 Nights
8 listings
2.2% of total
30+ Nights
199 listings
54.8% of total
Key Insights
- The most prevalent minimum stay requirement in Edinburgh is 30+ Nights, adopted by 54.8% of listings. This highlights the market's preference for longer commitments.
- A significant segment (54.8%) caters to monthly stays (30+ nights) in Edinburgh, pointing to opportunities in the extended-stay market.
Recommendations
- Align with the market by considering a 30+ Nights minimum stay, as 54.8% of Edinburgh hosts use this setting.
- If feasible, allowing 1-night stays, especially midweek or during low season, could capture last-minute bookings, as only 17.9% currently do.
- Explore offering discounts for stays of 30+ nights to attract the 54.8% of the market seeking extended stays.
- Adjust minimum nights based on seasonality – potentially shorter during low season and longer during peak demand periods in Edinburgh.
Edinburgh Airbnb Cancellation Policy Trends Analysis (2026)
Super Strict 60 Days
9 listings
2.5% of total
Super Strict 30 Days
9 listings
2.5% of total
Limited
9 listings
2.5% of total
Flexible
67 listings
18.5% of total
Moderate
99 listings
27.3% of total
Firm
147 listings
40.5% of total
Strict
23 listings
6.3% of total
Cancellation Policy Insights for Edinburgh
- The prevailing Airbnb cancellation policy trend in Edinburgh is Firm, used by 40.5% of listings.
- There's a relatively balanced mix between guest-friendly (45.8%) and stricter (46.8%) policies, offering choices for different guest needs.
- Strict cancellation policies are quite rare (6.3%), potentially making listings with this policy less competitive unless justified by high demand or property type.
Recommendations for Hosts
- Consider adopting a Firm policy to align with the 40.5% market standard in Edinburgh.
- Using a Strict policy might deter some guests, as only 6.3% of listings use it. Evaluate if potential revenue protection outweighs possible lower booking rates.
- Regularly review your cancellation policy against competitors and market demand shifts in Edinburgh.
Edinburgh STR Booking Lead Time Analysis (2026)
Average Booking Lead Time by Month
Booking Lead Time Insights for Edinburgh
- The overall average booking lead time for vacation rentals in Edinburgh is 32 days.
- Guests book furthest in advance for stays during November (average 47 days), likely coinciding with peak travel demand or local events.
- The shortest booking windows occur for stays in March (average 0 days), indicating more last-minute travel plans during this time.
- Seasonally, Fall (45 days avg.) sees the longest lead times, while Spring (8 days avg.) has the shortest, reflecting typical travel planning cycles.
Recommendations for Hosts
- Use the overall average lead time (32 days) as a baseline for your pricing and availability strategy in Edinburgh.
- For November stays, consider implementing length-of-stay discounts or slightly higher rates for bookings made less than 47 days out to capitalize on advance planning.
- During March, focus on last-minute booking availability and promotions, as guests book with very short notice (0 days avg.).
- Target marketing efforts for the Fall season well in advance (at least 45 days) to capture early planners.
- Monitor your own booking lead times against these Edinburgh averages to identify opportunities for dynamic pricing adjustments.
Popular & Essential Airbnb Amenities in Edinburgh (2026)
Amenity Prevalence
Amenity Insights for Edinburgh
- Essential amenities in Edinburgh that guests expect include: Wifi, Smoke alarm. Lacking these (any) could significantly impact bookings.
- Popular amenities like Heating, Kitchen, Washer are common but not universal. Offering these can provide a competitive edge.
Recommendations for Hosts
- Ensure your listing includes all essential amenities for Edinburgh: Wifi, Smoke alarm.
- Prioritize adding missing essentials: Wifi, Smoke alarm.
- Consider adding popular differentiators like Heating or Kitchen to increase appeal.
- Highlight unique or less common amenities you offer (e.g., hot tub, dedicated workspace, EV charger) in your listing description and photos.
- Regularly check competitor amenities in Edinburgh to stay competitive.
Edinburgh Airbnb Guest Demographics & Profile Analysis (2026)
Guest Profile Summary for Edinburgh
- The typical guest profile for Airbnb in Edinburgh consists of predominantly international visitors (72%), with top international origins including United States, typically belonging to the Post-2000s (Gen Z/Alpha) group (50%), primarily speaking English or French.
- Domestic travelers account for 28.4% of guests.
- Key international markets include United Kingdom (28.4%) and United States (24.3%).
- Top languages spoken are English (49.4%) followed by French (11%).
- A significant demographic segment is the Post-2000s (Gen Z/Alpha) group, representing 50% of guests.
Recommendations for Hosts
- Focus marketing internationally, particularly towards travelers from United States.
- Tailor amenities and listing descriptions to appeal to the dominant Post-2000s (Gen Z/Alpha) demographic (e.g., highlight fast WiFi, smart home features, local guides).
- Highlight unique local experiences or amenities relevant to the primary guest profile.
- Consider seasonal promotions aligned with peak travel times for key origin markets.
Nearby Short-Term Rental Market Comparison
How does the Edinburgh Airbnb market stack up against its neighbors? Compare key performance metrics like average monthly revenue, ADR, and occupancy rates in surrounding areas to understand the broader regional STR landscape.
| Market | Active Properties | Monthly Revenue | Daily Rate | Avg. Occupancy |
|---|---|---|---|---|
| Ardlui | 10 | $6,556 | $714.77 | 30% |
| Bridge of Cally | 18 | $6,245 | $629.64 | 46% |
| Dalkeith | 10 | $5,775 | $478.16 | 55% |
| Larbert | 10 | $5,686 | $322.43 | 56% |
| Gartocharn | 16 | $5,313 | $437.25 | 47% |
| Acharn | 11 | $5,066 | $284.21 | 61% |
| Luss | 18 | $5,059 | $381.65 | 49% |
| Arrochar | 34 | $4,898 | $344.76 | 53% |
| Fearnan | 22 | $4,850 | $439.88 | 41% |
| Buttermere | 14 | $4,802 | $415.13 | 49% |