Clydebank Airbnb Market Analysis 2025: Short Term Rental Data & Vacation Rental Statistics in Scotland, United Kingdom
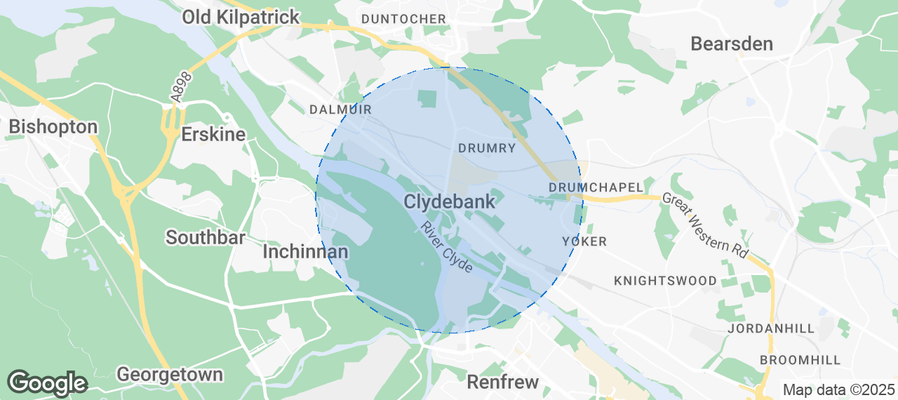
Is Airbnb profitable in Clydebank in 2025? Explore comprehensive Airbnb analytics for Clydebank, Scotland, United Kingdom to uncover income potential. This 2025 STR market report for Clydebank, based on AirROI data from August 2024 to July 2025, reveals key trends in the niche market of 18 active listings.
Whether you're considering an Airbnb investment in Clydebank, optimizing your existing vacation rental, or exploring rental arbitrage opportunities, understanding the Clydebank Airbnb data is crucial. Leveraging the low regulation environment is key to maximizing your short term rental income potential. Let's dive into the specifics.
Key Clydebank Airbnb Performance Metrics Overview
Monthly Airbnb Revenue Variations & Income Potential in Clydebank (2025)
Understanding the monthly revenue variations for Airbnb listings in Clydebank is key to maximizing your short term rental income potential. Seasonality significantly impacts earnings. Our analysis, based on data from the past 12 months, shows that the peak revenue month for STRs in Clydebank is typically July, while February often presents the lowest earnings, highlighting opportunities for strategic pricing adjustments during shoulder and low seasons. Explore the typical Airbnb income in Clydebank across different performance tiers:
- Best-in-class properties (Top 10%) achieve $4,692+ monthly, often utilizing dynamic pricing and superior guest experiences.
- Strong performing properties (Top 25%) earn $3,201 or more, indicating effective management and desirable locations/amenities.
- Typical properties (Median) generate around $2,005 per month, representing the average market performance.
- Entry-level properties (Bottom 25%) see earnings around $1,218, often with potential for optimization.
Average Monthly Airbnb Earnings Trend in Clydebank
Clydebank Airbnb Occupancy Rate Trends (2025)
Maximize your bookings by understanding the Clydebank STR occupancy trends. Seasonal demand shifts significantly influence how often properties are booked. Typically, Octobersees the highest demand (peak season occupancy), while December experiences the lowest (low season). Effective strategies, like adjusting minimum stays or offering promotions, can boost occupancy during slower periods. Here's how different property tiers perform in Clydebank:
- Best-in-class properties (Top 10%) achieve 81%+ occupancy, indicating high desirability and potentially optimized availability.
- Strong performing properties (Top 25%) maintain 67% or higher occupancy, suggesting good market fit and guest satisfaction.
- Typical properties (Median) have an occupancy rate around 46%.
- Entry-level properties (Bottom 25%) average 25% occupancy, potentially facing higher vacancy.
Average Monthly Occupancy Rate Trend in Clydebank
Average Daily Rate (ADR) Airbnb Trends in Clydebank (2025)
Effective short term rental pricing strategy in Clydebank involves understanding monthly ADR fluctuations. The Average Daily Rate (ADR) for Airbnb in Clydebank typically peaks in July and dips lowest during February. Leveraging Airbnb dynamic pricing tools or strategies based on this seasonality can significantly boost revenue. Here's a look at the typical nightly rates achieved:
- Best-in-class properties (Top 10%) command rates of $321+ per night, often due to premium features or locations.
- Strong performing properties (Top 25%) achieve nightly rates of $251 or more.
- Typical properties (Median) charge around $174 per night.
- Entry-level properties (Bottom 25%) earn around $104 per night.
Average Daily Rate (ADR) Trend by Month in Clydebank
Get Live Clydebank Market Intelligence 👇
Explore Real-time Analytics
Airbnb Seasonality Analysis & Trends in Clydebank (2025)
Peak Season (July, June, October)
- Revenue averages $3,410 per month
- Occupancy rates average 51.0%
- Daily rates average $246
Shoulder Season
- Revenue averages $2,374 per month
- Occupancy maintains around 48.6%
- Daily rates hold near $178
Low Season (January, February, November)
- Revenue drops to average $1,671 per month
- Occupancy decreases to average 39.7%
- Daily rates adjust to average $150
Seasonality Insights for Clydebank
- The Airbnb seasonality in Clydebank shows highly seasonal trends requiring careful strategy. While the sections above show seasonal averages, it's also insightful to look at the extremes:
- During the high season, the absolute peak month showcases Clydebank's highest earning potential, with monthly revenues capable of climbing to $4,110, occupancy reaching a high of 59.5%, and ADRs peaking at $338.
- Conversely, the slowest single month of the year, typically falling within the low season, marks the market's lowest point. In this month, revenue might dip to $1,421, occupancy could drop to 36.2%, and ADRs may adjust down to $143.
- Understanding both the seasonal averages and these monthly peaks and troughs in revenue, occupancy, and ADR is crucial for maximizing your Airbnb profit potential in Clydebank.
Seasonal Strategies for Maximizing Profit
- Peak Season: Maximize revenue through premium pricing and potentially longer minimum stays. Ensure high availability.
- Low Season: Offer competitive pricing, special promotions (e.g., extended stay discounts), and flexible cancellation policies. Target off-season travelers like remote workers or budget-conscious guests.
- Shoulder Seasons: Implement dynamic pricing that balances peak and low rates. Target weekend travelers or specific events. Offer slightly more flexible terms than peak season.
- Regularly analyze your own performance against these Clydebank seasonality benchmarks and adjust your pricing and availability strategy accordingly.
Best Areas for Airbnb Investment in Clydebank (2025)
Exploring the top neighborhoods for short-term rentals in Clydebank? This section highlights key areas, outlining why they are attractive for hosts and guests, along with notable local attractions. Consider these locations based on your target guest profile and investment strategy.
| Neighborhood / Area | Why Host Here? (Target Guests & Appeal) | Key Attractions & Landmarks |
|---|---|---|
| Clydebank Town Centre | The bustling heart of Clydebank, offering shops, restaurants, and easy transport links. It's ideal for visitors looking to explore the town and nearby attractions. | Clyde Shopping Centre, Kilbowie Cemetery, Clydebank Museum and Art Gallery, Titan Crane, Clydebank War Memorial |
| Duntocher | A quieter, residential area with a charming village feel. Great for families and those looking to enjoy nature and local parks. | Duntocher Cemetery, Clydebank Football Club, Duntocher Village, Clydebank Golf Club |
| Old Kilpatrick | A historic area with scenic views of the River Clyde and access to outdoor activities. Attractive for visitors interested in hiking and historical sites. | Wildlife Park at Old Kilpatrick, Eagle'sham Moor, Old Kilpatrick Parish Church, The Antonine Wall |
| Yoker | A picturesque riverside area with good transport links to Glasgow. Ideal for travelers wanting a peaceful environment while being close to the city. | Yoker Railway Station, Clydebank Marina, Clyde Coastal Path, The River Clyde |
| Clydebank Riverside | Developed along the River Clyde, this area features modern waterfront investments, making it appealing for leisure and business travelers. | Clydebank Waterworks, Clydebank Business Park, Riverside Museum, Transport Museum |
| Knightswood | A popular suburban area with parks and local amenities, attracting families and those seeking a residential experience close to urban attractions. | Knightswood Park, Knightswood Golf Club, Knightswood Cultural Centre |
| Whitecrook | A historically significant area near Clydebank, ideal for guests interested in history and local culture amidst a suburban setting. | Clydebank War Memorial, Whitecrook Park, Langcraigs Railway |
| Garscadden | A growing suburban neighborhood known for its schools and parks, perfect for families and travelers looking for a homey, community feel. | Garscadden Wood, Garscadden Park, Local shops and amenities |
Understanding Airbnb License Requirements & STR Laws in Clydebank (2025)
While Clydebank, Scotland, United Kingdom currently shows low STR regulations, specific Airbnb license requirements might still exist or change. Always verify the latest short term rental regulations and Airbnb license requirements directly with local government authorities for Clydebank to ensure full compliance before hosting.
(Source: AirROI data, 2025, finding no licensed listings among those analyzed)
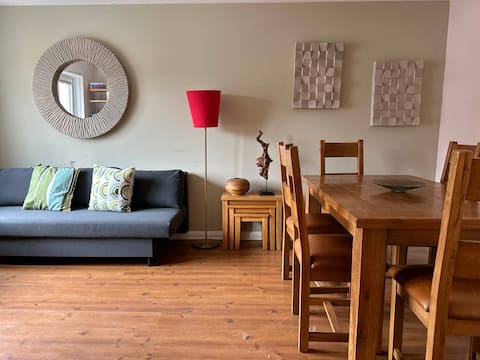
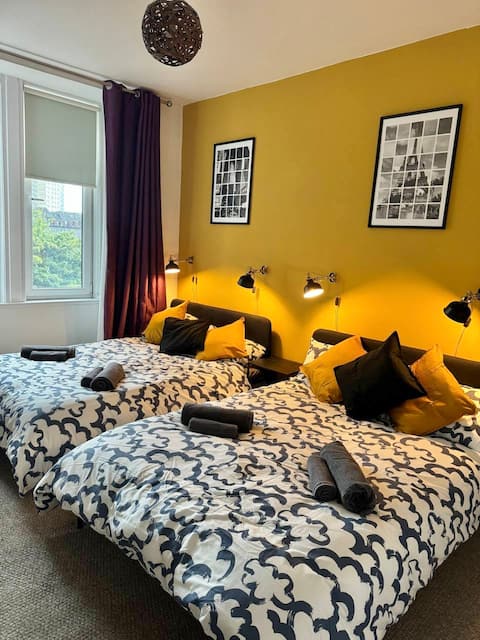
Top Performing Airbnb Properties in Clydebank (2025)
Benchmark your potential! Explore examples of top-performing Airbnb properties in Clydebankbased on Trailing Twelve Month (TTM) revenue. Analyze their characteristics, revenue, occupancy rate, and ADR to understand what drives success in this market.
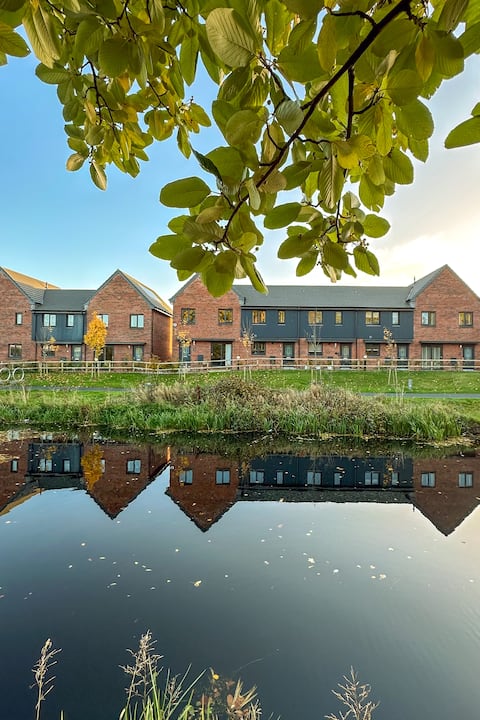
Modern 3-BDR House with River View - Near Glasgow
Entire Place • 3 bedrooms
Beautiful 3bdr house near Glasgow
Entire Place • 3 bedrooms
Clydebank Cozy 3bdr flat near Glasgow
Entire Place • 3 bedrooms
Villa in the Village
Entire Place • 2 bedrooms
*Colourful life* house near Glasgow
Entire Place • 2 bedrooms

Spacious 2-bed flat near Clydebank shopping centre
Entire Place • 2 bedrooms
Note: Performance varies based on location, size, amenities, seasonality, and management quality. Data reflects the past 12 months.
Top Performing Airbnb Hosts in Clydebank (2025)
Learn from the best! This table showcases top-performing Airbnb hosts in Clydebank based on the number of properties managed and estimated total revenue over the past year. Analyze their scale and performance metrics.
| Host Name | Properties | Grossing Revenue | Stay Reviews | Avg Rating |
|---|---|---|---|---|
| Ella | 10 | $254,381 | 162 | 4.78/5.0 |
| Maureen | 1 | $31,614 | 52 | 4.94/5.0 |
| Yuet Chun | 1 | $25,799 | 19 | 4.68/5.0 |
| Michelle | 1 | $23,223 | 75 | 4.88/5.0 |
| Stacy | 1 | $20,375 | 86 | 4.53/5.0 |
| Mihaela | 1 | $19,816 | 118 | 4.88/5.0 |
| Christopher | 1 | $19,425 | 21 | 4.43/5.0 |
| Emma | 1 | $16,611 | 20 | 4.80/5.0 |
| Younis | 1 | $1,451 | 10 | 4.90/5.0 |
Analyzing the strategies of top hosts, such as their property selection, pricing, and guest communication, can offer valuable lessons for optimizing your own Airbnb operations in Clydebank.
Dive Deeper: Advanced Clydebank STR Market Data (2025)
Ready to unlock more insights? AirROI provides access to advanced metrics and comprehensive Airbnb data for Clydebank. Explore detailed analytics beyond this report to refine your investment strategy, optimize pricing, and maximize your vacation rental profits.
Explore Advanced MetricsClydebank Short-Term Rental Market Composition (2025): Property & Room Types
Room Type Distribution
Property Type Distribution
Market Composition Insights for Clydebank
- The Clydebank Airbnb market composition is heavily skewed towards Entire Home/Apt listings, which make up 100% of the 18 active rentals. This indicates strong guest preference for privacy and space.
- Looking at the property type distribution in Clydebank, House properties are the most common (50%), reflecting the local real estate landscape.
- Houses represent a significant 50% portion, catering likely to families or larger groups.
Clydebank Airbnb Room Capacity Analysis (2025): Bedroom Distribution
Distribution of Listings by Number of Bedrooms
Room Capacity Insights for Clydebank
- The dominant room capacity in Clydebank is 2 bedrooms listings, making up 50% of the market. This suggests a strong demand for properties suitable for couples or solo travelers.
- Together, 2 bedrooms and 3 bedrooms properties represent 77.8% of the active Airbnb listings in Clydebank, indicating a high concentration in these sizes.
- A significant 33.4% of listings offer 3+ bedrooms, catering to larger groups and families seeking more space in Clydebank.
Clydebank Vacation Rental Guest Capacity Trends (2025)
Distribution of Listings by Guest Capacity
Guest Capacity Insights for Clydebank
- The most common guest capacity trend in Clydebank vacation rentals is listings accommodating 8+ guests (38.9%). This suggests the primary traveler segment is likely larger groups.
- Properties designed for 8+ guests and 6 guests dominate the Clydebank STR market, accounting for 61.1% of listings.
- 66.7% of properties accommodate 6+ guests, serving the market segment for larger families or group travel in Clydebank.
- On average, properties in Clydebank are equipped to host 5.9 guests.
Clydebank Airbnb Booking Patterns (2025): Available vs. Booked Days
Available Days Distribution
Booked Days Distribution
Booking Pattern Insights for Clydebank
- The most common availability pattern in Clydebank falls within the 181-270 days range, representing 44.4% of listings. This suggests many properties have significant open periods on their calendars.
- Approximately 77.7% of listings show high availability (181+ days open annually), indicating potential for increased bookings or specific owner usage patterns.
- For booked days, the 91-180 days range is most frequent in Clydebank (50%), reflecting common guest stay durations or potential owner blocking patterns.
- A notable 22.3% of properties secure long booking periods (181+ days booked per year), highlighting successful long-term rental strategies or significant owner usage.
Clydebank Airbnb Minimum Stay Requirements Analysis
Distribution of Listings by Minimum Night Requirement
1 Night
4 listings
22.2% of total
2 Nights
3 listings
16.7% of total
3 Nights
1 listings
5.6% of total
4-6 Nights
3 listings
16.7% of total
30+ Nights
7 listings
38.9% of total
Key Insights
- The most prevalent minimum stay requirement in Clydebank is 30+ Nights, adopted by 38.9% of listings. This highlights the market's preference for longer commitments.
- A significant segment (38.9%) caters to monthly stays (30+ nights) in Clydebank, pointing to opportunities in the extended-stay market.
Recommendations
- Align with the market by considering a 30+ Nights minimum stay, as 38.9% of Clydebank hosts use this setting.
- If feasible, allowing 1-night stays, especially midweek or during low season, could capture last-minute bookings, as only 22.2% currently do.
- Explore offering discounts for stays of 30+ nights to attract the 38.9% of the market seeking extended stays.
- Adjust minimum nights based on seasonality – potentially shorter during low season and longer during peak demand periods in Clydebank.
Clydebank Airbnb Cancellation Policy Trends Analysis (2025)
Flexible
6 listings
33.3% of total
Moderate
8 listings
44.4% of total
Firm
3 listings
16.7% of total
Strict
1 listings
5.6% of total
Cancellation Policy Insights for Clydebank
- The prevailing Airbnb cancellation policy trend in Clydebank is Moderate, used by 44.4% of listings.
- The market strongly favors guest-friendly terms, with 77.7% of listings offering Flexible or Moderate policies. This suggests guests in Clydebank may expect booking flexibility.
- Strict cancellation policies are quite rare (5.6%), potentially making listings with this policy less competitive unless justified by high demand or property type.
Recommendations for Hosts
- Consider adopting a Moderate policy to align with the 44.4% market standard in Clydebank.
- Using a Strict policy might deter some guests, as only 5.6% of listings use it. Evaluate if potential revenue protection outweighs possible lower booking rates.
- Regularly review your cancellation policy against competitors and market demand shifts in Clydebank.
Clydebank STR Booking Lead Time Analysis (2025)
Average Booking Lead Time by Month
Booking Lead Time Insights for Clydebank
- The overall average booking lead time for vacation rentals in Clydebank is 22 days.
- Guests book furthest in advance for stays during September (average 49 days), likely coinciding with peak travel demand or local events.
- The shortest booking windows occur for stays in November (average 6 days), indicating more last-minute travel plans during this time.
- Seasonally, Summer (43 days avg.) sees the longest lead times, while Winter (14 days avg.) has the shortest, reflecting typical travel planning cycles.
Recommendations for Hosts
- Use the overall average lead time (22 days) as a baseline for your pricing and availability strategy in Clydebank.
- For September stays, consider implementing length-of-stay discounts or slightly higher rates for bookings made less than 49 days out to capitalize on advance planning.
- During November, focus on last-minute booking availability and promotions, as guests book with very short notice (6 days avg.).
- Target marketing efforts for the Summer season well in advance (at least 43 days) to capture early planners.
- Monitor your own booking lead times against these Clydebank averages to identify opportunities for dynamic pricing adjustments.
Popular & Essential Airbnb Amenities in Clydebank (2025)
Amenity Prevalence
No amenities with partial availability (less than 100%) were found to display in the chart. All essential amenities might be present in all listings. Check insights below.
Amenity Insights for Clydebank
- Essential amenities in Clydebank that guests expect include: Heating, Cleaning products, Oven, Kitchen, Microwave, Refrigerator, Washer, Iron, Hot water, Wifi. Lacking these (any) could significantly impact bookings.
Recommendations for Hosts
- Ensure your listing includes all essential amenities for Clydebank: Heating, Cleaning products, Oven, Kitchen, Microwave, Refrigerator, Washer, Iron, Hot water, Wifi.
- Highlight unique or less common amenities you offer (e.g., hot tub, dedicated workspace, EV charger) in your listing description and photos.
- Regularly check competitor amenities in Clydebank to stay competitive.
Clydebank Airbnb Guest Demographics & Profile Analysis (2025)
Guest Profile Summary for Clydebank
- The typical guest profile for Airbnb in Clydebank consists of a mix of domestic (63%) and international guests, often arriving from nearby Glasgow, typically belonging to the Post-2000s (Gen Z/Alpha) group (50%), primarily speaking English or Hindi.
- Domestic travelers account for 62.6% of guests.
- Key international markets include United Kingdom (62.6%) and United States (8%).
- Top languages spoken are English (60.8%) followed by Hindi (10.8%).
- A significant demographic segment is the Post-2000s (Gen Z/Alpha) group, representing 50% of guests.
Recommendations for Hosts
- Target domestic marketing efforts towards travelers from Glasgow and Manchester.
- Tailor amenities and listing descriptions to appeal to the dominant Post-2000s (Gen Z/Alpha) demographic (e.g., highlight fast WiFi, smart home features, local guides).
- Highlight unique local experiences or amenities relevant to the primary guest profile.
- Consider seasonal promotions aligned with peak travel times for key origin markets.
Nearby Short-Term Rental Market Comparison
How does the Clydebank Airbnb market stack up against its neighbors? Compare key performance metrics like average monthly revenue, ADR, and occupancy rates in surrounding areas to understand the broader regional STR landscape.
| Market | Active Properties | Monthly Revenue | Daily Rate | Avg. Occupancy |
|---|---|---|---|---|
| Galston | 11 | $7,176 | $729.08 | 41% |
| Bridge of Cally | 16 | $6,490 | $590.54 | 47% |
| Fearnan | 22 | $5,540 | $428.59 | 48% |
| Ardlui | 10 | $5,242 | $701.50 | 25% |
| Larbert | 10 | $4,925 | $308.80 | 61% |
| Glenachulish | 32 | $4,879 | $444.07 | 42% |
| Carrick Castle | 10 | $4,579 | $619.40 | 44% |
| Gartocharn | 14 | $4,475 | $374.33 | 49% |
| Waverton | 19 | $4,450 | $525.05 | 30% |
| Acharn | 11 | $4,384 | $270.25 | 58% |