Aberdeen City Airbnb Market Analysis 2026: Short Term Rental Data & Vacation Rental Statistics in Scotland, United Kingdom
Is Airbnb profitable in Aberdeen City in 2026? Explore comprehensive Airbnb analytics for Aberdeen City, Scotland, United Kingdom to uncover income potential. This 2026 STR market report for Aberdeen City, based on AirROI data from February 2025 to January 2026, reveals key trends in the market of 530 active listings.
Whether you're considering an Airbnb investment in Aberdeen City, optimizing your existing vacation rental, or exploring rental arbitrage opportunities, understanding the Aberdeen City Airbnb data is crucial. Navigating the high regulation landscape is key to maximizing your short term rental income potential. Let's dive into the specifics.
Key Aberdeen City Airbnb Performance Metrics Overview
Monthly Airbnb Revenue Variations & Income Potential in Aberdeen City (2026)
Understanding the monthly revenue variations for Airbnb listings in Aberdeen City is key to maximizing your short term rental income potential. Seasonality significantly impacts earnings. Our analysis, based on data from the past 12 months, shows that the peak revenue month for STRs in Aberdeen City is typically July, while January often presents the lowest earnings, highlighting opportunities for strategic pricing adjustments during shoulder and low seasons. Explore the typical Airbnb income in Aberdeen City across different performance tiers:
- Best-in-class properties (Top 10%) achieve $3,630+ monthly, often utilizing dynamic pricing and superior guest experiences.
- Strong performing properties (Top 25%) earn $2,554 or more, indicating effective management and desirable locations/amenities.
- Typical properties (Median) generate around $1,541 per month, representing the average market performance.
- Entry-level properties (Bottom 25%) see earnings around $738, often with potential for optimization.
Average Monthly Airbnb Earnings Trend in Aberdeen City
Aberdeen City Airbnb Occupancy Rate Trends (2026)
Maximize your bookings by understanding the Aberdeen City STR occupancy trends. Seasonal demand shifts significantly influence how often properties are booked. Typically, Julysees the highest demand (peak season occupancy), while January experiences the lowest (low season). Effective strategies, like adjusting minimum stays or offering promotions, can boost occupancy during slower periods. Here's how different property tiers perform in Aberdeen City:
- Best-in-class properties (Top 10%) achieve 79%+ occupancy, indicating high desirability and potentially optimized availability.
- Strong performing properties (Top 25%) maintain 63% or higher occupancy, suggesting good market fit and guest satisfaction.
- Typical properties (Median) have an occupancy rate around 41%.
- Entry-level properties (Bottom 25%) average 19% occupancy, potentially facing higher vacancy.
Average Monthly Occupancy Rate Trend in Aberdeen City
Average Daily Rate (ADR) Airbnb Trends in Aberdeen City (2026)
Effective short term rental pricing strategy in Aberdeen City involves understanding monthly ADR fluctuations. The Average Daily Rate (ADR) for Airbnb in Aberdeen City typically peaks in July and dips lowest during March. Leveraging Airbnb dynamic pricing tools or strategies based on this seasonality can significantly boost revenue. Here's a look at the typical nightly rates achieved:
- Best-in-class properties (Top 10%) command rates of $246+ per night, often due to premium features or locations.
- Strong performing properties (Top 25%) achieve nightly rates of $169 or more.
- Typical properties (Median) charge around $121 per night.
- Entry-level properties (Bottom 25%) earn around $86 per night.
Average Daily Rate (ADR) Trend by Month in Aberdeen City
Get Live Aberdeen City Market Intelligence 👇

Explore Real-time Analytics
Airbnb Seasonality Analysis & Trends in Aberdeen City (2026)
Peak Season (July, August, September)
- Revenue averages $2,375 per month
- Occupancy rates average 50.3%
- Daily rates average $154
Shoulder Season
- Revenue averages $1,771 per month
- Occupancy maintains around 41.6%
- Daily rates hold near $143
Low Season (January, February, March)
- Revenue drops to average $1,375 per month
- Occupancy decreases to average 37.3%
- Daily rates adjust to average $136
Seasonality Insights for Aberdeen City
- The Airbnb seasonality in Aberdeen City shows highly seasonal trends requiring careful strategy. While the sections above show seasonal averages, it's also insightful to look at the extremes:
- During the high season, the absolute peak month showcases Aberdeen City's highest earning potential, with monthly revenues capable of climbing to $2,579, occupancy reaching a high of 51.8%, and ADRs peaking at $157.
- Conversely, the slowest single month of the year, typically falling within the low season, marks the market's lowest point. In this month, revenue might dip to $1,195, occupancy could drop to 31.1%, and ADRs may adjust down to $134.
- Understanding both the seasonal averages and these monthly peaks and troughs in revenue, occupancy, and ADR is crucial for maximizing your Airbnb profit potential in Aberdeen City.
Seasonal Strategies for Maximizing Profit
- Peak Season: Maximize revenue through premium pricing and potentially longer minimum stays. Ensure high availability.
- Low Season: Offer competitive pricing, special promotions (e.g., extended stay discounts), and flexible cancellation policies. Target off-season travelers like remote workers or budget-conscious guests.
- Shoulder Seasons: Implement dynamic pricing that balances peak and low rates. Target weekend travelers or specific events. Offer slightly more flexible terms than peak season.
- Regularly analyze your own performance against these Aberdeen City seasonality benchmarks and adjust your pricing and availability strategy accordingly.
Best Areas for Airbnb Investment in Aberdeen City (2026)
Exploring the top neighborhoods for short-term rentals in Aberdeen City? This section highlights key areas, outlining why they are attractive for hosts and guests, along with notable local attractions. Consider these locations based on your target guest profile and investment strategy.
| Neighborhood / Area | Why Host Here? (Target Guests & Appeal) | Key Attractions & Landmarks |
|---|---|---|
| City Centre | The hub of Aberdeen with its blend of historic architecture and modern amenities, making it a prime location for tourists and business travelers alike. | Aberdeen Art Gallery, Marischal College, Union Square Shopping Centre, St. Nicholas Kirk, Provost Skene's House |
| Old Town | Rich in history and culture, the Old Town offers a unique atmosphere with cobbled streets and traditional Scottish architecture, appealing to history enthusiasts. | Castlegate, The Tolbooth, St. Machar's Cathedral, The Kirk of St Nicholas, The Old Aberdeen |
| Aberdeen Harbour | A bustling area that attracts visitors interested in maritime activities and ships, offering scenic views and eateries along the waterfront. | Aberdeen Maritime Museum, The Esplanade, Fishing boats tours, Historic Harbour Walks, Sightseeing cruises |
| Aberdeenshire Coastal Region | Beautiful coastal scenery and charming villages, appealing to nature lovers and those looking for a tranquil escape. | Balmedie Beach, Cruden Bay, Slains Castle, Newburgh Seal Beach, Balmoral Castle |
| West End | A sophisticated residential area that attracts visitors looking for a quieter, upscale experience with good dining and shopping options. | The Botanical Gardens, The Union Canal, Hazlehead Park, Shopping at Queen's Road, Luxury hotels |
| Bridge of Don | A popular residential area with proximity to the beach and Aberdeen Sports Village, appealing to families and sports enthusiasts. | Donmouth Nature Reserve, Aberdeen Beach, Sports facilities, Local parks, Community events |
| Dyce | Home to Aberdeen International Airport, Dyce is perfect for business travelers and those needing nearby accommodation before flights. | Airport facilities, Dyce's local shops, Nature walks around River Don, Historic sites nearby, Convenience to transport links |
| Kincorth | A suburban area with amazing views over the city and a peaceful atmosphere, making it suitable for longer stays in a residential setting. | Kincorth Hill, Local parks, The River Dee, Wildlife watching, Family-friendly amenities |
Understanding Airbnb License Requirements & STR Laws in Aberdeen City (2026)
Yes, Aberdeen City, Scotland, United Kingdom enforces high STR regulations. Obtaining a license and ensuring compliance is almost certainly required according to current 2026 STR laws. Always verify the latest short term rental regulations and Airbnb license requirements directly with local government authorities for Aberdeen City to ensure full compliance before hosting.
(Source: AirROI data, 2026, based on 34% licensed listings)
Top Performing Airbnb Properties in Aberdeen City (2026)
Benchmark your potential! Explore examples of top-performing Airbnb properties in Aberdeen Citybased on Trailing Twelve Month (TTM) revenue. Analyze their characteristics, revenue, occupancy rate, and ADR to understand what drives success in this market.

Fountainhall Townhouse, Aberdeen
Entire Place • 3 bedrooms

Old Aberdeen Townhouse
Entire Place • 4 bedrooms

Deeside Brae Villa | Grampian Lettings
Entire Place • 4 bedrooms

Bimini
Entire Place • 9 bedrooms

Constancevilla B7 | Grampian Lettings Ltd
Entire Place • 7 bedrooms
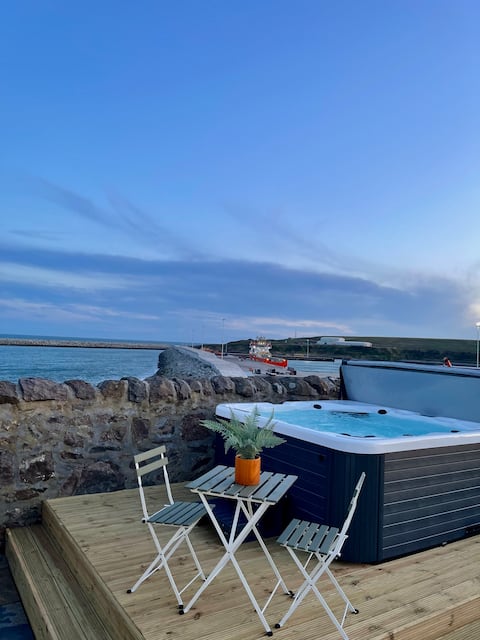
Lighthouse Cottage With Hottub
Entire Place • 1 bedroom
Note: Performance varies based on location, size, amenities, seasonality, and management quality. Data reflects the past 12 months.
Top Performing Airbnb Hosts in Aberdeen City (2026)
Learn from the best! This table showcases top-performing Airbnb hosts in Aberdeen City based on the number of properties managed and estimated total revenue over the past year. Analyze their scale and performance metrics.
| Host Name | Properties | Grossing Revenue | Stay Reviews | Avg Rating |
|---|---|---|---|---|
| Grampian Lettings | 34 | $816,448 | 573 | 4.73/5.0 |
| Mitchell | 24 | $521,106 | 751 | 4.71/5.0 |
| Craig | 14 | $356,805 | 809 | 4.61/5.0 |
| Jason | 5 | $167,825 | 203 | 4.90/5.0 |
| Holiday Homes | 10 | $165,122 | 171 | 4.34/5.0 |
| Stephen | 7 | $132,497 | 226 | 4.78/5.0 |
| Wannisa | 9 | $130,745 | 202 | 4.44/5.0 |
| Thistle Letting | 3 | $123,573 | 174 | 4.59/5.0 |
| Sean | 4 | $117,186 | 529 | 4.88/5.0 |
| Peter | 3 | $114,881 | 639 | 4.98/5.0 |
Analyzing the strategies of top hosts, such as their property selection, pricing, and guest communication, can offer valuable lessons for optimizing your own Airbnb operations in Aberdeen City.
Dive Deeper: Advanced Aberdeen City STR Market Data (2026)
Ready to unlock more insights? AirROI provides access to advanced metrics and comprehensive Airbnb data for Aberdeen City. Explore detailed analytics beyond this report to refine your investment strategy, optimize pricing, and maximize your vacation rental profits.
Explore Advanced MetricsAberdeen City Short-Term Rental Market Composition (2026): Property & Room Types
Room Type Distribution
Property Type Distribution
Market Composition Insights for Aberdeen City
- The Aberdeen City Airbnb market composition is heavily skewed towards Entire Home/Apt listings, which make up 81.3% of the 530 active rentals. This indicates strong guest preference for privacy and space.
- Looking at the property type distribution in Aberdeen City, Apartment/Condo properties are the most common (74.7%), reflecting the local real estate landscape.
- Houses represent a significant 16.6% portion, catering likely to families or larger groups.
- The presence of 7.2% Hotel/Boutique listings indicates integration with traditional hospitality.
- Smaller segments like unique stays, others (combined 1.6%) offer potential for unique stay experiences.
Aberdeen City Airbnb Room Capacity Analysis (2026): Bedroom Distribution
Distribution of Listings by Number of Bedrooms
Room Capacity Insights for Aberdeen City
- The dominant room capacity in Aberdeen City is 2 bedrooms listings, making up 37.9% of the market. This suggests a strong demand for properties suitable for couples or solo travelers.
- Together, 2 bedrooms and 1 bedroom properties represent 70.0% of the active Airbnb listings in Aberdeen City, indicating a high concentration in these sizes.
Aberdeen City Vacation Rental Guest Capacity Trends (2026)
Distribution of Listings by Guest Capacity
Guest Capacity Insights for Aberdeen City
- The most common guest capacity trend in Aberdeen City vacation rentals is listings accommodating 4 guests (36.6%). This suggests the primary traveler segment is likely small families or groups.
- Properties designed for 4 guests and 2 guests dominate the Aberdeen City STR market, accounting for 63.4% of listings.
- 10.8% of properties accommodate 6+ guests, serving the market segment for larger families or group travel in Aberdeen City.
- On average, properties in Aberdeen City are equipped to host 3.1 guests.
Aberdeen City Airbnb Booking Patterns (2026): Available vs. Booked Days
Available Days Distribution
Booked Days Distribution
Booking Pattern Insights for Aberdeen City
- The most common availability pattern in Aberdeen City falls within the 271-366 days range, representing 42.3% of listings. This suggests many properties have significant open periods on their calendars.
- Approximately 76.3% of listings show high availability (181+ days open annually), indicating potential for increased bookings or specific owner usage patterns.
- For booked days, the 91-180 days range is most frequent in Aberdeen City (33.4%), reflecting common guest stay durations or potential owner blocking patterns.
- A notable 25.1% of properties secure long booking periods (181+ days booked per year), highlighting successful long-term rental strategies or significant owner usage.
Aberdeen City Airbnb Minimum Stay Requirements Analysis
Distribution of Listings by Minimum Night Requirement
1 Night
100 listings
18.9% of total
2 Nights
113 listings
21.3% of total
3 Nights
48 listings
9.1% of total
4-6 Nights
53 listings
10% of total
7-29 Nights
23 listings
4.3% of total
30+ Nights
193 listings
36.4% of total
Key Insights
- The most prevalent minimum stay requirement in Aberdeen City is 30+ Nights, adopted by 36.4% of listings. This highlights the market's preference for longer commitments.
- A significant segment (36.4%) caters to monthly stays (30+ nights) in Aberdeen City, pointing to opportunities in the extended-stay market.
Recommendations
- Align with the market by considering a 30+ Nights minimum stay, as 36.4% of Aberdeen City hosts use this setting.
- If feasible, allowing 1-night stays, especially midweek or during low season, could capture last-minute bookings, as only 18.9% currently do.
- Explore offering discounts for stays of 30+ nights to attract the 36.4% of the market seeking extended stays.
- Adjust minimum nights based on seasonality – potentially shorter during low season and longer during peak demand periods in Aberdeen City.
Aberdeen City Airbnb Cancellation Policy Trends Analysis (2026)
Limited
5 listings
0.9% of total
Super Strict 30 Days
1 listings
0.2% of total
Super Strict 60 Days
12 listings
2.3% of total
Non-refundable
5 listings
0.9% of total
Flexible
147 listings
27.8% of total
Moderate
135 listings
25.5% of total
Firm
170 listings
32.1% of total
Strict
54 listings
10.2% of total
Cancellation Policy Insights for Aberdeen City
- The prevailing Airbnb cancellation policy trend in Aberdeen City is Firm, used by 32.1% of listings.
- There's a relatively balanced mix between guest-friendly (53.3%) and stricter (42.3%) policies, offering choices for different guest needs.
Recommendations for Hosts
- Consider adopting a Firm policy to align with the 32.1% market standard in Aberdeen City.
- Using a Strict policy might deter some guests, as only 10.2% of listings use it. Evaluate if potential revenue protection outweighs possible lower booking rates.
- Regularly review your cancellation policy against competitors and market demand shifts in Aberdeen City.
Aberdeen City STR Booking Lead Time Analysis (2026)
Average Booking Lead Time by Month
Booking Lead Time Insights for Aberdeen City
- The overall average booking lead time for vacation rentals in Aberdeen City is 44 days.
- Guests book furthest in advance for stays during July (average 62 days), likely coinciding with peak travel demand or local events.
- The shortest booking windows occur for stays in February (average 22 days), indicating more last-minute travel plans during this time.
- Seasonally, Summer (56 days avg.) sees the longest lead times, while Winter (36 days avg.) has the shortest, reflecting typical travel planning cycles.
Recommendations for Hosts
- Use the overall average lead time (44 days) as a baseline for your pricing and availability strategy in Aberdeen City.
- For July stays, consider implementing length-of-stay discounts or slightly higher rates for bookings made less than 62 days out to capitalize on advance planning.
- Target marketing efforts for the Summer season well in advance (at least 56 days) to capture early planners.
- Monitor your own booking lead times against these Aberdeen City averages to identify opportunities for dynamic pricing adjustments.
Popular & Essential Airbnb Amenities in Aberdeen City (2026)
Amenity Prevalence
Amenity Insights for Aberdeen City
- Essential amenities in Aberdeen City that guests expect include: Wifi, Smoke alarm. Lacking these (any) could significantly impact bookings.
- Popular amenities like Heating, Kitchen, TV are common but not universal. Offering these can provide a competitive edge.
Recommendations for Hosts
- Ensure your listing includes all essential amenities for Aberdeen City: Wifi, Smoke alarm.
- Prioritize adding missing essentials: Wifi, Smoke alarm.
- Consider adding popular differentiators like Heating or Kitchen to increase appeal.
- Highlight unique or less common amenities you offer (e.g., hot tub, dedicated workspace, EV charger) in your listing description and photos.
- Regularly check competitor amenities in Aberdeen City to stay competitive.
Aberdeen City Airbnb Guest Demographics & Profile Analysis (2026)
Guest Profile Summary for Aberdeen City
- The typical guest profile for Airbnb in Aberdeen City consists of a mix of domestic (57%) and international guests, often arriving from nearby Scotland, typically belonging to the Post-2000s (Gen Z/Alpha) group (50%), primarily speaking English or French.
- Domestic travelers account for 57.4% of guests.
- Key international markets include United Kingdom (57.4%) and United States (13.3%).
- Top languages spoken are English (57.3%) followed by French (8%).
- A significant demographic segment is the Post-2000s (Gen Z/Alpha) group, representing 50% of guests.
Recommendations for Hosts
- Balance marketing efforts between domestic and international channels based on the guest mix.
- Tailor amenities and listing descriptions to appeal to the dominant Post-2000s (Gen Z/Alpha) demographic (e.g., highlight fast WiFi, smart home features, local guides).
- Highlight unique local experiences or amenities relevant to the primary guest profile.
- Consider seasonal promotions aligned with peak travel times for key origin markets.
Nearby Short-Term Rental Market Comparison
How does the Aberdeen City Airbnb market stack up against its neighbors? Compare key performance metrics like average monthly revenue, ADR, and occupancy rates in surrounding areas to understand the broader regional STR landscape.
| Market | Active Properties | Monthly Revenue | Daily Rate | Avg. Occupancy |
|---|---|---|---|---|
| Bridge of Cally | 18 | $6,245 | $629.64 | 46% |
| Larbert | 10 | $5,686 | $322.43 | 56% |
| Insh | 13 | $4,828 | $293.70 | 60% |
| Leuchars | 14 | $4,242 | $440.14 | 40% |
| Dallas | 11 | $4,098 | $335.69 | 42% |
| Dulnain Bridge | 15 | $4,004 | $361.87 | 46% |
| Gullane | 27 | $3,857 | $334.69 | 53% |
| St Andrews | 364 | $3,785 | $392.55 | 47% |
| Banchory | 18 | $3,753 | $282.89 | 51% |
| Nethy Bridge | 52 | $3,653 | $255.89 | 51% |