Madeley Airbnb Market Analysis 2025: Short Term Rental Data & Vacation Rental Statistics in England, United Kingdom
Is Airbnb profitable in Madeley in 2025? Explore comprehensive Airbnb analytics for Madeley, England, United Kingdom to uncover income potential. This 2025 STR market report for Madeley, based on AirROI data from June 2024 to May 2025, reveals key trends in the niche market of 18 active listings.
Whether you're considering an Airbnb investment in Madeley, optimizing your existing vacation rental, or exploring rental arbitrage opportunities, understanding the Madeley Airbnb data is crucial. Leveraging the low regulation environment is key to maximizing your short term rental income potential. Let's dive into the specifics.
Key Madeley Airbnb Performance Metrics Overview
Monthly Airbnb Revenue Variations & Income Potential in Madeley (2025)
Understanding the monthly revenue variations for Airbnb listings in Madeley is key to maximizing your short term rental income potential. Seasonality significantly impacts earnings. Our analysis, based on data from the past 12 months, shows that the peak revenue month for STRs in Madeley is typically August, while November often presents the lowest earnings, highlighting opportunities for strategic pricing adjustments during shoulder and low seasons. Explore the typical Airbnb income in Madeley across different performance tiers:
- Best-in-class properties (Top 10%) achieve $2,793+ monthly, often utilizing dynamic pricing and superior guest experiences.
- Strong performing properties (Top 25%) earn $2,205 or more, indicating effective management and desirable locations/amenities.
- Typical properties (Median) generate around $1,471 per month, representing the average market performance.
- Entry-level properties (Bottom 25%) see earnings around $602, often with potential for optimization.
Average Monthly Airbnb Earnings Trend in Madeley
Madeley Airbnb Occupancy Rate Trends (2025)
Maximize your bookings by understanding the Madeley STR occupancy trends. Seasonal demand shifts significantly influence how often properties are booked. Typically, Augustsees the highest demand (peak season occupancy), while November experiences the lowest (low season). Effective strategies, like adjusting minimum stays or offering promotions, can boost occupancy during slower periods. Here's how different property tiers perform in Madeley:
- Best-in-class properties (Top 10%) achieve 76%+ occupancy, indicating high desirability and potentially optimized availability.
- Strong performing properties (Top 25%) maintain 66% or higher occupancy, suggesting good market fit and guest satisfaction.
- Typical properties (Median) have an occupancy rate around 50%.
- Entry-level properties (Bottom 25%) average 29% occupancy, potentially facing higher vacancy.
Average Monthly Occupancy Rate Trend in Madeley
Average Daily Rate (ADR) Airbnb Trends in Madeley (2025)
Effective short term rental pricing strategy in Madeley involves understanding monthly ADR fluctuations. The Average Daily Rate (ADR) for Airbnb in Madeley typically peaks in May and dips lowest during December. Leveraging Airbnb dynamic pricing tools or strategies based on this seasonality can significantly boost revenue. Here's a look at the typical nightly rates achieved:
- Best-in-class properties (Top 10%) command rates of $164+ per night, often due to premium features or locations.
- Strong performing properties (Top 25%) achieve nightly rates of $126 or more.
- Typical properties (Median) charge around $107 per night.
- Entry-level properties (Bottom 25%) earn around $58 per night.
Average Daily Rate (ADR) Trend by Month in Madeley
Get Live Madeley Market Intelligence 👇

Explore Real-time Analytics
Airbnb Seasonality Analysis & Trends in Madeley (2025)
Peak Season (August, April, May)
- Revenue averages $2,225 per month
- Occupancy rates average 57.0%
- Daily rates average $118
Shoulder Season
- Revenue averages $1,720 per month
- Occupancy maintains around 52.3%
- Daily rates hold near $99
Low Season (January, November, December)
- Revenue drops to average $1,156 per month
- Occupancy decreases to average 33.8%
- Daily rates adjust to average $97
Seasonality Insights for Madeley
- The Airbnb seasonality in Madeley shows highly seasonal trends requiring careful strategy. While the sections above show seasonal averages, it's also insightful to look at the extremes:
- During the high season, the absolute peak month showcases Madeley's highest earning potential, with monthly revenues capable of climbing to $2,499, occupancy reaching a high of 74.8%, and ADRs peaking at $138.
- Conversely, the slowest single month of the year, typically falling within the low season, marks the market's lowest point. In this month, revenue might dip to $1,067, occupancy could drop to 31.4%, and ADRs may adjust down to $89.
- Understanding both the seasonal averages and these monthly peaks and troughs in revenue, occupancy, and ADR is crucial for maximizing your Airbnb profit potential in Madeley.
Seasonal Strategies for Maximizing Profit
- Peak Season: Maximize revenue through premium pricing and potentially longer minimum stays. Ensure high availability.
- Low Season: Offer competitive pricing, special promotions (e.g., extended stay discounts), and flexible cancellation policies. Target off-season travelers like remote workers or budget-conscious guests.
- Shoulder Seasons: Implement dynamic pricing that balances peak and low rates. Target weekend travelers or specific events. Offer slightly more flexible terms than peak season.
- Regularly analyze your own performance against these Madeley seasonality benchmarks and adjust your pricing and availability strategy accordingly.
Best Areas for Airbnb Investment in Madeley (2025)
Exploring the top neighborhoods for short-term rentals in Madeley? This section highlights key areas, outlining why they are attractive for hosts and guests, along with notable local attractions. Consider these locations based on your target guest profile and investment strategy.
| Neighborhood / Area | Why Host Here? (Target Guests & Appeal) | Key Attractions & Landmarks |
|---|---|---|
| Moseley | A vibrant suburb with a strong community feel, known for its historic architecture and popular cafes. Moseley attracts young professionals and families, making it ideal for Airbnb hosting. | Moseley Village, Moseley Park and Pool, The Mug House, The Church Inn, Birmingham Botanical Gardens |
| Knowle | A charming village with picturesque landscapes and excellent shops and restaurants. Its appeal to visitors seeking a quieter stay makes it a great investment area. | Knowle Locks, Knowle Village Centre, Dorridge Park, Baddesley Clinton, The Knowle Tavern |
| Kings Heath | A trendy suburb with a bohemian vibe and a mix of independent shops and eateries. It attracts a mix of tourists looking for local experiences and urban culture. | Kings Heath Park, High Street Shops, The Hare and Hounds, Dudley Road Cemetery, Kings Heath Farmers Market |
| Bournville | Famous for its chocolate factory and beautiful garden village, Bournville attracts visitors interested in the Cadbury heritage as well as green spaces. | Cadbury World, Bournville Village Green, Rowheath Pavilion, Bournville Park, The Chocolate Quarter |
| Halesowen | A historic town with a rich heritage and proximity to the countryside, appealing to visitors who enjoy both cultural experiences and outdoor activities. | Halesowen Abbey, Leasowes Park, Clent Hills, Halesowen Town Centre, Catherine de Braganza |
| Selly Oak | A hub for students and young professionals due to its proximity to the University of Birmingham, making it an attractive spot for short-term rentals. | University of Birmingham, Chad Square, The Selly Oak Centre, Selly Oak Park, Bournbrook |
| Edgbaston | Known for its affluent residential areas, Edgbaston is popular with visitors seeking a more upscale experience, especially with its proximity to the city center. | Edgbaston Reservoir, The Priory, Birmingham Golf Club, Cannon Hill Park, The mac Birmingham |
| Harborne | A lively suburb with a vibrant food scene and local shops, Harborne is attractive to both tourists and locals looking for a comfortable stay with amenities. | Harborne High Street, Queen's Park, The Botanical Gardens, Harborne Pool and Fitness Centre, The Plough |
Understanding Airbnb License Requirements & STR Laws in Madeley (2025)
While Madeley, England, United Kingdom currently shows low STR regulations, specific Airbnb license requirements might still exist or change. Always verify the latest short term rental regulations and Airbnb license requirements directly with local government authorities for Madeley to ensure full compliance before hosting.
(Source: AirROI data, 2025, finding no licensed listings among those analyzed)
Top Performing Airbnb Properties in Madeley (2025)
Benchmark your potential! Explore examples of top-performing Airbnb properties in Madeleybased on Trailing Twelve Month (TTM) revenue. Analyze their characteristics, revenue, occupancy rate, and ADR to understand what drives success in this market.
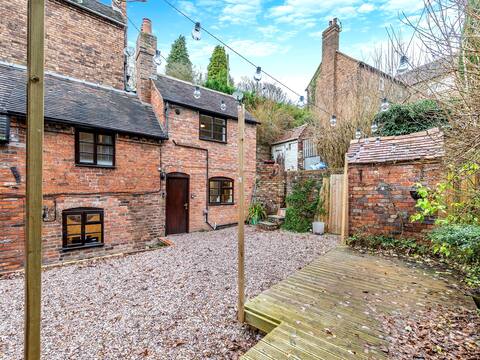
The Wild Cherry Tree Retreat
Entire Place • 3 bedrooms
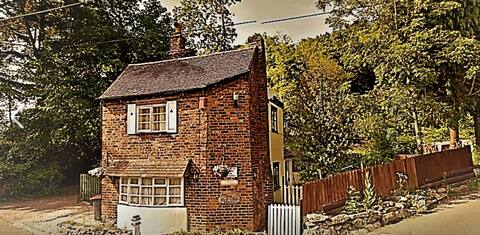
The Old Toll House - Ironbridge Gorge ⭐️⭐️⭐️⭐️
Entire Place • 2 bedrooms
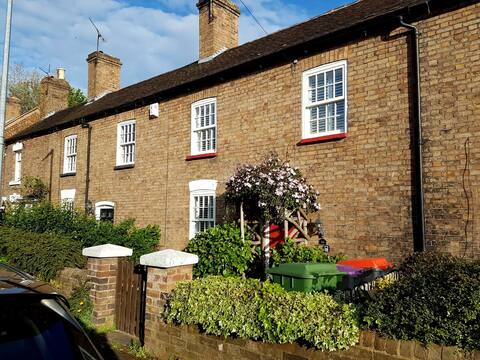
Cozy Cottage Madeley for Ironbridge and Telford
Entire Place • 2 bedrooms

Off Grid Yurt nestled in the Ironbridge Gorge.
Entire Place • 1 bedroom

Cosy Modern Annex nestled in the Ironbridge Gorge
Entire Place • 1 bedroom

Madeley Guesthouse Near Historic Ironbridge
Entire Place • 1 bedroom
Note: Performance varies based on location, size, amenities, seasonality, and management quality. Data reflects the past 12 months.
Top Performing Airbnb Hosts in Madeley (2025)
Learn from the best! This table showcases top-performing Airbnb hosts in Madeley based on the number of properties managed and estimated total revenue over the past year. Analyze their scale and performance metrics.
| Host Name | Properties | Grossing Revenue | Stay Reviews | Avg Rating |
|---|---|---|---|---|
| Cottages | 1 | $60,017 | 17 | 4.53/5.0 |
| Emma | 2 | $44,385 | 765 | 4.93/5.0 |
| Freddie | 1 | $28,150 | 154 | 4.69/5.0 |
| Jacob | 1 | $23,125 | 128 | 4.94/5.0 |
| Deborah | 1 | $16,872 | 284 | 4.99/5.0 |
| Steven-Pass The Keys | 4 | $14,172 | 52 | 4.64/5.0 |
| Jo | 1 | $11,772 | 152 | 4.82/5.0 |
| Hudson Property Group | 1 | $8,082 | 9 | 4.44/5.0 |
| Tosin | 2 | $6,911 | 36 | 4.85/5.0 |
| Host #254311151 | 1 | $4,708 | 38 | 4.87/5.0 |
Analyzing the strategies of top hosts, such as their property selection, pricing, and guest communication, can offer valuable lessons for optimizing your own Airbnb operations in Madeley.
Dive Deeper: Advanced Madeley STR Market Data (2025)
Ready to unlock more insights? AirROI provides access to advanced metrics and comprehensive Airbnb data for Madeley. Explore detailed analytics beyond this report to refine your investment strategy, optimize pricing, and maximize your vacation rental profits.
Explore Advanced MetricsMadeley Short-Term Rental Market Composition (2025): Property & Room Types
Room Type Distribution
Property Type Distribution
Market Composition Insights for Madeley
- The Madeley Airbnb market composition is heavily skewed towards Entire Home/Apt listings, which make up 77.8% of the 18 active rentals. This indicates strong guest preference for privacy and space.
- Looking at the property type distribution in Madeley, House properties are the most common (55.6%), reflecting the local real estate landscape.
- Houses represent a significant 55.6% portion, catering likely to families or larger groups.
- The presence of 5.6% Hotel/Boutique listings indicates integration with traditional hospitality.
Madeley Airbnb Room Capacity Analysis (2025): Bedroom Distribution
Distribution of Listings by Number of Bedrooms
Room Capacity Insights for Madeley
- The dominant room capacity in Madeley is 1 bedroom listings, making up 44.4% of the market. This suggests a strong demand for properties suitable for couples or solo travelers.
- Together, 1 bedroom and 2 bedrooms properties represent 77.7% of the active Airbnb listings in Madeley, indicating a high concentration in these sizes.
- Listings with 3+ bedrooms (5.6%) represent a smaller niche, potentially indicating an underserved market for larger group accommodations in Madeley.
Madeley Vacation Rental Guest Capacity Trends (2025)
Distribution of Listings by Guest Capacity
Guest Capacity Insights for Madeley
- The most common guest capacity trend in Madeley vacation rentals is listings accommodating 4 guests (38.9%). This suggests the primary traveler segment is likely small families or groups.
- Properties designed for 4 guests and 2 guests dominate the Madeley STR market, accounting for 55.6% of listings.
- On average, properties in Madeley are equipped to host 3.1 guests.
Madeley Airbnb Booking Patterns (2025): Available vs. Booked Days
Available Days Distribution
Booked Days Distribution
Booking Pattern Insights for Madeley
- The most common availability pattern in Madeley falls within the 271-366 days range, representing 55.6% of listings. This suggests many properties have significant open periods on their calendars.
- Approximately 72.3% of listings show high availability (181+ days open annually), indicating potential for increased bookings or specific owner usage patterns.
- For booked days, the 31-90 days range is most frequent in Madeley (33.3%), reflecting common guest stay durations or potential owner blocking patterns.
- A notable 27.8% of properties secure long booking periods (181+ days booked per year), highlighting successful long-term rental strategies or significant owner usage.
Madeley Airbnb Minimum Stay Requirements Analysis
Distribution of Listings by Minimum Night Requirement
1 Night
2 listings
11.8% of total
2 Nights
8 listings
47.1% of total
7-29 Nights
1 listings
5.9% of total
30+ Nights
6 listings
35.3% of total
Key Insights
- The most prevalent minimum stay requirement in Madeley is 2 Nights, adopted by 47.1% of listings. This highlights the market's preference for shorter, flexible bookings.
- A significant segment (35.3%) caters to monthly stays (30+ nights) in Madeley, pointing to opportunities in the extended-stay market.
Recommendations
- Align with the market by considering a 2 Nights minimum stay, as 47.1% of Madeley hosts use this setting.
- If feasible, allowing 1-night stays, especially midweek or during low season, could capture last-minute bookings, as only 11.8% currently do.
- A 2-night minimum appears standard (47.1%). Consider this for weekends or peak periods.
- Explore offering discounts for stays of 30+ nights to attract the 35.3% of the market seeking extended stays.
- Adjust minimum nights based on seasonality – potentially shorter during low season and longer during peak demand periods in Madeley.
Madeley Airbnb Cancellation Policy Trends Analysis (2025)
Super Strict 60 Days
1 listings
6.7% of total
Flexible
9 listings
60% of total
Moderate
2 listings
13.3% of total
Firm
3 listings
20% of total
Cancellation Policy Insights for Madeley
- The prevailing Airbnb cancellation policy trend in Madeley is Flexible, used by 60% of listings.
- The market strongly favors guest-friendly terms, with 73.3% of listings offering Flexible or Moderate policies. This suggests guests in Madeley may expect booking flexibility.
Recommendations for Hosts
- Consider adopting a Flexible policy to align with the 60% market standard in Madeley.
- Given the high prevalence of Flexible policies (60%), offering this can enhance booking appeal, especially during shoulder seasons.
- Regularly review your cancellation policy against competitors and market demand shifts in Madeley.
Madeley STR Booking Lead Time Analysis (2025)
Average Booking Lead Time by Month
Booking Lead Time Insights for Madeley
- The overall average booking lead time for vacation rentals in Madeley is 34 days.
- Guests book furthest in advance for stays during August (average 73 days), likely coinciding with peak travel demand or local events.
- The shortest booking windows occur for stays in January (average 17 days), indicating more last-minute travel plans during this time.
- Seasonally, Summer (63 days avg.) sees the longest lead times, while Winter (26 days avg.) has the shortest, reflecting typical travel planning cycles.
Recommendations for Hosts
- Use the overall average lead time (34 days) as a baseline for your pricing and availability strategy in Madeley.
- For August stays, consider implementing length-of-stay discounts or slightly higher rates for bookings made less than 73 days out to capitalize on advance planning.
- Target marketing efforts for the Summer season well in advance (at least 63 days) to capture early planners.
- Monitor your own booking lead times against these Madeley averages to identify opportunities for dynamic pricing adjustments.
Popular & Essential Airbnb Amenities in Madeley (2025)
Amenity Prevalence
Amenity Insights for Madeley
- Essential amenities in Madeley that guests expect include: Smoke alarm, Heating. Lacking these (any) could significantly impact bookings.
- Popular amenities like Kitchen, Hangers, Dishes and silverware are common but not universal. Offering these can provide a competitive edge.
- Warning: Wifi is not universally provided but is considered essential globally. Ensure reliable Wifi is offered.
Recommendations for Hosts
- Ensure your listing includes all essential amenities for Madeley: Smoke alarm, Heating.
- Consider adding popular differentiators like Kitchen or Hangers to increase appeal.
- Highlight unique or less common amenities you offer (e.g., hot tub, dedicated workspace, EV charger) in your listing description and photos.
- Regularly check competitor amenities in Madeley to stay competitive.
Madeley Airbnb Guest Demographics & Profile Analysis (2025)
Guest Profile Summary for Madeley
- The typical guest profile for Airbnb in Madeley consists of primarily domestic travelers (94%), often arriving from nearby England, typically belonging to the Post-2000s (Gen Z/Alpha) group (50%), primarily speaking English or French.
- Domestic travelers account for 93.8% of guests.
- Key international markets include United Kingdom (93.8%) and United States (1.1%).
- Top languages spoken are English (70.2%) followed by French (6%).
- A significant demographic segment is the Post-2000s (Gen Z/Alpha) group, representing 50% of guests.
Recommendations for Hosts
- Target domestic marketing efforts towards travelers from England and London.
- Tailor amenities and listing descriptions to appeal to the dominant Post-2000s (Gen Z/Alpha) demographic (e.g., highlight fast WiFi, smart home features, local guides).
- Highlight unique local experiences or amenities relevant to the primary guest profile.
- Consider seasonal promotions aligned with peak travel times for key origin markets.
Nearby Short-Term Rental Market Comparison
How does the Madeley Airbnb market stack up against its neighbors? Compare key performance metrics like average monthly revenue, ADR, and occupancy rates in surrounding areas to understand the broader regional STR landscape.
| Market | Active Properties | Monthly Revenue | Daily Rate | Avg. Occupancy |
|---|---|---|---|---|
| Englishcombe | 15 | $6,685 | $523.51 | 50% |
| Chew Magna | 16 | $6,360 | $413.61 | 44% |
| Long Sutton | 17 | $5,964 | $404.64 | 44% |
| Lambourn | 12 | $5,662 | $643.69 | 28% |
| Chirbury | 14 | $5,230 | $735.87 | 45% |
| Ashley | 12 | $5,214 | $355.94 | 52% |
| Woolhope | 11 | $4,986 | $592.14 | 29% |
| Dinton | 11 | $4,616 | $250.27 | 58% |
| Oldland Common | 13 | $4,517 | $372.05 | 41% |
| Binegar | 10 | $4,514 | $267.41 | 58% |