Little Wenlock Airbnb Market Analysis 2025: Short Term Rental Data & Vacation Rental Statistics in England, United Kingdom
Is Airbnb profitable in Little Wenlock in 2025? Explore comprehensive Airbnb analytics for Little Wenlock, England, United Kingdom to uncover income potential. This 2025 STR market report for Little Wenlock, based on AirROI data from June 2024 to May 2025, reveals key trends in the niche market of 22 active listings.
Whether you're considering an Airbnb investment in Little Wenlock, optimizing your existing vacation rental, or exploring rental arbitrage opportunities, understanding the Little Wenlock Airbnb data is crucial. Understanding the local regulations is key to maximizing your short term rental income potential. Let's dive into the specifics.
Key Little Wenlock Airbnb Performance Metrics Overview
Monthly Airbnb Revenue Variations & Income Potential in Little Wenlock (2025)
Understanding the monthly revenue variations for Airbnb listings in Little Wenlock is key to maximizing your short term rental income potential. Seasonality significantly impacts earnings. Our analysis, based on data from the past 12 months, shows that the peak revenue month for STRs in Little Wenlock is typically March, while November often presents the lowest earnings, highlighting opportunities for strategic pricing adjustments during shoulder and low seasons. Explore the typical Airbnb income in Little Wenlock across different performance tiers:
- Best-in-class properties (Top 10%) achieve $4,455+ monthly, often utilizing dynamic pricing and superior guest experiences.
- Strong performing properties (Top 25%) earn $2,576 or more, indicating effective management and desirable locations/amenities.
- Typical properties (Median) generate around $1,697 per month, representing the average market performance.
- Entry-level properties (Bottom 25%) see earnings around $983, often with potential for optimization.
Average Monthly Airbnb Earnings Trend in Little Wenlock
Little Wenlock Airbnb Occupancy Rate Trends (2025)
Maximize your bookings by understanding the Little Wenlock STR occupancy trends. Seasonal demand shifts significantly influence how often properties are booked. Typically, Aprilsees the highest demand (peak season occupancy), while November experiences the lowest (low season). Effective strategies, like adjusting minimum stays or offering promotions, can boost occupancy during slower periods. Here's how different property tiers perform in Little Wenlock:
- Best-in-class properties (Top 10%) achieve 76%+ occupancy, indicating high desirability and potentially optimized availability.
- Strong performing properties (Top 25%) maintain 53% or higher occupancy, suggesting good market fit and guest satisfaction.
- Typical properties (Median) have an occupancy rate around 31%.
- Entry-level properties (Bottom 25%) average 19% occupancy, potentially facing higher vacancy.
Average Monthly Occupancy Rate Trend in Little Wenlock
Average Daily Rate (ADR) Airbnb Trends in Little Wenlock (2025)
Effective short term rental pricing strategy in Little Wenlock involves understanding monthly ADR fluctuations. The Average Daily Rate (ADR) for Airbnb in Little Wenlock typically peaks in May and dips lowest during November. Leveraging Airbnb dynamic pricing tools or strategies based on this seasonality can significantly boost revenue. Here's a look at the typical nightly rates achieved:
- Best-in-class properties (Top 10%) command rates of $293+ per night, often due to premium features or locations.
- Strong performing properties (Top 25%) achieve nightly rates of $250 or more.
- Typical properties (Median) charge around $191 per night.
- Entry-level properties (Bottom 25%) earn around $159 per night.
Average Daily Rate (ADR) Trend by Month in Little Wenlock
Get Live Little Wenlock Market Intelligence 👇

Explore Real-time Analytics
Airbnb Seasonality Analysis & Trends in Little Wenlock (2025)
Peak Season (March, April, July)
- Revenue averages $2,778 per month
- Occupancy rates average 45.8%
- Daily rates average $206
Shoulder Season
- Revenue averages $2,097 per month
- Occupancy maintains around 36.8%
- Daily rates hold near $210
Low Season (June, August, November)
- Revenue drops to average $1,242 per month
- Occupancy decreases to average 29.8%
- Daily rates adjust to average $186
Seasonality Insights for Little Wenlock
- The Airbnb seasonality in Little Wenlock shows highly seasonal trends requiring careful strategy. While the sections above show seasonal averages, it's also insightful to look at the extremes:
- During the high season, the absolute peak month showcases Little Wenlock's highest earning potential, with monthly revenues capable of climbing to $2,976, occupancy reaching a high of 47.5%, and ADRs peaking at $286.
- Conversely, the slowest single month of the year, typically falling within the low season, marks the market's lowest point. In this month, revenue might dip to $952, occupancy could drop to 19.5%, and ADRs may adjust down to $176.
- Understanding both the seasonal averages and these monthly peaks and troughs in revenue, occupancy, and ADR is crucial for maximizing your Airbnb profit potential in Little Wenlock.
Seasonal Strategies for Maximizing Profit
- Peak Season: Maximize revenue through premium pricing and potentially longer minimum stays. Ensure high availability.
- Low Season: Offer competitive pricing, special promotions (e.g., extended stay discounts), and flexible cancellation policies. Target off-season travelers like remote workers or budget-conscious guests.
- Shoulder Seasons: Implement dynamic pricing that balances peak and low rates. Target weekend travelers or specific events. Offer slightly more flexible terms than peak season.
- Regularly analyze your own performance against these Little Wenlock seasonality benchmarks and adjust your pricing and availability strategy accordingly.
Best Areas for Airbnb Investment in Little Wenlock (2025)
Exploring the top neighborhoods for short-term rentals in Little Wenlock? This section highlights key areas, outlining why they are attractive for hosts and guests, along with notable local attractions. Consider these locations based on your target guest profile and investment strategy.
| Neighborhood / Area | Why Host Here? (Target Guests & Appeal) | Key Attractions & Landmarks |
|---|---|---|
| Ironbridge | A UNESCO World Heritage Site, famous for its iconic iron bridge and historical significance in the Industrial Revolution. A top destination for tourists interested in history and engineering. | Iron Bridge, Blists Hill Victorian Town, Coalport China Museum, Ironbridge Gorge Museum Trust, The Tar Tunnel, The Old Furnace |
| Madeley | A charming village with scenic countryside and close proximity to the Ironbridge Gorge, appealing to those who enjoy a quieter, rural experience while being able to visit cultural attractions. | Madeley Court, St. Michael's Church, Madeley Pool, Local walking trails, Nearby historic sites, Cafés and shops |
| Telford | A large town with shopping centers, parks, and attractions, providing a mix of urban and rural experiences. Great for families and business travelers. | Telford Town Park, The International Centre, Wonderland, Telford Shopping Centre, New Rowley Park, Local parks and outdoor activities |
| Wellington | An historic market town offering local markets, shops, and easy access to surrounding natural beauty, attracting both tourists and business visitors. | Wellington Market, Dothill Local Nature Reserve, The Museum of the Broads, Local restaurants and pubs, Nearby countryside walks, Historical architecture |
| Shifnal | A quaint town known for its medieval heritage and proximity to attractions, appealing to visitors who appreciate history and market towns. | Shifnal's Market Square, St. Andrew's Church, Local shops and cafes, Nearby parks, Wrekin Hill, Historic pubs |
| Broseley | A picturesque town with a rich history and attractive architecture, ideal for tourists seeking a cultural and historical getaway. | Broseley Pipeworks, The Old Pharmacy, Local galleries, Walking trails, Scenic views of the River Severn, Historic buildings |
| Church Stretton | Often referred to as the 'gateway to the Long Mynd' and a popular destination for walking and nature enthusiasts, ideal for outdoor lovers. | Long Mynd, Carding Mill Valley, Stretton Hills, Local shops and cafes, Walking and cycling routes, Beautiful countryside views |
| Bridgnorth | A historic market town known for its scenic cliffs, river views, and historical attractions. Popular among tourists for its charm and accessibility. | Bridgnorth Castle, The Severn Valley Railway, River Severn Views, Local shops and eateries, Cliff Railway, Historical sites |
Understanding Airbnb License Requirements & STR Laws in Little Wenlock (2025)
With 23% of listings showing registration in 2025, understanding potential Airbnb license requirements is crucial in Little Wenlock. Always verify the latest short term rental regulations and Airbnb license requirements directly with local government authorities for Little Wenlock to ensure full compliance before hosting.
(Source: AirROI data, 2025, based on 23% licensed listings)
Top Performing Airbnb Properties in Little Wenlock (2025)
Benchmark your potential! Explore examples of top-performing Airbnb properties in Little Wenlockbased on Trailing Twelve Month (TTM) revenue. Analyze their characteristics, revenue, occupancy rate, and ADR to understand what drives success in this market.
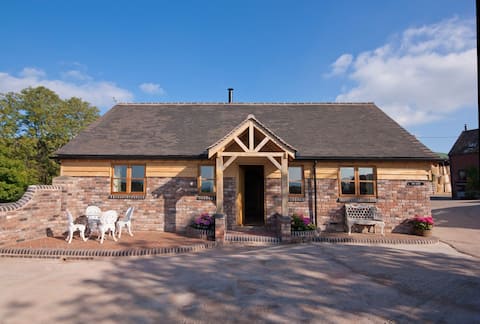
Luxurious Barn with panoramic views of Shropshire
Entire Place • 2 bedrooms
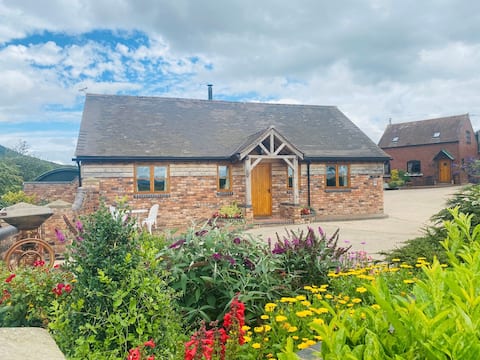
2 Bed in Ironbridge (77771)
Entire Place • 2 bedrooms
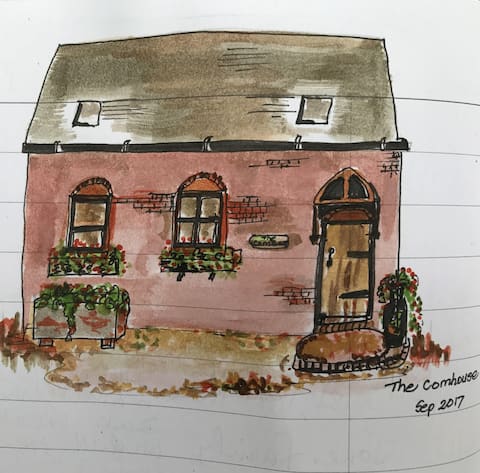
Quirky Cottage Near Ironbridge
Entire Place • 2 bedrooms

2 Bed in Ironbridge (86590)
Entire Place • 2 bedrooms

Wrekin View Hideaway - Walkers Paradise!
Entire Place • 1 bedroom
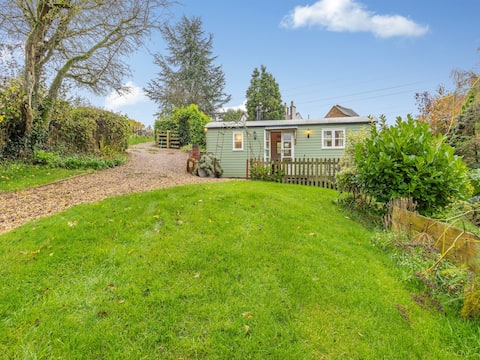
The Shepherds Rest - UK45532
Entire Place • 1 bedroom
Note: Performance varies based on location, size, amenities, seasonality, and management quality. Data reflects the past 12 months.
Top Performing Airbnb Hosts in Little Wenlock (2025)
Learn from the best! This table showcases top-performing Airbnb hosts in Little Wenlock based on the number of properties managed and estimated total revenue over the past year. Analyze their scale and performance metrics.
| Host Name | Properties | Grossing Revenue | Stay Reviews | Avg Rating |
|---|---|---|---|---|
| Derek | 6 | $110,528 | 139 | 4.85/5.0 |
| Host #222199733 | 8 | $98,439 | 0 | N/A/5.0 |
| Holidaycottages.Co.Uk | 2 | $43,713 | 3 | 5.00/5.0 |
| Host #529014181 | 3 | $30,542 | 2 | N/A/5.0 |
| Holidaycottages.Co.Uk | 2 | $19,501 | 1 | N/A/5.0 |
| Richard | 1 | $19,196 | 83 | 4.93/5.0 |
Analyzing the strategies of top hosts, such as their property selection, pricing, and guest communication, can offer valuable lessons for optimizing your own Airbnb operations in Little Wenlock.
Dive Deeper: Advanced Little Wenlock STR Market Data (2025)
Ready to unlock more insights? AirROI provides access to advanced metrics and comprehensive Airbnb data for Little Wenlock. Explore detailed analytics beyond this report to refine your investment strategy, optimize pricing, and maximize your vacation rental profits.
Explore Advanced MetricsLittle Wenlock Short-Term Rental Market Composition (2025): Property & Room Types
Room Type Distribution
Property Type Distribution
Market Composition Insights for Little Wenlock
- The Little Wenlock Airbnb market composition is heavily skewed towards Entire Home/Apt listings, which make up 100% of the 22 active rentals. This indicates strong guest preference for privacy and space.
- Looking at the property type distribution in Little Wenlock, House properties are the most common (81.8%), reflecting the local real estate landscape.
- Houses represent a significant 81.8% portion, catering likely to families or larger groups.
- Smaller segments like unique stays, others (combined 9.0%) offer potential for unique stay experiences.
Little Wenlock Airbnb Room Capacity Analysis (2025): Bedroom Distribution
Distribution of Listings by Number of Bedrooms
Room Capacity Insights for Little Wenlock
- The dominant room capacity in Little Wenlock is 1 bedroom listings, making up 68.2% of the market. This suggests a strong demand for properties suitable for couples or solo travelers.
- Together, 1 bedroom and 2 bedrooms properties represent 95.5% of the active Airbnb listings in Little Wenlock, indicating a high concentration in these sizes.
- With over half the market (68.2%) consisting of studios or 1-bedroom units, Little Wenlock is particularly well-suited for individuals or couples.
Little Wenlock Vacation Rental Guest Capacity Trends (2025)
Distribution of Listings by Guest Capacity
Guest Capacity Insights for Little Wenlock
- The most common guest capacity trend in Little Wenlock vacation rentals is listings accommodating 2 guests (68.2%). This suggests the primary traveler segment is likely couples or solo travelers.
- Properties designed for 2 guests and 4 guests dominate the Little Wenlock STR market, accounting for 100.0% of listings.
- A significant 68.2% of listings cater specifically to 1-2 guests, highlighting strong demand from couples and solo travelers in Little Wenlock.
- On average, properties in Little Wenlock are equipped to host 2.6 guests.
Little Wenlock Airbnb Booking Patterns (2025): Available vs. Booked Days
Available Days Distribution
Booked Days Distribution
Booking Pattern Insights for Little Wenlock
- The most common availability pattern in Little Wenlock falls within the 271-366 days range, representing 72.7% of listings. This suggests many properties have significant open periods on their calendars.
- Approximately 95.4% of listings show high availability (181+ days open annually), indicating potential for increased bookings or specific owner usage patterns.
- For booked days, the 31-90 days range is most frequent in Little Wenlock (45.5%), reflecting common guest stay durations or potential owner blocking patterns.
- A notable 9.1% of properties secure long booking periods (181+ days booked per year), highlighting successful long-term rental strategies or significant owner usage.
Little Wenlock Airbnb Minimum Stay Requirements Analysis
Distribution of Listings by Minimum Night Requirement
1 Night
12 listings
54.5% of total
2 Nights
5 listings
22.7% of total
30+ Nights
5 listings
22.7% of total
Key Insights
- The most prevalent minimum stay requirement in Little Wenlock is 1 Night, adopted by 54.5% of listings. This highlights the market's preference for shorter, flexible bookings.
- A strong majority (77.2%) of the Little Wenlock Airbnb data shows acceptance of very short stays (1-2 nights), indicating a dynamic, high-turnover market.
- A significant segment (22.7%) caters to monthly stays (30+ nights) in Little Wenlock, pointing to opportunities in the extended-stay market.
Recommendations
- Align with the market by considering a 1 Night minimum stay, as 54.5% of Little Wenlock hosts use this setting.
- Explore offering discounts for stays of 30+ nights to attract the 22.7% of the market seeking extended stays.
- Adjust minimum nights based on seasonality – potentially shorter during low season and longer during peak demand periods in Little Wenlock.
Little Wenlock Airbnb Cancellation Policy Trends Analysis (2025)
Super Strict 60 Days
7 listings
50% of total
Flexible
4 listings
28.6% of total
Moderate
1 listings
7.1% of total
Strict
2 listings
14.3% of total
Cancellation Policy Insights for Little Wenlock
- The prevailing Airbnb cancellation policy trend in Little Wenlock is Super Strict 60 Days, used by 50% of listings.
- There's a relatively balanced mix between guest-friendly (35.7%) and stricter (14.3%) policies, offering choices for different guest needs.
Recommendations for Hosts
- Consider adopting a Super Strict 60 Days policy to align with the 50% market standard in Little Wenlock.
- Using a Strict policy might deter some guests, as only 14.3% of listings use it. Evaluate if potential revenue protection outweighs possible lower booking rates.
- Regularly review your cancellation policy against competitors and market demand shifts in Little Wenlock.
Little Wenlock STR Booking Lead Time Analysis (2025)
Average Booking Lead Time by Month
Booking Lead Time Insights for Little Wenlock
- The overall average booking lead time for vacation rentals in Little Wenlock is 54 days.
- Guests book furthest in advance for stays during June (average 129 days), likely coinciding with peak travel demand or local events.
- The shortest booking windows occur for stays in November (average 19 days), indicating more last-minute travel plans during this time.
- Seasonally, Summer (90 days avg.) sees the longest lead times, while Winter (28 days avg.) has the shortest, reflecting typical travel planning cycles.
Recommendations for Hosts
- Use the overall average lead time (54 days) as a baseline for your pricing and availability strategy in Little Wenlock.
- For June stays, consider implementing length-of-stay discounts or slightly higher rates for bookings made less than 129 days out to capitalize on advance planning.
- Target marketing efforts for the Summer season well in advance (at least 90 days) to capture early planners.
- Monitor your own booking lead times against these Little Wenlock averages to identify opportunities for dynamic pricing adjustments.
Popular & Essential Airbnb Amenities in Little Wenlock (2025)
Amenity Prevalence
Amenity Insights for Little Wenlock
- Essential amenities in Little Wenlock that guests expect include: Kitchen, TV, Wifi, Free parking on premises. Lacking these (any) could significantly impact bookings.
- Popular amenities like Essentials, Heating, Smoke alarm are common but not universal. Offering these can provide a competitive edge.
Recommendations for Hosts
- Ensure your listing includes all essential amenities for Little Wenlock: Kitchen, TV, Wifi, Free parking on premises.
- Prioritize adding missing essentials: Free parking on premises.
- Consider adding popular differentiators like Essentials or Heating to increase appeal.
- Highlight unique or less common amenities you offer (e.g., hot tub, dedicated workspace, EV charger) in your listing description and photos.
- Regularly check competitor amenities in Little Wenlock to stay competitive.
Little Wenlock Airbnb Guest Demographics & Profile Analysis (2025)
Guest Profile Summary for Little Wenlock
- The typical guest profile for Airbnb in Little Wenlock consists of primarily domestic travelers (90%), often arriving from nearby England, typically belonging to the Post-2000s (Gen Z/Alpha) group (50%), primarily speaking English or German.
- Domestic travelers account for 89.7% of guests.
- Key international markets include United Kingdom (89.7%) and Netherlands (2.6%).
- Top languages spoken are English (82.4%) followed by German (5.9%).
- A significant demographic segment is the Post-2000s (Gen Z/Alpha) group, representing 50% of guests.
Recommendations for Hosts
- Target domestic marketing efforts towards travelers from England and Ketley.
- Tailor amenities and listing descriptions to appeal to the dominant Post-2000s (Gen Z/Alpha) demographic (e.g., highlight fast WiFi, smart home features, local guides).
- Highlight unique local experiences or amenities relevant to the primary guest profile.
- Consider seasonal promotions aligned with peak travel times for key origin markets.
Nearby Short-Term Rental Market Comparison
How does the Little Wenlock Airbnb market stack up against its neighbors? Compare key performance metrics like average monthly revenue, ADR, and occupancy rates in surrounding areas to understand the broader regional STR landscape.
| Market | Active Properties | Monthly Revenue | Daily Rate | Avg. Occupancy |
|---|---|---|---|---|
| Englishcombe | 15 | $6,685 | $523.51 | 50% |
| Chew Magna | 16 | $6,360 | $413.61 | 44% |
| Long Sutton | 17 | $5,964 | $404.64 | 44% |
| Lambourn | 12 | $5,662 | $643.69 | 28% |
| Chirbury | 14 | $5,230 | $735.87 | 45% |
| Ashley | 12 | $5,214 | $355.94 | 52% |
| Woolhope | 11 | $4,986 | $592.14 | 29% |
| Dinton | 11 | $4,616 | $250.27 | 58% |
| Oldland Common | 13 | $4,517 | $372.05 | 41% |
| Binegar | 10 | $4,514 | $267.41 | 58% |