Charlton Airbnb Market Analysis 2025: Short Term Rental Data & Vacation Rental Statistics in England, United Kingdom
Is Airbnb profitable in Charlton in 2025? Explore comprehensive Airbnb analytics for Charlton, England, United Kingdom to uncover income potential. This 2025 STR market report for Charlton, based on AirROI data from June 2024 to May 2025, reveals key trends in the niche market of 19 active listings.
Whether you're considering an Airbnb investment in Charlton, optimizing your existing vacation rental, or exploring rental arbitrage opportunities, understanding the Charlton Airbnb data is crucial. Leveraging the low regulation environment is key to maximizing your short term rental income potential. Let's dive into the specifics.
Key Charlton Airbnb Performance Metrics Overview
Monthly Airbnb Revenue Variations & Income Potential in Charlton (2025)
Understanding the monthly revenue variations for Airbnb listings in Charlton is key to maximizing your short term rental income potential. Seasonality significantly impacts earnings. Our analysis, based on data from the past 12 months, shows that the peak revenue month for STRs in Charlton is typically June, while February often presents the lowest earnings, highlighting opportunities for strategic pricing adjustments during shoulder and low seasons. Explore the typical Airbnb income in Charlton across different performance tiers:
- Best-in-class properties (Top 10%) achieve $5,479+ monthly, often utilizing dynamic pricing and superior guest experiences.
- Strong performing properties (Top 25%) earn $3,465 or more, indicating effective management and desirable locations/amenities.
- Typical properties (Median) generate around $1,858 per month, representing the average market performance.
- Entry-level properties (Bottom 25%) see earnings around $1,032, often with potential for optimization.
Average Monthly Airbnb Earnings Trend in Charlton
Charlton Airbnb Occupancy Rate Trends (2025)
Maximize your bookings by understanding the Charlton STR occupancy trends. Seasonal demand shifts significantly influence how often properties are booked. Typically, Junesees the highest demand (peak season occupancy), while January experiences the lowest (low season). Effective strategies, like adjusting minimum stays or offering promotions, can boost occupancy during slower periods. Here's how different property tiers perform in Charlton:
- Best-in-class properties (Top 10%) achieve 89%+ occupancy, indicating high desirability and potentially optimized availability.
- Strong performing properties (Top 25%) maintain 63% or higher occupancy, suggesting good market fit and guest satisfaction.
- Typical properties (Median) have an occupancy rate around 40%.
- Entry-level properties (Bottom 25%) average 24% occupancy, potentially facing higher vacancy.
Average Monthly Occupancy Rate Trend in Charlton
Average Daily Rate (ADR) Airbnb Trends in Charlton (2025)
Effective short term rental pricing strategy in Charlton involves understanding monthly ADR fluctuations. The Average Daily Rate (ADR) for Airbnb in Charlton typically peaks in May and dips lowest during January. Leveraging Airbnb dynamic pricing tools or strategies based on this seasonality can significantly boost revenue. Here's a look at the typical nightly rates achieved:
- Best-in-class properties (Top 10%) command rates of $466+ per night, often due to premium features or locations.
- Strong performing properties (Top 25%) achieve nightly rates of $292 or more.
- Typical properties (Median) charge around $141 per night.
- Entry-level properties (Bottom 25%) earn around $93 per night.
Average Daily Rate (ADR) Trend by Month in Charlton
Get Live Charlton Market Intelligence 👇

Explore Real-time Analytics
Airbnb Seasonality Analysis & Trends in Charlton (2025)
Peak Season (June, August, July)
- Revenue averages $3,027 per month
- Occupancy rates average 57.6%
- Daily rates average $215
Shoulder Season
- Revenue averages $2,361 per month
- Occupancy maintains around 42.9%
- Daily rates hold near $219
Low Season (February, October, November)
- Revenue drops to average $1,926 per month
- Occupancy decreases to average 43.4%
- Daily rates adjust to average $216
Seasonality Insights for Charlton
- The Airbnb seasonality in Charlton shows highly seasonal trends requiring careful strategy. While the sections above show seasonal averages, it's also insightful to look at the extremes:
- During the high season, the absolute peak month showcases Charlton's highest earning potential, with monthly revenues capable of climbing to $3,327, occupancy reaching a high of 66.7%, and ADRs peaking at $235.
- Conversely, the slowest single month of the year, typically falling within the low season, marks the market's lowest point. In this month, revenue might dip to $1,626, occupancy could drop to 30.2%, and ADRs may adjust down to $209.
- Understanding both the seasonal averages and these monthly peaks and troughs in revenue, occupancy, and ADR is crucial for maximizing your Airbnb profit potential in Charlton.
Seasonal Strategies for Maximizing Profit
- Peak Season: Maximize revenue through premium pricing and potentially longer minimum stays. Ensure high availability.
- Low Season: Offer competitive pricing, special promotions (e.g., extended stay discounts), and flexible cancellation policies. Target off-season travelers like remote workers or budget-conscious guests.
- Shoulder Seasons: Implement dynamic pricing that balances peak and low rates. Target weekend travelers or specific events. Offer slightly more flexible terms than peak season.
- Regularly analyze your own performance against these Charlton seasonality benchmarks and adjust your pricing and availability strategy accordingly.
Best Areas for Airbnb Investment in Charlton (2025)
Exploring the top neighborhoods for short-term rentals in Charlton? This section highlights key areas, outlining why they are attractive for hosts and guests, along with notable local attractions. Consider these locations based on your target guest profile and investment strategy.
| Neighborhood / Area | Why Host Here? (Target Guests & Appeal) | Key Attractions & Landmarks |
|---|---|---|
| Charlton Village | Charming area with local shops, cafes, and parks, appealing to visitors seeking a quaint, community-oriented experience. Close to Greenwich and historic sites. | Charlton House, Maryon Park, Charlton Park, Greenwich Park, Royal Observatory |
| Woolwich | A vibrant area with a rich history and connections to London, ideal for visitors looking for affordable accommodation with great transport links to the city. | Woolwich Royal Arsenal, Crossrail Place, Woolwich Market, Thames Barrier Park, Greenwich Heritage Centre |
| Blackheath | Known for its scenic heath and village atmosphere, Blackheath attracts families and nature lovers, offering a peaceful retreat close to the city. | Blackheath Common, Greenwich Park, Various local pubs and restaurants, Blackheath Farmers Market, The Conservatoire |
| Greenwich | A UNESCO World Heritage site with historical attractions, ideal for tourists interested in maritime history and stunning riverside views. | Greenwich Observatory, Cutty Sark, National Maritime Museum, Greenwich Market, Thames Clipper boat services |
| North Greenwich | Home to the O2 Arena and various entertainment venues, it draws visitors for concerts and events while offering great transport links to central London. | O2 Arena, Greenwich Peninsula, The Tide, North Greenwich station, Thames Clippers |
| Charlton Athletic Stadium | Attracts sports fans and event-goers, with nearby pubs and dining options, making it a popular choice during match days and events. | Charlton Athletic Football Club, The Valley, Local pubs, Nearby parks |
| East Greenwich | A quieter, residential area with easy access to the wider attractions of Greenwich, appealing for families and longer stay visitors. | Greenwich Yacht Club, Healthy Living Centre, Local cafes and shops, Thames Path walking trails |
| The Royal Arsenal | A historic site offering modern accommodations and proximity to the river, providing guests with a unique blend of history and modernity. | Royal Arsenal, Café at the Arsenal, The Woolwich Ferry, Thames Barrier Park |
Understanding Airbnb License Requirements & STR Laws in Charlton (2025)
While Charlton, England, United Kingdom currently shows low STR regulations, specific Airbnb license requirements might still exist or change. Always verify the latest short term rental regulations and Airbnb license requirements directly with local government authorities for Charlton to ensure full compliance before hosting.
(Source: AirROI data, 2025, based on 5% licensed listings)
Top Performing Airbnb Properties in Charlton (2025)
Benchmark your potential! Explore examples of top-performing Airbnb properties in Charltonbased on Trailing Twelve Month (TTM) revenue. Analyze their characteristics, revenue, occupancy rate, and ADR to understand what drives success in this market.
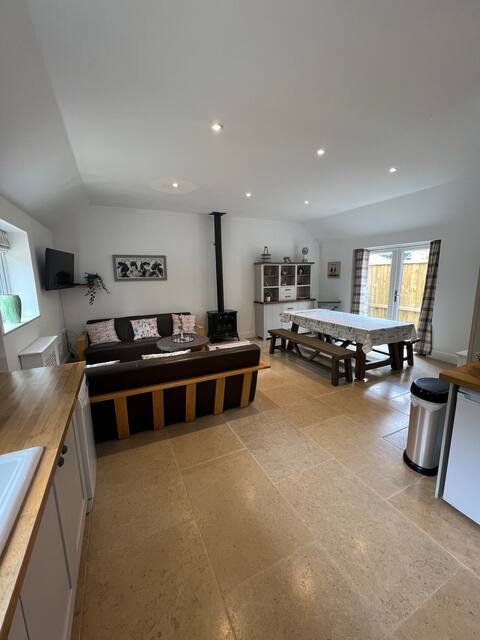
School House | Charlton. A unique surprise!
Entire Place • 3 bedrooms
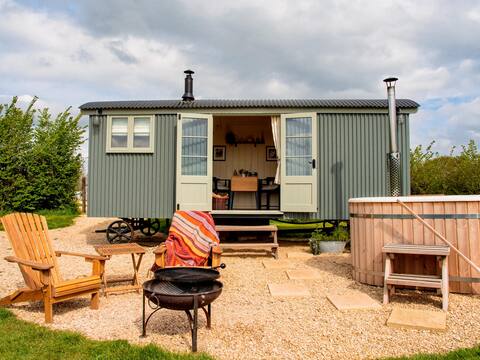
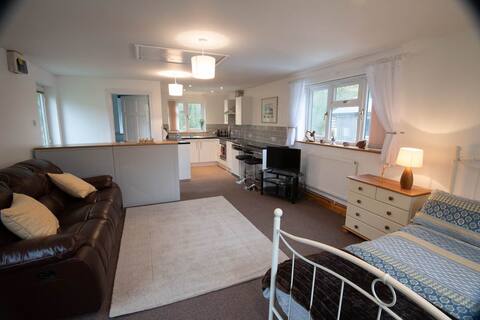
Secluded Luxury Shepherds Hut in The Cotswolds
Entire Place • 1 bedroom
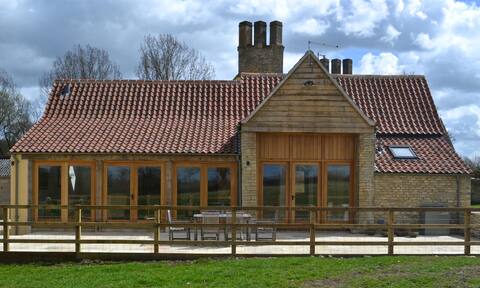
Charming Barn Conversion,Malmesbury
Entire Place • 2 bedrooms
Cotswold home with a fireplace overlooking fields.
Entire Place • 3 bedrooms
Farmyard cottage
Entire Place • 3 bedrooms
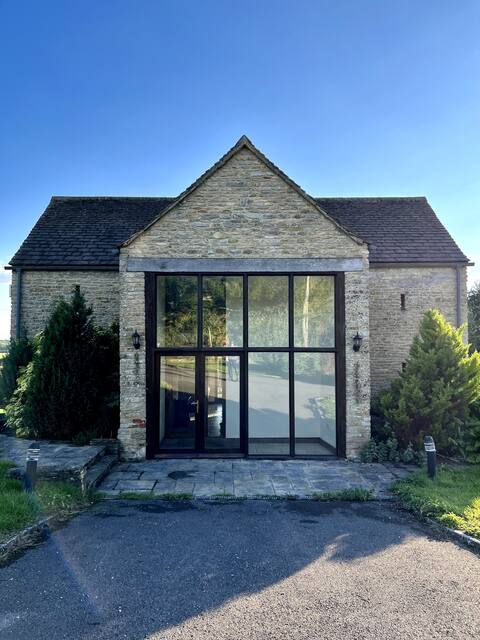
Cotswold Studio Near Malmesbury
Entire Place • N/A
Note: Performance varies based on location, size, amenities, seasonality, and management quality. Data reflects the past 12 months.
Top Performing Airbnb Hosts in Charlton (2025)
Learn from the best! This table showcases top-performing Airbnb hosts in Charlton based on the number of properties managed and estimated total revenue over the past year. Analyze their scale and performance metrics.
| Host Name | Properties | Grossing Revenue | Stay Reviews | Avg Rating |
|---|---|---|---|---|
| Julia | 1 | $67,545 | 194 | 4.89/5.0 |
| Nicola | 1 | $46,933 | 358 | 4.98/5.0 |
| Philippa | 1 | $43,881 | 132 | 4.98/5.0 |
| Amelia | 2 | $35,062 | 46 | 4.96/5.0 |
| Katy | 3 | $30,389 | 315 | 4.91/5.0 |
| Host #294532801 | 1 | $25,702 | 33 | 4.58/5.0 |
| Veronica | 1 | $20,416 | 211 | 4.96/5.0 |
| Tony | 1 | $15,022 | 155 | 4.97/5.0 |
| Joanna | 1 | $14,724 | 58 | 4.74/5.0 |
| Kirsty | 1 | $14,288 | 139 | 4.88/5.0 |
Analyzing the strategies of top hosts, such as their property selection, pricing, and guest communication, can offer valuable lessons for optimizing your own Airbnb operations in Charlton.
Dive Deeper: Advanced Charlton STR Market Data (2025)
Ready to unlock more insights? AirROI provides access to advanced metrics and comprehensive Airbnb data for Charlton. Explore detailed analytics beyond this report to refine your investment strategy, optimize pricing, and maximize your vacation rental profits.
Explore Advanced MetricsCharlton Short-Term Rental Market Composition (2025): Property & Room Types
Room Type Distribution
Property Type Distribution
Market Composition Insights for Charlton
- The Charlton Airbnb market composition is heavily skewed towards Entire Home/Apt listings, which make up 78.9% of the 19 active rentals. This indicates strong guest preference for privacy and space.
- Looking at the property type distribution in Charlton, House properties are the most common (47.4%), reflecting the local real estate landscape.
- Houses represent a significant 47.4% portion, catering likely to families or larger groups.
- The presence of 21.1% Hotel/Boutique listings indicates integration with traditional hospitality.
Charlton Airbnb Room Capacity Analysis (2025): Bedroom Distribution
Distribution of Listings by Number of Bedrooms
Room Capacity Insights for Charlton
- The dominant room capacity in Charlton is 2 bedrooms listings, making up 31.6% of the market. This suggests a strong demand for properties suitable for couples or solo travelers.
- Together, 2 bedrooms and 3 bedrooms properties represent 52.7% of the active Airbnb listings in Charlton, indicating a high concentration in these sizes.
- A significant 21.1% of listings offer 3+ bedrooms, catering to larger groups and families seeking more space in Charlton.
Charlton Vacation Rental Guest Capacity Trends (2025)
Distribution of Listings by Guest Capacity
Guest Capacity Insights for Charlton
- The most common guest capacity trend in Charlton vacation rentals is listings accommodating 4 guests (21.1%). This suggests the primary traveler segment is likely small families or groups.
- Properties designed for 4 guests and 2 guests dominate the Charlton STR market, accounting for 42.2% of listings.
- 26.4% of properties accommodate 6+ guests, serving the market segment for larger families or group travel in Charlton.
- On average, properties in Charlton are equipped to host 3.9 guests.
Charlton Airbnb Booking Patterns (2025): Available vs. Booked Days
Available Days Distribution
Booked Days Distribution
Booking Pattern Insights for Charlton
- The most common availability pattern in Charlton falls within the 271-366 days range, representing 47.4% of listings. This suggests many properties have significant open periods on their calendars.
- Approximately 84.2% of listings show high availability (181+ days open annually), indicating potential for increased bookings or specific owner usage patterns.
- For booked days, the 91-180 days range is most frequent in Charlton (36.8%), reflecting common guest stay durations or potential owner blocking patterns.
- A notable 15.8% of properties secure long booking periods (181+ days booked per year), highlighting successful long-term rental strategies or significant owner usage.
Charlton Airbnb Minimum Stay Requirements Analysis
Distribution of Listings by Minimum Night Requirement
1 Night
8 listings
47.1% of total
2 Nights
7 listings
41.2% of total
4-6 Nights
1 listings
5.9% of total
30+ Nights
1 listings
5.9% of total
Key Insights
- The most prevalent minimum stay requirement in Charlton is 1 Night, adopted by 47.1% of listings. This highlights the market's preference for shorter, flexible bookings.
- A strong majority (88.3%) of the Charlton Airbnb data shows acceptance of very short stays (1-2 nights), indicating a dynamic, high-turnover market.
Recommendations
- Align with the market by considering a 1 Night minimum stay, as 47.1% of Charlton hosts use this setting.
- Explore offering discounts for stays of 30+ nights to attract the 5.9% of the market seeking extended stays.
- Adjust minimum nights based on seasonality – potentially shorter during low season and longer during peak demand periods in Charlton.
Charlton Airbnb Cancellation Policy Trends Analysis (2025)
Super Strict 60 Days
2 listings
12.5% of total
Flexible
5 listings
31.3% of total
Moderate
4 listings
25% of total
Firm
2 listings
12.5% of total
Strict
3 listings
18.8% of total
Cancellation Policy Insights for Charlton
- The prevailing Airbnb cancellation policy trend in Charlton is Flexible, used by 31.3% of listings.
- There's a relatively balanced mix between guest-friendly (56.3%) and stricter (31.3%) policies, offering choices for different guest needs.
Recommendations for Hosts
- Consider adopting a Flexible policy to align with the 31.3% market standard in Charlton.
- Regularly review your cancellation policy against competitors and market demand shifts in Charlton.
Charlton STR Booking Lead Time Analysis (2025)
Average Booking Lead Time by Month
Booking Lead Time Insights for Charlton
- The overall average booking lead time for vacation rentals in Charlton is 77 days.
- Guests book furthest in advance for stays during May (average 103 days), likely coinciding with peak travel demand or local events.
- The shortest booking windows occur for stays in September (average 51 days), indicating more last-minute travel plans during this time.
- Seasonally, Spring (99 days avg.) sees the longest lead times, while Winter (59 days avg.) has the shortest, reflecting typical travel planning cycles.
Recommendations for Hosts
- Use the overall average lead time (77 days) as a baseline for your pricing and availability strategy in Charlton.
- For May stays, consider implementing length-of-stay discounts or slightly higher rates for bookings made less than 103 days out to capitalize on advance planning.
- Target marketing efforts for the Spring season well in advance (at least 99 days) to capture early planners.
- Monitor your own booking lead times against these Charlton averages to identify opportunities for dynamic pricing adjustments.
Popular & Essential Airbnb Amenities in Charlton (2025)
Amenity Prevalence
Amenity Insights for Charlton
- Essential amenities in Charlton that guests expect include: Free parking on premises. Lacking these (this) could significantly impact bookings.
- Popular amenities like Kitchen, Essentials, Smoke alarm are common but not universal. Offering these can provide a competitive edge.
- Warning: Wifi is not universally provided but is considered essential globally. Ensure reliable Wifi is offered.
Recommendations for Hosts
- Ensure your listing includes all essential amenities for Charlton: Free parking on premises.
- Consider adding popular differentiators like Kitchen or Essentials to increase appeal.
- Highlight unique or less common amenities you offer (e.g., hot tub, dedicated workspace, EV charger) in your listing description and photos.
- Regularly check competitor amenities in Charlton to stay competitive.
Charlton Airbnb Guest Demographics & Profile Analysis (2025)
Guest Profile Summary for Charlton
- The typical guest profile for Airbnb in Charlton consists of primarily domestic travelers (89%), often arriving from nearby England, typically belonging to the Post-2000s (Gen Z/Alpha) group (50%), primarily speaking English or Italian.
- Domestic travelers account for 88.9% of guests.
- Key international markets include United Kingdom (88.9%) and New Zealand (2.1%).
- Top languages spoken are English (77.1%) followed by Italian (3.8%).
- A significant demographic segment is the Post-2000s (Gen Z/Alpha) group, representing 50% of guests.
Recommendations for Hosts
- Target domestic marketing efforts towards travelers from England and London.
- Tailor amenities and listing descriptions to appeal to the dominant Post-2000s (Gen Z/Alpha) demographic (e.g., highlight fast WiFi, smart home features, local guides).
- Highlight unique local experiences or amenities relevant to the primary guest profile.
- Consider seasonal promotions aligned with peak travel times for key origin markets.
Nearby Short-Term Rental Market Comparison
How does the Charlton Airbnb market stack up against its neighbors? Compare key performance metrics like average monthly revenue, ADR, and occupancy rates in surrounding areas to understand the broader regional STR landscape.
| Market | Active Properties | Monthly Revenue | Daily Rate | Avg. Occupancy |
|---|---|---|---|---|
| Dorney | 12 | $7,086 | $633.88 | 42% |
| Englishcombe | 15 | $6,685 | $523.51 | 50% |
| Chew Magna | 16 | $6,360 | $413.61 | 44% |
| Long Sutton | 17 | $5,964 | $404.64 | 44% |
| Lambourn | 12 | $5,662 | $643.69 | 28% |
| Winsham | 11 | $5,299 | $507.01 | 45% |
| City of Westminster | 1,603 | $5,234 | $500.33 | 50% |
| Ashley | 12 | $5,214 | $355.94 | 52% |
| Woolhope | 11 | $4,986 | $592.14 | 29% |
| Dinton | 11 | $4,616 | $250.27 | 58% |