Dar es-Salaam Airbnb Market Analysis 2026: Short Term Rental Data & Vacation Rental Statistics in Coastal Zone, Tanzania
Is Airbnb profitable in Dar es-Salaam in 2026? Explore comprehensive Airbnb analytics for Dar es-Salaam, Coastal Zone, Tanzania to uncover income potential. This 2026 STR market report for Dar es-Salaam, based on AirROI data from February 2025 to January 2026, reveals key trends in the market of 767 active listings.
Whether you're considering an Airbnb investment in Dar es-Salaam, optimizing your existing vacation rental, or exploring rental arbitrage opportunities, understanding the Dar es-Salaam Airbnb data is crucial. Leveraging the low regulation environment is key to maximizing your short term rental income potential. Let's dive into the specifics.
Key Dar es-Salaam Airbnb Performance Metrics Overview
Monthly Airbnb Revenue Variations & Income Potential in Dar es-Salaam (2026)
Understanding the monthly revenue variations for Airbnb listings in Dar es-Salaam is key to maximizing your short term rental income potential. Seasonality significantly impacts earnings. Our analysis, based on data from the past 12 months, shows that the peak revenue month for STRs in Dar es-Salaam is typically July, while January often presents the lowest earnings, highlighting opportunities for strategic pricing adjustments during shoulder and low seasons. Explore the typical Airbnb income in Dar es-Salaam across different performance tiers:
- Best-in-class properties (Top 10%) achieve $1,669+ monthly, often utilizing dynamic pricing and superior guest experiences.
- Strong performing properties (Top 25%) earn $922 or more, indicating effective management and desirable locations/amenities.
- Typical properties (Median) generate around $444 per month, representing the average market performance.
- Entry-level properties (Bottom 25%) see earnings around $184, often with potential for optimization.
Average Monthly Airbnb Earnings Trend in Dar es-Salaam
Dar es-Salaam Airbnb Occupancy Rate Trends (2026)
Maximize your bookings by understanding the Dar es-Salaam STR occupancy trends. Seasonal demand shifts significantly influence how often properties are booked. Typically, Februarysees the highest demand (peak season occupancy), while January experiences the lowest (low season). Effective strategies, like adjusting minimum stays or offering promotions, can boost occupancy during slower periods. Here's how different property tiers perform in Dar es-Salaam:
- Best-in-class properties (Top 10%) achieve 70%+ occupancy, indicating high desirability and potentially optimized availability.
- Strong performing properties (Top 25%) maintain 50% or higher occupancy, suggesting good market fit and guest satisfaction.
- Typical properties (Median) have an occupancy rate around 27%.
- Entry-level properties (Bottom 25%) average 12% occupancy, potentially facing higher vacancy.
Average Monthly Occupancy Rate Trend in Dar es-Salaam
Average Daily Rate (ADR) Airbnb Trends in Dar es-Salaam (2026)
Effective short term rental pricing strategy in Dar es-Salaam involves understanding monthly ADR fluctuations. The Average Daily Rate (ADR) for Airbnb in Dar es-Salaam typically peaks in August and dips lowest during March. Leveraging Airbnb dynamic pricing tools or strategies based on this seasonality can significantly boost revenue. Here's a look at the typical nightly rates achieved:
- Best-in-class properties (Top 10%) command rates of $128+ per night, often due to premium features or locations.
- Strong performing properties (Top 25%) achieve nightly rates of $82 or more.
- Typical properties (Median) charge around $49 per night.
- Entry-level properties (Bottom 25%) earn around $32 per night.
Average Daily Rate (ADR) Trend by Month in Dar es-Salaam
Get Live Dar es-Salaam Market Intelligence 👇

Explore Real-time Analytics
Airbnb Seasonality Analysis & Trends in Dar es-Salaam (2026)
Peak Season (July, August, June)
- Revenue averages $825 per month
- Occupancy rates average 36.2%
- Daily rates average $69
Shoulder Season
- Revenue averages $703 per month
- Occupancy maintains around 34.9%
- Daily rates hold near $66
Low Season (January, November, December)
- Revenue drops to average $564 per month
- Occupancy decreases to average 26.8%
- Daily rates adjust to average $66
Seasonality Insights for Dar es-Salaam
- The Airbnb seasonality in Dar es-Salaam shows moderate seasonality with distinct peak and low periods. While the sections above show seasonal averages, it's also insightful to look at the extremes:
- During the high season, the absolute peak month showcases Dar es-Salaam's highest earning potential, with monthly revenues capable of climbing to $852, occupancy reaching a high of 39.1%, and ADRs peaking at $69.
- Conversely, the slowest single month of the year, typically falling within the low season, marks the market's lowest point. In this month, revenue might dip to $517, occupancy could drop to 25.2%, and ADRs may adjust down to $64.
- Understanding both the seasonal averages and these monthly peaks and troughs in revenue, occupancy, and ADR is crucial for maximizing your Airbnb profit potential in Dar es-Salaam.
Seasonal Strategies for Maximizing Profit
- Peak Season: Maximize revenue through premium pricing and potentially longer minimum stays. Ensure high availability.
- Low Season: Offer competitive pricing, special promotions (e.g., extended stay discounts), and flexible cancellation policies. Target off-season travelers like remote workers or budget-conscious guests.
- Shoulder Seasons: Implement dynamic pricing that balances peak and low rates. Target weekend travelers or specific events. Offer slightly more flexible terms than peak season.
- Regularly analyze your own performance against these Dar es-Salaam seasonality benchmarks and adjust your pricing and availability strategy accordingly.
Best Areas for Airbnb Investment in Dar es-Salaam (2026)
Exploring the top neighborhoods for short-term rentals in Dar es-Salaam? This section highlights key areas, outlining why they are attractive for hosts and guests, along with notable local attractions. Consider these locations based on your target guest profile and investment strategy.
| Neighborhood / Area | Why Host Here? (Target Guests & Appeal) | Key Attractions & Landmarks |
|---|---|---|
| Msasani Peninsula | A thriving area known for its beaches, restaurants, and vibrant nightlife. It's popular with expatriates and locals alike, providing a mix of local culture and international flair. | Msasani Beach, Mbudya Island, The Slipway, Sea Cliff Village, Waterfront Restaurants |
| Kivukoni | A central district close to the bustling city center, offering easy access to attractions, markets, and local experiences. It's a great spot for travelers looking to immerse themselves in the local culture. | Dar es Salaam Fish Market, Askari Monument, National Museum, Uhuru Monument, Nyerere Square |
| Upanga | An upscale residential neighborhood known for its quiet atmosphere and proximity to the city center. Appeals to business travelers and tourists seeking a more relaxed environment. | Village Museum, Tanzania National Museum, Air Tanzania Headquarters |
| Mikocheni | A growing area with a mix of residential, commercial, and entertainment options. Popular with young professionals and families, offering modern amenities and facilities. | Mikocheni Light Industrial Area, Shopping Centers, Local Markets |
| Kinondoni | A vibrant area known for its lively street life and local markets. It attracts tourists interested in local culture and experiences beyond the typical tourist spots. | Local Markets, Cultural Festivals, Restaurants and Cafes |
| Tandale | A bustling neighborhood that showcases the local lifestyle and culture of Dar es Salaam. Ideal for those looking for authentic experiences and to connect with local communities. | Street Food Stalls, Cultural Activities, Local Events |
| Downtown Dar es Salaam | The economic hub of the city with historical significance. Hosts many businesses, governmental offices, and cultural sites, making it ideal for business travelers. | Kivukoni Fish Market, Old Boma, National Museum, Botanical Gardens |
| Bongoyo Island | A pristine getaway just a short boat ride from the city. It's perfect for vacation rentals targeting those looking for relaxation and outdoor activities. | Beaches, Snorkeling and Diving Spots, Nature Trails |
Understanding Airbnb License Requirements & STR Laws in Dar es-Salaam (2026)
While Dar es-Salaam, Coastal Zone, Tanzania currently shows low STR regulations, specific Airbnb license requirements might still exist or change. Always verify the latest short term rental regulations and Airbnb license requirements directly with local government authorities for Dar es-Salaam to ensure full compliance before hosting.
(Source: AirROI data, 2026, based on 0% licensed listings)
Top Performing Airbnb Properties in Dar es-Salaam (2026)
Benchmark your potential! Explore examples of top-performing Airbnb properties in Dar es-Salaambased on Trailing Twelve Month (TTM) revenue. Analyze their characteristics, revenue, occupancy rate, and ADR to understand what drives success in this market.
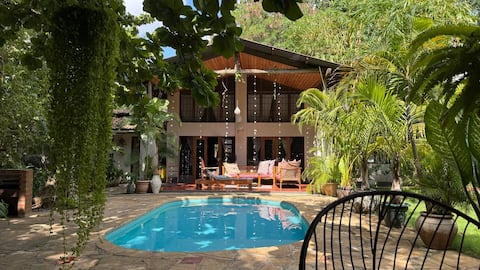
Zanna’s Unique Home with Swimming Pool
Entire Place • 5 bedrooms
Cheerful five bedroom villa with pool
Entire Place • 5 bedrooms
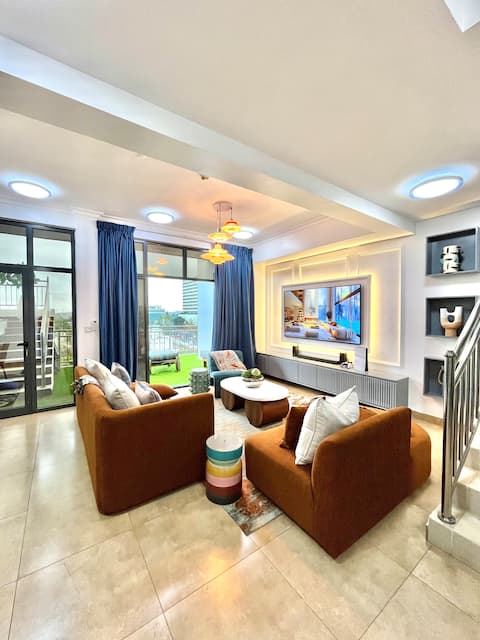
Luxury Sea view In Masaki 2BR
Entire Place • 2 bedrooms
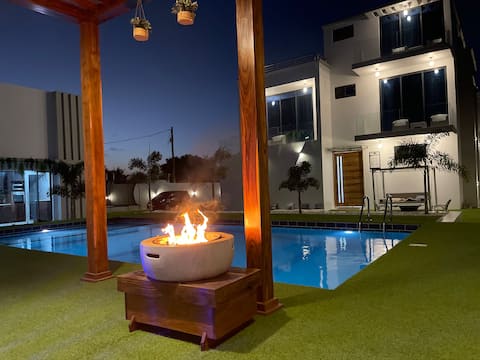
Dopamine Penthouse PrivatePool 5mnts to Beach&City
Entire Place • 4 bedrooms
SunshineHome with Sea view
Entire Place • 3 bedrooms
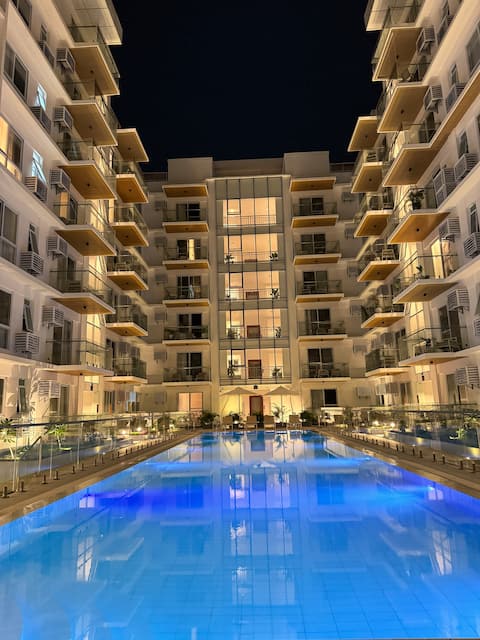
Ocean view-2 bed rooms apartment
Entire Place • 2 bedrooms
Note: Performance varies based on location, size, amenities, seasonality, and management quality. Data reflects the past 12 months.
Top Performing Airbnb Hosts in Dar es-Salaam (2026)
Learn from the best! This table showcases top-performing Airbnb hosts in Dar es-Salaam based on the number of properties managed and estimated total revenue over the past year. Analyze their scale and performance metrics.
| Host Name | Properties | Grossing Revenue | Stay Reviews | Avg Rating |
|---|---|---|---|---|
| Zau Raneli | 8 | $157,692 | 379 | 4.89/5.0 |
| Yayo | 10 | $110,613 | 766 | 4.25/5.0 |
| Happy | 8 | $99,795 | 661 | 4.79/5.0 |
| Peric | 19 | $98,803 | 335 | 4.85/5.0 |
| Doreen | 11 | $78,366 | 229 | 4.88/5.0 |
| Better-Stay Properties | 9 | $77,630 | 189 | 4.83/5.0 |
| Yayo | 13 | $69,803 | 668 | 4.44/5.0 |
| Brills | 6 | $66,842 | 38 | 4.84/5.0 |
| Alex | 9 | $65,117 | 416 | 4.89/5.0 |
| Zanna | 4 | $61,344 | 84 | 4.98/5.0 |
Analyzing the strategies of top hosts, such as their property selection, pricing, and guest communication, can offer valuable lessons for optimizing your own Airbnb operations in Dar es-Salaam.
Dive Deeper: Advanced Dar es-Salaam STR Market Data (2026)
Ready to unlock more insights? AirROI provides access to advanced metrics and comprehensive Airbnb data for Dar es-Salaam. Explore detailed analytics beyond this report to refine your investment strategy, optimize pricing, and maximize your vacation rental profits.
Explore Advanced MetricsDar es-Salaam Short-Term Rental Market Composition (2026): Property & Room Types
Room Type Distribution
Property Type Distribution
Market Composition Insights for Dar es-Salaam
- The Dar es-Salaam Airbnb market composition is heavily skewed towards Entire Home/Apt listings, which make up 76.8% of the 767 active rentals. This indicates strong guest preference for privacy and space.
- Looking at the property type distribution in Dar es-Salaam, Apartment/Condo properties are the most common (68.2%), reflecting the local real estate landscape.
- Houses represent a significant 23.6% portion, catering likely to families or larger groups.
- The presence of 5.7% Hotel/Boutique listings indicates integration with traditional hospitality.
- Smaller segments like others, outdoor/unique, unique stays (combined 2.5%) offer potential for unique stay experiences.
Dar es-Salaam Airbnb Room Capacity Analysis (2026): Bedroom Distribution
Distribution of Listings by Number of Bedrooms
Room Capacity Insights for Dar es-Salaam
- The dominant room capacity in Dar es-Salaam is 1 bedroom listings, making up 38.2% of the market. This suggests a strong demand for properties suitable for couples or solo travelers.
- Together, 1 bedroom and 2 bedrooms properties represent 60.9% of the active Airbnb listings in Dar es-Salaam, indicating a high concentration in these sizes.
- A significant 23.4% of listings offer 3+ bedrooms, catering to larger groups and families seeking more space in Dar es-Salaam.
Dar es-Salaam Vacation Rental Guest Capacity Trends (2026)
Distribution of Listings by Guest Capacity
Guest Capacity Insights for Dar es-Salaam
- The most common guest capacity trend in Dar es-Salaam vacation rentals is listings accommodating 2 guests (37.2%). This suggests the primary traveler segment is likely couples or solo travelers.
- Properties designed for 2 guests and 4 guests dominate the Dar es-Salaam STR market, accounting for 57.1% of listings.
- 20.1% of properties accommodate 6+ guests, serving the market segment for larger families or group travel in Dar es-Salaam.
- On average, properties in Dar es-Salaam are equipped to host 3.1 guests.
Dar es-Salaam Airbnb Booking Patterns (2026): Available vs. Booked Days
Available Days Distribution
Booked Days Distribution
Booking Pattern Insights for Dar es-Salaam
- The most common availability pattern in Dar es-Salaam falls within the 271-366 days range, representing 71.3% of listings. This suggests many properties have significant open periods on their calendars.
- Approximately 93.7% of listings show high availability (181+ days open annually), indicating potential for increased bookings or specific owner usage patterns.
- For booked days, the 1-30 days range is most frequent in Dar es-Salaam (36.6%), reflecting common guest stay durations or potential owner blocking patterns.
- A notable 7.3% of properties secure long booking periods (181+ days booked per year), highlighting successful long-term rental strategies or significant owner usage.
Dar es-Salaam Airbnb Minimum Stay Requirements Analysis
Distribution of Listings by Minimum Night Requirement
1 Night
491 listings
64% of total
2 Nights
91 listings
11.9% of total
3 Nights
29 listings
3.8% of total
4-6 Nights
21 listings
2.7% of total
7-29 Nights
12 listings
1.6% of total
30+ Nights
123 listings
16% of total
Key Insights
- The most prevalent minimum stay requirement in Dar es-Salaam is 1 Night, adopted by 64% of listings. This highlights the market's preference for shorter, flexible bookings.
- A strong majority (75.9%) of the Dar es-Salaam Airbnb data shows acceptance of very short stays (1-2 nights), indicating a dynamic, high-turnover market.
- A significant segment (16%) caters to monthly stays (30+ nights) in Dar es-Salaam, pointing to opportunities in the extended-stay market.
Recommendations
- Align with the market by considering a 1 Night minimum stay, as 64% of Dar es-Salaam hosts use this setting.
- Explore offering discounts for stays of 30+ nights to attract the 16% of the market seeking extended stays.
- Adjust minimum nights based on seasonality – potentially shorter during low season and longer during peak demand periods in Dar es-Salaam.
Dar es-Salaam Airbnb Cancellation Policy Trends Analysis (2026)
Limited
3 listings
0.4% of total
Super Strict 30 Days
1 listings
0.1% of total
Flexible
467 listings
61.1% of total
Moderate
129 listings
16.9% of total
Firm
128 listings
16.8% of total
Strict
36 listings
4.7% of total
Cancellation Policy Insights for Dar es-Salaam
- The prevailing Airbnb cancellation policy trend in Dar es-Salaam is Flexible, used by 61.1% of listings.
- The market strongly favors guest-friendly terms, with 78.0% of listings offering Flexible or Moderate policies. This suggests guests in Dar es-Salaam may expect booking flexibility.
- Strict cancellation policies are quite rare (4.7%), potentially making listings with this policy less competitive unless justified by high demand or property type.
Recommendations for Hosts
- Consider adopting a Flexible policy to align with the 61.1% market standard in Dar es-Salaam.
- Given the high prevalence of Flexible policies (61.1%), offering this can enhance booking appeal, especially during shoulder seasons.
- Using a Strict policy might deter some guests, as only 4.7% of listings use it. Evaluate if potential revenue protection outweighs possible lower booking rates.
- Regularly review your cancellation policy against competitors and market demand shifts in Dar es-Salaam.
Dar es-Salaam STR Booking Lead Time Analysis (2026)
Average Booking Lead Time by Month
Booking Lead Time Insights for Dar es-Salaam
- The overall average booking lead time for vacation rentals in Dar es-Salaam is 19 days.
- Guests book furthest in advance for stays during July (average 29 days), likely coinciding with peak travel demand or local events.
- The shortest booking windows occur for stays in March (average 10 days), indicating more last-minute travel plans during this time.
- Seasonally, Summer (26 days avg.) sees the longest lead times, while Spring (14 days avg.) has the shortest, reflecting typical travel planning cycles.
Recommendations for Hosts
- Use the overall average lead time (19 days) as a baseline for your pricing and availability strategy in Dar es-Salaam.
- During March, focus on last-minute booking availability and promotions, as guests book with very short notice (10 days avg.).
- Target marketing efforts for the Summer season well in advance (at least 26 days) to capture early planners.
- Monitor your own booking lead times against these Dar es-Salaam averages to identify opportunities for dynamic pricing adjustments.
Popular & Essential Airbnb Amenities in Dar es-Salaam (2026)
Amenity Prevalence
Amenity Insights for Dar es-Salaam
- Essential amenities in Dar es-Salaam that guests expect include: Wifi. Lacking these (this) could significantly impact bookings.
- Popular amenities like Free parking on premises, Kitchen, Air conditioning are common but not universal. Offering these can provide a competitive edge.
Recommendations for Hosts
- Ensure your listing includes all essential amenities for Dar es-Salaam: Wifi.
- Prioritize adding missing essentials: Wifi.
- Consider adding popular differentiators like Free parking on premises or Kitchen to increase appeal.
- Highlight unique or less common amenities you offer (e.g., hot tub, dedicated workspace, EV charger) in your listing description and photos.
- Regularly check competitor amenities in Dar es-Salaam to stay competitive.
Dar es-Salaam Airbnb Guest Demographics & Profile Analysis (2026)
Guest Profile Summary for Dar es-Salaam
- The typical guest profile for Airbnb in Dar es-Salaam consists of predominantly international visitors (86%), with top international origins including Tanzania, typically belonging to the Post-2000s (Gen Z/Alpha) group (50%), primarily speaking English or Swahili.
- Domestic travelers account for 13.9% of guests.
- Key international markets include United States (20%) and Tanzania (13.9%).
- Top languages spoken are English (48.2%) followed by Swahili (12%).
- A significant demographic segment is the Post-2000s (Gen Z/Alpha) group, representing 50% of guests.
Recommendations for Hosts
- Focus marketing internationally, particularly towards travelers from Tanzania.
- Tailor amenities and listing descriptions to appeal to the dominant Post-2000s (Gen Z/Alpha) demographic (e.g., highlight fast WiFi, smart home features, local guides).
- Highlight unique local experiences or amenities relevant to the primary guest profile.
- Consider seasonal promotions aligned with peak travel times for key origin markets.
Nearby Short-Term Rental Market Comparison
How does the Dar es-Salaam Airbnb market stack up against its neighbors? Compare key performance metrics like average monthly revenue, ADR, and occupancy rates in surrounding areas to understand the broader regional STR landscape.
| Market | Active Properties | Monthly Revenue | Daily Rate | Avg. Occupancy |
|---|---|---|---|---|
| Dongwe | 26 | $3,034 | $269.05 | 44% |
| Bwejuu | 45 | $2,252 | $239.42 | 39% |
| Matemwe | 22 | $2,061 | $230.11 | 29% |
| Kigomane | 21 | $1,967 | $186.76 | 36% |
| Bweleo | 14 | $1,926 | $302.10 | 27% |
| Kiwengwa | 101 | $1,377 | $177.91 | 32% |
| Jambiani | 231 | $1,335 | $134.98 | 36% |
| Pingwe | 21 | $1,184 | $208.15 | 22% |
| Fumba | 28 | $819 | $109.34 | 31% |
| Zanzibar | 93 | $735 | $107.50 | 31% |