Huskvarna Airbnb Market Analysis 2026: Short Term Rental Data & Vacation Rental Statistics in Jönköping County, Sweden
Is Airbnb profitable in Huskvarna in 2026? Explore comprehensive Airbnb analytics for Huskvarna, Jönköping County, Sweden to uncover income potential. This 2026 STR market report for Huskvarna, based on AirROI data from February 2025 to January 2026, reveals key trends in the niche market of 46 active listings.
Whether you're considering an Airbnb investment in Huskvarna, optimizing your existing vacation rental, or exploring rental arbitrage opportunities, understanding the Huskvarna Airbnb data is crucial. Leveraging the low regulation environment is key to maximizing your short term rental income potential. Let's dive into the specifics.
Key Huskvarna Airbnb Performance Metrics Overview
Monthly Airbnb Revenue Variations & Income Potential in Huskvarna (2026)
Understanding the monthly revenue variations for Airbnb listings in Huskvarna is key to maximizing your short term rental income potential. Seasonality significantly impacts earnings. Our analysis, based on data from the past 12 months, shows that the peak revenue month for STRs in Huskvarna is typically July, while February often presents the lowest earnings, highlighting opportunities for strategic pricing adjustments during shoulder and low seasons. Explore the typical Airbnb income in Huskvarna across different performance tiers:
- Best-in-class properties (Top 10%) achieve $5,752+ monthly, often utilizing dynamic pricing and superior guest experiences.
- Strong performing properties (Top 25%) earn $2,735 or more, indicating effective management and desirable locations/amenities.
- Typical properties (Median) generate around $1,357 per month, representing the average market performance.
- Entry-level properties (Bottom 25%) see earnings around $642, often with potential for optimization.
Average Monthly Airbnb Earnings Trend in Huskvarna
Huskvarna Airbnb Occupancy Rate Trends (2026)
Maximize your bookings by understanding the Huskvarna STR occupancy trends. Seasonal demand shifts significantly influence how often properties are booked. Typically, Julysees the highest demand (peak season occupancy), while January experiences the lowest (low season). Effective strategies, like adjusting minimum stays or offering promotions, can boost occupancy during slower periods. Here's how different property tiers perform in Huskvarna:
- Best-in-class properties (Top 10%) achieve 71%+ occupancy, indicating high desirability and potentially optimized availability.
- Strong performing properties (Top 25%) maintain 54% or higher occupancy, suggesting good market fit and guest satisfaction.
- Typical properties (Median) have an occupancy rate around 31%.
- Entry-level properties (Bottom 25%) average 14% occupancy, potentially facing higher vacancy.
Average Monthly Occupancy Rate Trend in Huskvarna
Average Daily Rate (ADR) Airbnb Trends in Huskvarna (2026)
Effective short term rental pricing strategy in Huskvarna involves understanding monthly ADR fluctuations. The Average Daily Rate (ADR) for Airbnb in Huskvarna typically peaks in September and dips lowest during March. Leveraging Airbnb dynamic pricing tools or strategies based on this seasonality can significantly boost revenue. Here's a look at the typical nightly rates achieved:
- Best-in-class properties (Top 10%) command rates of $436+ per night, often due to premium features or locations.
- Strong performing properties (Top 25%) achieve nightly rates of $296 or more.
- Typical properties (Median) charge around $110 per night.
- Entry-level properties (Bottom 25%) earn around $81 per night.
Average Daily Rate (ADR) Trend by Month in Huskvarna
Get Live Huskvarna Market Intelligence 👇

Explore Real-time Analytics
Airbnb Seasonality Analysis & Trends in Huskvarna (2026)
Peak Season (July, June, August)
- Revenue averages $3,037 per month
- Occupancy rates average 46.8%
- Daily rates average $197
Shoulder Season
- Revenue averages $2,214 per month
- Occupancy maintains around 35.2%
- Daily rates hold near $194
Low Season (January, February, December)
- Revenue drops to average $1,287 per month
- Occupancy decreases to average 25.6%
- Daily rates adjust to average $194
Seasonality Insights for Huskvarna
- The Airbnb seasonality in Huskvarna shows highly seasonal trends requiring careful strategy. While the sections above show seasonal averages, it's also insightful to look at the extremes:
- During the high season, the absolute peak month showcases Huskvarna's highest earning potential, with monthly revenues capable of climbing to $3,327, occupancy reaching a high of 53.2%, and ADRs peaking at $210.
- Conversely, the slowest single month of the year, typically falling within the low season, marks the market's lowest point. In this month, revenue might dip to $1,068, occupancy could drop to 22.6%, and ADRs may adjust down to $177.
- Understanding both the seasonal averages and these monthly peaks and troughs in revenue, occupancy, and ADR is crucial for maximizing your Airbnb profit potential in Huskvarna.
Seasonal Strategies for Maximizing Profit
- Peak Season: Maximize revenue through premium pricing and potentially longer minimum stays. Ensure high availability.
- Low Season: Offer competitive pricing, special promotions (e.g., extended stay discounts), and flexible cancellation policies. Target off-season travelers like remote workers or budget-conscious guests.
- Shoulder Seasons: Implement dynamic pricing that balances peak and low rates. Target weekend travelers or specific events. Offer slightly more flexible terms than peak season.
- Regularly analyze your own performance against these Huskvarna seasonality benchmarks and adjust your pricing and availability strategy accordingly.
Best Areas for Airbnb Investment in Huskvarna (2026)
Exploring the top neighborhoods for short-term rentals in Huskvarna? This section highlights key areas, outlining why they are attractive for hosts and guests, along with notable local attractions. Consider these locations based on your target guest profile and investment strategy.
| Neighborhood / Area | Why Host Here? (Target Guests & Appeal) | Key Attractions & Landmarks |
|---|---|---|
| Central Huskvarna | The heart of Huskvarna, offering easy access to local amenities, restaurants, and the beautiful shores of Lake Vättern. A popular area for both tourists and business travelers. | Huskvarna Factory Museum, Vätterstranden Beach, Huskvarna Church, Huskvarna Park, Café Smedjan |
| Norrängen | A family-friendly neighborhood known for its parks and recreational areas. Ideal for those looking to host families and groups wanting to enjoy a peaceful environment. | Norrängen Park, The Vättern Shore, Local playgrounds, Huskvarna Golf Club |
| Väster | A vibrant suburb with a mix of residential and commercial properties, perfect for those wanting to host business travelers and visitors to local events. | Kullingsberg Castle, Local shops and cafes, Cultural events at the nearby community center |
| Skärstad | A charming rural area just outside Huskvarna, appealing for nature lovers and those looking for a tranquil getaway close to the city. | Wildlife spotting, Nature trails, Cultural experiences in nearby villages |
| Husqvarna AB Headquarters | The site of the famous Husqvarna manufacturing company, drawing business visitors and enthusiasts interested in the brand's history. | Husqvarna Visitor Center, Factory tours |
| Jönköping city center | Nearby urban center just a short drive away, offering a bustling atmosphere with numerous shopping, dining, and entertainment options. | Jönköping County Museum, Match Museum, Jönköping’s waterfront |
| Gränna | A picturesque town known for its candy industry and beautiful views over Lake Vättern, popular among tourists all year round. | Gränna Museum, Visingsö Island, Candy shops |
| Huskvarna Strand | A scenic area along the lake with opportunities for water activities and outdoor recreation, attractive for visitors seeking a lakeside retreat. | Beach areas, Boating and fishing activities, Picnic spots along the shoreline |
Understanding Airbnb License Requirements & STR Laws in Huskvarna (2026)
While Huskvarna, Jönköping County, Sweden currently shows low STR regulations, specific Airbnb license requirements might still exist or change. Always verify the latest short term rental regulations and Airbnb license requirements directly with local government authorities for Huskvarna to ensure full compliance before hosting.
(Source: AirROI data, 2026, finding no licensed listings among those analyzed)
Top Performing Airbnb Properties in Huskvarna (2026)
Benchmark your potential! Explore examples of top-performing Airbnb properties in Huskvarnabased on Trailing Twelve Month (TTM) revenue. Analyze their characteristics, revenue, occupancy rate, and ADR to understand what drives success in this market.
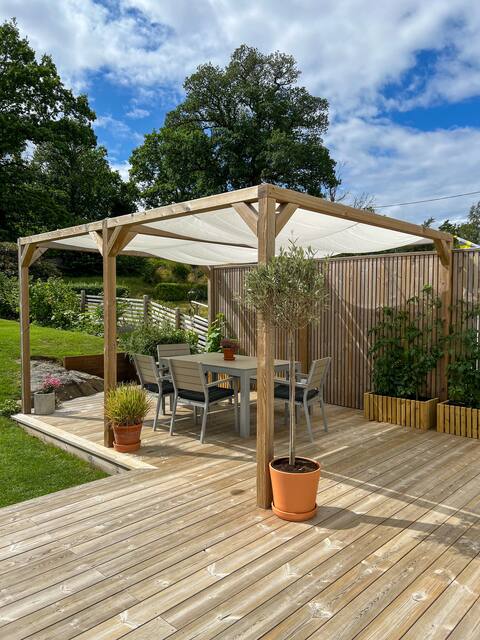
Nice townhouse in Huskvarna
Entire Place • 4 bedrooms

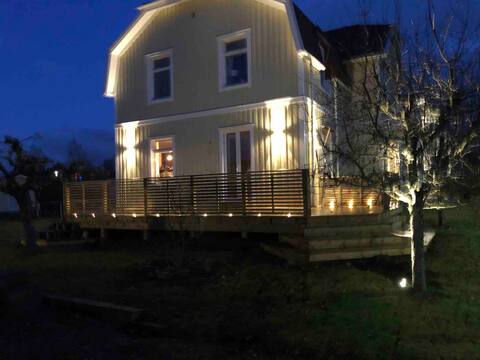
Family villa in Huskvarna, Sweden
Entire Place • 5 bedrooms
Jönköping elmia
Entire Place • 5 bedrooms
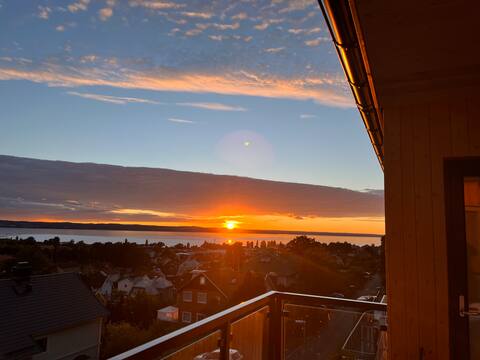
The views in Huskvarna
Entire Place • 5 bedrooms

Villa View Wifi Garden Balcony Trampoline Home Theater
Entire Place • 5 bedrooms

Villa Frylund 4 bedrooms 4 beds 6 guests
Entire Place • 4 bedrooms
Note: Performance varies based on location, size, amenities, seasonality, and management quality. Data reflects the past 12 months.
Top Performing Airbnb Hosts in Huskvarna (2026)
Learn from the best! This table showcases top-performing Airbnb hosts in Huskvarna based on the number of properties managed and estimated total revenue over the past year. Analyze their scale and performance metrics.
| Host Name | Properties | Grossing Revenue | Stay Reviews | Avg Rating |
|---|---|---|---|---|
| Jim | 2 | $86,988 | 189 | 4.92/5.0 |
| Jonathan | 1 | $81,169 | 21 | 5.00/5.0 |
| Eric | 1 | $63,506 | 24 | 4.92/5.0 |
| Kristian | 2 | $63,194 | 6 | 5.00/5.0 |
| Erika | 1 | $49,709 | 20 | 4.90/5.0 |
| Kim | 1 | $47,798 | 20 | 5.00/5.0 |
| Jenny Elisabeth | 1 | $45,904 | 7 | 5.00/5.0 |
| Helene | 1 | $30,719 | 5 | 4.40/5.0 |
| Malin | 2 | $25,123 | 58 | 4.65/5.0 |
| Andreas | 2 | $24,671 | 34 | 4.91/5.0 |
Analyzing the strategies of top hosts, such as their property selection, pricing, and guest communication, can offer valuable lessons for optimizing your own Airbnb operations in Huskvarna.
Dive Deeper: Advanced Huskvarna STR Market Data (2026)
Ready to unlock more insights? AirROI provides access to advanced metrics and comprehensive Airbnb data for Huskvarna. Explore detailed analytics beyond this report to refine your investment strategy, optimize pricing, and maximize your vacation rental profits.
Explore Advanced MetricsHuskvarna Short-Term Rental Market Composition (2026): Property & Room Types
Room Type Distribution
Property Type Distribution
Market Composition Insights for Huskvarna
- The Huskvarna Airbnb market composition is heavily skewed towards Entire Home/Apt listings, which make up 89.1% of the 46 active rentals. This indicates strong guest preference for privacy and space.
- Looking at the property type distribution in Huskvarna, House properties are the most common (50%), reflecting the local real estate landscape.
- Houses represent a significant 50% portion, catering likely to families or larger groups.
- Smaller segments like hotel/boutique (combined 2.2%) offer potential for unique stay experiences.
Huskvarna Airbnb Room Capacity Analysis (2026): Bedroom Distribution
Distribution of Listings by Number of Bedrooms
Room Capacity Insights for Huskvarna
- The dominant room capacity in Huskvarna is 1 bedroom listings, making up 34.8% of the market. This suggests a strong demand for properties suitable for couples or solo travelers.
- Together, 1 bedroom and 2 bedrooms properties represent 58.7% of the active Airbnb listings in Huskvarna, indicating a high concentration in these sizes.
- A significant 34.8% of listings offer 3+ bedrooms, catering to larger groups and families seeking more space in Huskvarna.
Huskvarna Vacation Rental Guest Capacity Trends (2026)
Distribution of Listings by Guest Capacity
Guest Capacity Insights for Huskvarna
- The most common guest capacity trend in Huskvarna vacation rentals is listings accommodating 4 guests (19.6%). This suggests the primary traveler segment is likely small families or groups.
- Properties designed for 4 guests and 8+ guests dominate the Huskvarna STR market, accounting for 37.0% of listings.
- 32.6% of properties accommodate 6+ guests, serving the market segment for larger families or group travel in Huskvarna.
- On average, properties in Huskvarna are equipped to host 4.3 guests.
Huskvarna Airbnb Booking Patterns (2026): Available vs. Booked Days
Available Days Distribution
Booked Days Distribution
Booking Pattern Insights for Huskvarna
- The most common availability pattern in Huskvarna falls within the 271-366 days range, representing 60.9% of listings. This suggests many properties have significant open periods on their calendars.
- Approximately 91.3% of listings show high availability (181+ days open annually), indicating potential for increased bookings or specific owner usage patterns.
- For booked days, the 31-90 days range is most frequent in Huskvarna (47.8%), reflecting common guest stay durations or potential owner blocking patterns.
- A notable 8.7% of properties secure long booking periods (181+ days booked per year), highlighting successful long-term rental strategies or significant owner usage.
Huskvarna Airbnb Minimum Stay Requirements Analysis
Distribution of Listings by Minimum Night Requirement
1 Night
12 listings
26.1% of total
2 Nights
9 listings
19.6% of total
3 Nights
1 listings
2.2% of total
4-6 Nights
8 listings
17.4% of total
7-29 Nights
1 listings
2.2% of total
30+ Nights
15 listings
32.6% of total
Key Insights
- The most prevalent minimum stay requirement in Huskvarna is 30+ Nights, adopted by 32.6% of listings. This highlights the market's preference for longer commitments.
- A significant segment (32.6%) caters to monthly stays (30+ nights) in Huskvarna, pointing to opportunities in the extended-stay market.
Recommendations
- Align with the market by considering a 30+ Nights minimum stay, as 32.6% of Huskvarna hosts use this setting.
- If feasible, allowing 1-night stays, especially midweek or during low season, could capture last-minute bookings, as only 26.1% currently do.
- Explore offering discounts for stays of 30+ nights to attract the 32.6% of the market seeking extended stays.
- Adjust minimum nights based on seasonality – potentially shorter during low season and longer during peak demand periods in Huskvarna.
Huskvarna Airbnb Cancellation Policy Trends Analysis (2026)
Flexible
20 listings
43.5% of total
Moderate
17 listings
37% of total
Firm
9 listings
19.6% of total
Cancellation Policy Insights for Huskvarna
- The prevailing Airbnb cancellation policy trend in Huskvarna is Flexible, used by 43.5% of listings.
- The market strongly favors guest-friendly terms, with 80.5% of listings offering Flexible or Moderate policies. This suggests guests in Huskvarna may expect booking flexibility.
Recommendations for Hosts
- Consider adopting a Flexible policy to align with the 43.5% market standard in Huskvarna.
- Regularly review your cancellation policy against competitors and market demand shifts in Huskvarna.
Huskvarna STR Booking Lead Time Analysis (2026)
Average Booking Lead Time by Month
Booking Lead Time Insights for Huskvarna
- The overall average booking lead time for vacation rentals in Huskvarna is 61 days.
- Guests book furthest in advance for stays during July (average 93 days), likely coinciding with peak travel demand or local events.
- The shortest booking windows occur for stays in December (average 29 days), indicating more last-minute travel plans during this time.
- Seasonally, Summer (65 days avg.) sees the longest lead times, while Fall (36 days avg.) has the shortest, reflecting typical travel planning cycles.
Recommendations for Hosts
- Use the overall average lead time (61 days) as a baseline for your pricing and availability strategy in Huskvarna.
- For July stays, consider implementing length-of-stay discounts or slightly higher rates for bookings made less than 93 days out to capitalize on advance planning.
- Target marketing efforts for the Summer season well in advance (at least 65 days) to capture early planners.
- Monitor your own booking lead times against these Huskvarna averages to identify opportunities for dynamic pricing adjustments.
Popular & Essential Airbnb Amenities in Huskvarna (2026)
Amenity Prevalence
Amenity Insights for Huskvarna
- Essential amenities in Huskvarna that guests expect include: Smoke alarm, Wifi. Lacking these (any) could significantly impact bookings.
- Popular amenities like Free parking on premises, Heating, Bed linens are common but not universal. Offering these can provide a competitive edge.
Recommendations for Hosts
- Ensure your listing includes all essential amenities for Huskvarna: Smoke alarm, Wifi.
- Prioritize adding missing essentials: Wifi.
- Consider adding popular differentiators like Free parking on premises or Heating to increase appeal.
- Highlight unique or less common amenities you offer (e.g., hot tub, dedicated workspace, EV charger) in your listing description and photos.
- Regularly check competitor amenities in Huskvarna to stay competitive.
Huskvarna Airbnb Guest Demographics & Profile Analysis (2026)
Guest Profile Summary for Huskvarna
- The typical guest profile for Airbnb in Huskvarna consists of predominantly international visitors (68%), with top international origins including Germany, typically belonging to the Post-2000s (Gen Z/Alpha) group (50%), primarily speaking English or Swedish.
- Domestic travelers account for 31.7% of guests.
- Key international markets include Sweden (31.7%) and Germany (16.5%).
- Top languages spoken are English (38.9%) followed by Swedish (13.7%).
- A significant demographic segment is the Post-2000s (Gen Z/Alpha) group, representing 50% of guests.
Recommendations for Hosts
- Focus marketing internationally, particularly towards travelers from Germany.
- Tailor amenities and listing descriptions to appeal to the dominant Post-2000s (Gen Z/Alpha) demographic (e.g., highlight fast WiFi, smart home features, local guides).
- Highlight unique local experiences or amenities relevant to the primary guest profile.
- Consider seasonal promotions aligned with peak travel times for key origin markets.
Nearby Short-Term Rental Market Comparison
How does the Huskvarna Airbnb market stack up against its neighbors? Compare key performance metrics like average monthly revenue, ADR, and occupancy rates in surrounding areas to understand the broader regional STR landscape.
| Market | Active Properties | Monthly Revenue | Daily Rate | Avg. Occupancy |
|---|---|---|---|---|
| Askersunds kommun | 26 | $2,326 | $260.02 | 42% |
| Östra Göinge kommun | 10 | $2,138 | $216.64 | 45% |
| Perstorps kommun | 13 | $2,081 | $161.55 | 48% |
| Örkelljunga | 17 | $1,963 | $305.70 | 28% |
| Hestra | 17 | $1,930 | $193.94 | 36% |
| Gnosjö kommun | 22 | $1,888 | $168.31 | 42% |
| Vittsjö | 20 | $1,636 | $188.66 | 40% |
| Karlsborgs kommun | 22 | $1,581 | $155.68 | 44% |
| Osby kommun | 35 | $1,467 | $145.20 | 42% |
| Immeln | 15 | $1,465 | $192.18 | 38% |