Vibble Airbnb Market Analysis 2025: Short Term Rental Data & Vacation Rental Statistics in Gotland County, Sweden
Is Airbnb profitable in Vibble in 2025? Explore comprehensive Airbnb analytics for Vibble, Gotland County, Sweden to uncover income potential. This 2025 STR market report for Vibble, based on AirROI data from December 2024 to November 2025, reveals key trends in the niche market of 20 active listings.
Whether you're considering an Airbnb investment in Vibble, optimizing your existing vacation rental, or exploring rental arbitrage opportunities, understanding the Vibble Airbnb data is crucial. Leveraging the low regulation environment is key to maximizing your short term rental income potential. Let's dive into the specifics.
Key Vibble Airbnb Performance Metrics Overview
Monthly Airbnb Revenue Variations & Income Potential in Vibble (2025)
Understanding the monthly revenue variations for Airbnb listings in Vibble is key to maximizing your short term rental income potential. Seasonality significantly impacts earnings. Our analysis, based on data from the past 12 months, shows that the peak revenue month for STRs in Vibble is typically July, while January often presents the lowest earnings, highlighting opportunities for strategic pricing adjustments during shoulder and low seasons. Explore the typical Airbnb income in Vibble across different performance tiers:
- Best-in-class properties (Top 10%) achieve $2,728+ monthly, often utilizing dynamic pricing and superior guest experiences.
- Strong performing properties (Top 25%) earn $2,196 or more, indicating effective management and desirable locations/amenities.
- Typical properties (Median) generate around $1,256 per month, representing the average market performance.
- Entry-level properties (Bottom 25%) see earnings around $849, often with potential for optimization.
Average Monthly Airbnb Earnings Trend in Vibble
Vibble Airbnb Occupancy Rate Trends (2025)
Maximize your bookings by understanding the Vibble STR occupancy trends. Seasonal demand shifts significantly influence how often properties are booked. Typically, Julysees the highest demand (peak season occupancy), while January experiences the lowest (low season). Effective strategies, like adjusting minimum stays or offering promotions, can boost occupancy during slower periods. Here's how different property tiers perform in Vibble:
- Best-in-class properties (Top 10%) achieve 52%+ occupancy, indicating high desirability and potentially optimized availability.
- Strong performing properties (Top 25%) maintain 45% or higher occupancy, suggesting good market fit and guest satisfaction.
- Typical properties (Median) have an occupancy rate around 28%.
- Entry-level properties (Bottom 25%) average 16% occupancy, potentially facing higher vacancy.
Average Monthly Occupancy Rate Trend in Vibble
Average Daily Rate (ADR) Airbnb Trends in Vibble (2025)
Effective short term rental pricing strategy in Vibble involves understanding monthly ADR fluctuations. The Average Daily Rate (ADR) for Airbnb in Vibble typically peaks in July and dips lowest during March. Leveraging Airbnb dynamic pricing tools or strategies based on this seasonality can significantly boost revenue. Here's a look at the typical nightly rates achieved:
- Best-in-class properties (Top 10%) command rates of $307+ per night, often due to premium features or locations.
- Strong performing properties (Top 25%) achieve nightly rates of $228 or more.
- Typical properties (Median) charge around $123 per night.
- Entry-level properties (Bottom 25%) earn around $94 per night.
Average Daily Rate (ADR) Trend by Month in Vibble
Get Live Vibble Market Intelligence 👇
Explore Real-time Analytics
Airbnb Seasonality Analysis & Trends in Vibble (2025)
Peak Season (July, June, August)
- Revenue averages $3,391 per month
- Occupancy rates average 55.2%
- Daily rates average $179
Shoulder Season
- Revenue averages $1,120 per month
- Occupancy maintains around 25.0%
- Daily rates hold near $166
Low Season (January, October, December)
- Revenue drops to average $277 per month
- Occupancy decreases to average 6.5%
- Daily rates adjust to average $167
Seasonality Insights for Vibble
- The Airbnb seasonality in Vibble shows highly seasonal trends requiring careful strategy. While the sections above show seasonal averages, it's also insightful to look at the extremes:
- During the high season, the absolute peak month showcases Vibble's highest earning potential, with monthly revenues capable of climbing to $4,573, occupancy reaching a high of 74.0%, and ADRs peaking at $187.
- Conversely, the slowest single month of the year, typically falling within the low season, marks the market's lowest point. In this month, revenue might dip to $0, occupancy could drop to 0.0%, and ADRs may adjust down to $159.
- Understanding both the seasonal averages and these monthly peaks and troughs in revenue, occupancy, and ADR is crucial for maximizing your Airbnb profit potential in Vibble.
Seasonal Strategies for Maximizing Profit
- Peak Season: Maximize revenue through premium pricing and potentially longer minimum stays. Ensure high availability.
- Low Season: Offer competitive pricing, special promotions (e.g., extended stay discounts), and flexible cancellation policies. Target off-season travelers like remote workers or budget-conscious guests.
- Shoulder Seasons: Implement dynamic pricing that balances peak and low rates. Target weekend travelers or specific events. Offer slightly more flexible terms than peak season.
- Regularly analyze your own performance against these Vibble seasonality benchmarks and adjust your pricing and availability strategy accordingly.
Best Areas for Airbnb Investment in Vibble (2025)
Exploring the top neighborhoods for short-term rentals in Vibble? This section highlights key areas, outlining why they are attractive for hosts and guests, along with notable local attractions. Consider these locations based on your target guest profile and investment strategy.
| Neighborhood / Area | Why Host Here? (Target Guests & Appeal) | Key Attractions & Landmarks |
|---|---|---|
| Visby | A UNESCO World Heritage Site known for its medieval town center and well-preserved city walls. The picturesque cobblestone streets attract tourists year-round, especially during the summer festival. | Visby Medieval Town, Gotland Museum, Botaniska Trädgården, Visby Cathedral, Hanseatic Museum, Färgeribacken |
| Fårö | An island north of Gotland known for its stunning natural landscapes and unique rock formations. Popular among nature lovers and those looking for tranquility away from city life. | Fårö Beaches, Langhammars Sea Stack, Sudersand Beach, Bodugen, Björklund, Fårö Lighthouse |
| Slite | A coastal town offering beautiful beaches and a family-friendly atmosphere. Attractive to travelers seeking sun, sand, and relaxation. | Slite Beach, Ala-Luleå Nature Reserve, Slite Marina, Kustcamp Slite, Bäste Lundle, Skälderviken |
| Lärbro | A charming small village close to nature, ideal for guests looking for rural experiences and outdoor activities such as hiking and cycling. | Lärbro Church, Havdhem Church, Stora Frö, Östersjö Center, the scenic countryside |
| Klangby | A peaceful retreat located inland, perfect for those wanting a quiet escape surrounded by nature and local wildlife. | Nature Trails, Elder Trees, Fishing Opportunities, Scenic Views, Wildlife Watching |
| Hemse | A small town with local shops and restaurants, appealing to those who want to experience daily life in Gotland while still being close to the coast. | Hemse Church, Local Markets, Gotland shopping, Nearby Beaches, Historic Sites |
| Vänge | A rural area perfect for those seeking an authentic Gotland experience with farms and open landscapes. Great for family stays or small group retreats. | Local Farm Culture, Nature Trails, Cycling Routes, Fishing Spots |
| Tofta | Known for its long, sandy beaches and vibrant beach life, Tofta is ideal for sun-seekers and families looking for summer vacations with plenty of activities available. | Tofta Beach, Beachfront Restaurants, Local Festivals, Water Sports |
Understanding Airbnb License Requirements & STR Laws in Vibble (2025)
While Vibble, Gotland County, Sweden currently shows low STR regulations, specific Airbnb license requirements might still exist or change. Always verify the latest short term rental regulations and Airbnb license requirements directly with local government authorities for Vibble to ensure full compliance before hosting.
(Source: AirROI data, 2025, finding no licensed listings among those analyzed)
Top Performing Airbnb Properties in Vibble (2025)
Benchmark your potential! Explore examples of top-performing Airbnb properties in Vibblebased on Trailing Twelve Month (TTM) revenue. Analyze their characteristics, revenue, occupancy rate, and ADR to understand what drives success in this market.
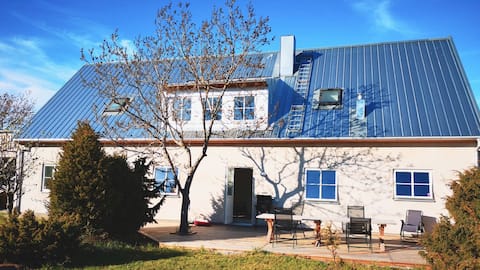
Villa apartment, 5 rooms, with private garden
Entire Place • 4 bedrooms
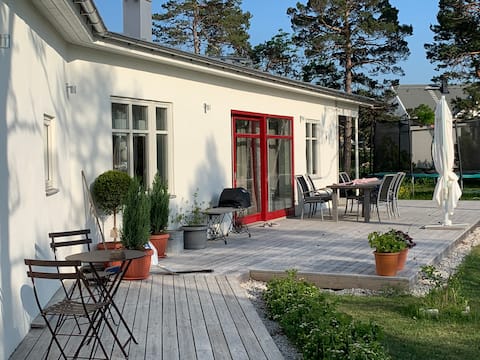
Lovely one-story villa in cozy Visby area.
Entire Place • 3 bedrooms
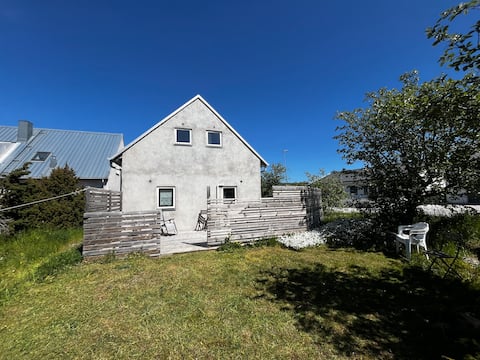
Newly built cottage, 6 rooms, close to Visby Sommarland
Entire Place • 4 bedrooms
Family-friendly villa in Vibble Summer 2025
Entire Place • 4 bedrooms

Family-friendly villa
Entire Place • 5 bedrooms
Large house at Kneippbyn 3 km south of Visby
Entire Place • 4 bedrooms
Note: Performance varies based on location, size, amenities, seasonality, and management quality. Data reflects the past 12 months.
Top Performing Airbnb Hosts in Vibble (2025)
Learn from the best! This table showcases top-performing Airbnb hosts in Vibble based on the number of properties managed and estimated total revenue over the past year. Analyze their scale and performance metrics.
| Host Name | Properties | Grossing Revenue | Stay Reviews | Avg Rating |
|---|---|---|---|---|
| Johan | 4 | $66,504 | 50 | 4.82/5.0 |
| Daniel | 2 | $28,551 | 27 | 4.76/5.0 |
| Matz | 1 | $26,794 | 20 | 4.90/5.0 |
| Caroline | 2 | $17,008 | 65 | 4.86/5.0 |
| Felix | 1 | $16,633 | 5 | 5.00/5.0 |
| Christian | 1 | $16,380 | 1 | Not Rated |
| Martin | 1 | $14,684 | 46 | 4.91/5.0 |
| Jenny | 1 | $12,584 | 22 | 4.86/5.0 |
| Tommy | 1 | $11,032 | 14 | 4.43/5.0 |
| Daniel | 1 | $10,414 | 6 | 4.67/5.0 |
Analyzing the strategies of top hosts, such as their property selection, pricing, and guest communication, can offer valuable lessons for optimizing your own Airbnb operations in Vibble.
Dive Deeper: Advanced Vibble STR Market Data (2025)
Ready to unlock more insights? AirROI provides access to advanced metrics and comprehensive Airbnb data for Vibble. Explore detailed analytics beyond this report to refine your investment strategy, optimize pricing, and maximize your vacation rental profits.
Explore Advanced MetricsVibble Short-Term Rental Market Composition (2025): Property & Room Types
Room Type Distribution
Property Type Distribution
Market Composition Insights for Vibble
- The Vibble Airbnb market composition is heavily skewed towards Entire Home/Apt listings, which make up 100% of the 20 active rentals. This indicates strong guest preference for privacy and space.
- Looking at the property type distribution in Vibble, Apartment/Condo properties are the most common (45%), reflecting the local real estate landscape.
- Houses represent a significant 40% portion, catering likely to families or larger groups.
Vibble Airbnb Room Capacity Analysis (2025): Bedroom Distribution
Distribution of Listings by Number of Bedrooms
Room Capacity Insights for Vibble
- The dominant room capacity in Vibble is 2 bedrooms listings, making up 30% of the market. This suggests a strong demand for properties suitable for couples or solo travelers.
- Together, 2 bedrooms and 4 bedrooms properties represent 55.0% of the active Airbnb listings in Vibble, indicating a high concentration in these sizes.
- A significant 40.0% of listings offer 3+ bedrooms, catering to larger groups and families seeking more space in Vibble.
Vibble Vacation Rental Guest Capacity Trends (2025)
Distribution of Listings by Guest Capacity
Guest Capacity Insights for Vibble
- The most common guest capacity trend in Vibble vacation rentals is listings accommodating 4 guests (30%). This suggests the primary traveler segment is likely small families or groups.
- Properties designed for 4 guests and 8+ guests dominate the Vibble STR market, accounting for 55.0% of listings.
- 40.0% of properties accommodate 6+ guests, serving the market segment for larger families or group travel in Vibble.
- On average, properties in Vibble are equipped to host 5.4 guests.
Vibble Airbnb Booking Patterns (2025): Available vs. Booked Days
Available Days Distribution
Booked Days Distribution
Booking Pattern Insights for Vibble
- The most common availability pattern in Vibble falls within the 271-366 days range, representing 80% of listings. This suggests many properties have significant open periods on their calendars.
- Approximately 100.0% of listings show high availability (181+ days open annually), indicating potential for increased bookings or specific owner usage patterns.
- For booked days, the 31-90 days range is most frequent in Vibble (75%), reflecting common guest stay durations or potential owner blocking patterns.
Vibble Airbnb Minimum Stay Requirements Analysis
Distribution of Listings by Minimum Night Requirement
3 Nights
1 listings
5% of total
4-6 Nights
4 listings
20% of total
7-29 Nights
3 listings
15% of total
30+ Nights
12 listings
60% of total
Key Insights
- The most prevalent minimum stay requirement in Vibble is 30+ Nights, adopted by 60% of listings. This highlights the market's preference for longer commitments.
- A significant segment (60%) caters to monthly stays (30+ nights) in Vibble, pointing to opportunities in the extended-stay market.
Recommendations
- Align with the market by considering a 30+ Nights minimum stay, as 60% of Vibble hosts use this setting.
- Explore offering discounts for stays of 30+ nights to attract the 60% of the market seeking extended stays.
- Adjust minimum nights based on seasonality – potentially shorter during low season and longer during peak demand periods in Vibble.
Vibble Airbnb Cancellation Policy Trends Analysis (2025)
Limited
1 listings
5.3% of total
Flexible
5 listings
26.3% of total
Moderate
1 listings
5.3% of total
Firm
8 listings
42.1% of total
Strict
4 listings
21.1% of total
Cancellation Policy Insights for Vibble
- The prevailing Airbnb cancellation policy trend in Vibble is Firm, used by 42.1% of listings.
- A majority (63.2%) of hosts in Vibble utilize Firm or Strict policies, indicating a market where hosts prioritize booking security.
Recommendations for Hosts
- Consider adopting a Firm policy to align with the 42.1% market standard in Vibble.
- Regularly review your cancellation policy against competitors and market demand shifts in Vibble.
Vibble STR Booking Lead Time Analysis (2025)
Average Booking Lead Time by Month
Booking Lead Time Insights for Vibble
- The overall average booking lead time for vacation rentals in Vibble is 110 days.
- Guests book furthest in advance for stays during July (average 130 days), likely coinciding with peak travel demand or local events.
- The shortest booking windows occur for stays in October (average 0 days), indicating more last-minute travel plans during this time.
- Seasonally, Spring (117 days avg.) sees the longest lead times, while Fall (14 days avg.) has the shortest, reflecting typical travel planning cycles.
Recommendations for Hosts
- Use the overall average lead time (110 days) as a baseline for your pricing and availability strategy in Vibble.
- For July stays, consider implementing length-of-stay discounts or slightly higher rates for bookings made less than 130 days out to capitalize on advance planning.
- During October, focus on last-minute booking availability and promotions, as guests book with very short notice (0 days avg.).
- Target marketing efforts for the Spring season well in advance (at least 117 days) to capture early planners.
- Monitor your own booking lead times against these Vibble averages to identify opportunities for dynamic pricing adjustments.
Popular & Essential Airbnb Amenities in Vibble (2025)
Amenity Prevalence
Amenity Insights for Vibble
- Essential amenities in Vibble that guests expect include: Free parking on premises, Wifi, Kitchen, TV, Outdoor dining area, Smoke alarm, BBQ grill, Hot water. Lacking these (any) could significantly impact bookings.
- Popular amenities like Heating, Refrigerator are common but not universal. Offering these can provide a competitive edge.
Recommendations for Hosts
- Ensure your listing includes all essential amenities for Vibble: Free parking on premises, Wifi, Kitchen, TV, Outdoor dining area, Smoke alarm, BBQ grill, Hot water.
- Prioritize adding missing essentials: Outdoor dining area, Smoke alarm, BBQ grill, Hot water.
- Consider adding popular differentiators like Heating or Refrigerator to increase appeal.
- Highlight unique or less common amenities you offer (e.g., hot tub, dedicated workspace, EV charger) in your listing description and photos.
- Regularly check competitor amenities in Vibble to stay competitive.
Vibble Airbnb Guest Demographics & Profile Analysis (2025)
Guest Profile Summary for Vibble
- The typical guest profile for Airbnb in Vibble consists of primarily domestic travelers (93%), often arriving from nearby Uppsala, typically belonging to the Post-2000s (Gen Z/Alpha) group (50%), primarily speaking English or Swedish.
- Domestic travelers account for 93.3% of guests.
- Key international markets include Sweden (93.3%) and Finland (3.3%).
- Top languages spoken are English (52.4%) followed by Swedish (47.6%).
- A significant demographic segment is the Post-2000s (Gen Z/Alpha) group, representing 50% of guests.
Recommendations for Hosts
- Target domestic marketing efforts towards travelers from Uppsala and Stockholm.
- Tailor amenities and listing descriptions to appeal to the dominant Post-2000s (Gen Z/Alpha) demographic (e.g., highlight fast WiFi, smart home features, local guides).
- Highlight unique local experiences or amenities relevant to the primary guest profile.
- Consider seasonal promotions aligned with peak travel times for key origin markets.
Nearby Short-Term Rental Market Comparison
How does the Vibble Airbnb market stack up against its neighbors? Compare key performance metrics like average monthly revenue, ADR, and occupancy rates in surrounding areas to understand the broader regional STR landscape.
| Market | Active Properties | Monthly Revenue | Daily Rate | Avg. Occupancy |
|---|---|---|---|---|
| Nynäshamns kommun | 40 | $1,773 | $245.61 | 35% |
| Trosa kommun | 41 | $1,696 | $267.75 | 31% |
| Oxelösund | 12 | $1,632 | $172.83 | 32% |
| Nyköpings kommun | 88 | $1,448 | $179.14 | 37% |
| Visby | 518 | $1,311 | $226.50 | 42% |
| Sandhamn | 30 | $1,282 | $232.28 | 36% |
| Fårösund | 12 | $1,240 | $192.89 | 35% |
| Norra Visby | 21 | $1,229 | $230.63 | 42% |
| Oxelösunds kommun | 10 | $1,100 | $156.48 | 31% |
| Gotland Municipality | 611 | $1,070 | $189.28 | 38% |