Oliva Airbnb Market Analysis 2026: Short Term Rental Data & Vacation Rental Statistics in Valencian Community, Spain
Is Airbnb profitable in Oliva in 2026? Explore comprehensive Airbnb analytics for Oliva, Valencian Community, Spain to uncover income potential. This 2026 STR market report for Oliva, based on AirROI data from February 2025 to January 2026, reveals key trends in the market of 593 active listings.
Whether you're considering an Airbnb investment in Oliva, optimizing your existing vacation rental, or exploring rental arbitrage opportunities, understanding the Oliva Airbnb data is crucial. Navigating the high regulation landscape is key to maximizing your short term rental income potential. Let's dive into the specifics.
Key Oliva Airbnb Performance Metrics Overview
Monthly Airbnb Revenue Variations & Income Potential in Oliva (2026)
Understanding the monthly revenue variations for Airbnb listings in Oliva is key to maximizing your short term rental income potential. Seasonality significantly impacts earnings. Our analysis, based on data from the past 12 months, shows that the peak revenue month for STRs in Oliva is typically August, while February often presents the lowest earnings, highlighting opportunities for strategic pricing adjustments during shoulder and low seasons. Explore the typical Airbnb income in Oliva across different performance tiers:
- Best-in-class properties (Top 10%) achieve $3,917+ monthly, often utilizing dynamic pricing and superior guest experiences.
- Strong performing properties (Top 25%) earn $2,593 or more, indicating effective management and desirable locations/amenities.
- Typical properties (Median) generate around $1,530 per month, representing the average market performance.
- Entry-level properties (Bottom 25%) see earnings around $763, often with potential for optimization.
Average Monthly Airbnb Earnings Trend in Oliva
Oliva Airbnb Occupancy Rate Trends (2026)
Maximize your bookings by understanding the Oliva STR occupancy trends. Seasonal demand shifts significantly influence how often properties are booked. Typically, Augustsees the highest demand (peak season occupancy), while January experiences the lowest (low season). Effective strategies, like adjusting minimum stays or offering promotions, can boost occupancy during slower periods. Here's how different property tiers perform in Oliva:
- Best-in-class properties (Top 10%) achieve 75%+ occupancy, indicating high desirability and potentially optimized availability.
- Strong performing properties (Top 25%) maintain 55% or higher occupancy, suggesting good market fit and guest satisfaction.
- Typical properties (Median) have an occupancy rate around 33%.
- Entry-level properties (Bottom 25%) average 17% occupancy, potentially facing higher vacancy.
Average Monthly Occupancy Rate Trend in Oliva
Average Daily Rate (ADR) Airbnb Trends in Oliva (2026)
Effective short term rental pricing strategy in Oliva involves understanding monthly ADR fluctuations. The Average Daily Rate (ADR) for Airbnb in Oliva typically peaks in August and dips lowest during March. Leveraging Airbnb dynamic pricing tools or strategies based on this seasonality can significantly boost revenue. Here's a look at the typical nightly rates achieved:
- Best-in-class properties (Top 10%) command rates of $279+ per night, often due to premium features or locations.
- Strong performing properties (Top 25%) achieve nightly rates of $203 or more.
- Typical properties (Median) charge around $141 per night.
- Entry-level properties (Bottom 25%) earn around $104 per night.
Average Daily Rate (ADR) Trend by Month in Oliva
Get Live Oliva Market Intelligence 👇

Explore Real-time Analytics
Airbnb Seasonality Analysis & Trends in Oliva (2026)
Peak Season (August, July, September)
- Revenue averages $3,449 per month
- Occupancy rates average 53.8%
- Daily rates average $189
Shoulder Season
- Revenue averages $1,547 per month
- Occupancy maintains around 34.4%
- Daily rates hold near $166
Low Season (January, February, May)
- Revenue drops to average $1,147 per month
- Occupancy decreases to average 27.7%
- Daily rates adjust to average $165
Seasonality Insights for Oliva
- The Airbnb seasonality in Oliva shows highly seasonal trends requiring careful strategy. While the sections above show seasonal averages, it's also insightful to look at the extremes:
- During the high season, the absolute peak month showcases Oliva's highest earning potential, with monthly revenues capable of climbing to $4,463, occupancy reaching a high of 64.7%, and ADRs peaking at $197.
- Conversely, the slowest single month of the year, typically falling within the low season, marks the market's lowest point. In this month, revenue might dip to $1,095, occupancy could drop to 24.1%, and ADRs may adjust down to $154.
- Understanding both the seasonal averages and these monthly peaks and troughs in revenue, occupancy, and ADR is crucial for maximizing your Airbnb profit potential in Oliva.
Seasonal Strategies for Maximizing Profit
- Peak Season: Maximize revenue through premium pricing and potentially longer minimum stays. Ensure high availability.
- Low Season: Offer competitive pricing, special promotions (e.g., extended stay discounts), and flexible cancellation policies. Target off-season travelers like remote workers or budget-conscious guests.
- Shoulder Seasons: Implement dynamic pricing that balances peak and low rates. Target weekend travelers or specific events. Offer slightly more flexible terms than peak season.
- Regularly analyze your own performance against these Oliva seasonality benchmarks and adjust your pricing and availability strategy accordingly.
Best Areas for Airbnb Investment in Oliva (2026)
Exploring the top neighborhoods for short-term rentals in Oliva? This section highlights key areas, outlining why they are attractive for hosts and guests, along with notable local attractions. Consider these locations based on your target guest profile and investment strategy.
| Neighborhood / Area | Why Host Here? (Target Guests & Appeal) | Key Attractions & Landmarks |
|---|---|---|
| Oliva Nova Beach | Beautiful and well-maintained tourist destination with spacious beaches and golf courses. Attracts families and sun-seekers looking for leisure activities and relaxation. | Oliva Nova Golf, Oliva Nova Beach, Concha Beach, Centro Comercial Oliva Nova, Water Sports Center |
| Oliva Old Town | Rich in history and charm, this area provides a more cultural and authentic experience for visitors. Known for its historical architecture and local markets. | Oliva Castle, Plaza de la Iglesia, Parroquia de Santa María la Mayor, Museu Escolar de Llampuga, Mercado Municipal |
| Playa de Aigua Blanca | A quieter and more secluded beach area ideal for romantic getaways and nature lovers. Perfect for those looking for tranquility and natural beauty. | Aigua Blanca Beach, Cabo de San Antonio, Muntanya de la Sella, Natural Park of La Marjal |
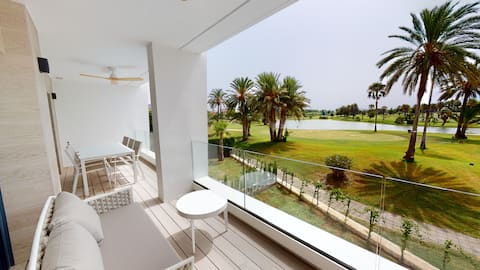
| La Sella Golf | A premier golf course region attracting golf enthusiasts and vacationers seeking a mix of sport and relaxation in a beautiful natural setting. | La Sella Golf Course, La Sella Golf Club, Local vineyards and wineries, Hiking trails |
| Santa Anna Beach | A popular family-friendly beach with amenities that cater to children and recreational activities. Convenient for families traveling with kids. | Santa Anna Beach, Nearby restaurants and cafes, Water parks, Family activities |
| Carrer de la Mar | A lively street lined with shops and restaurants, ideal for those who want to experience local cuisine and culture. Great for urban tourists. | Local restaurants, Boutique shops, Weekly markets, Cafes |
| Font Salada | Known for its natural thermal springs and mud baths, attracting wellness tourism and visitors looking for relaxation and health remedies. | Thermal Springs, Mud Baths, Nature walks, Scenic views |
| Pego-Oliva Marsh | A stunning natural reserve that offers unique wildlife and natural beauty. Great for outdoor enthusiasts and eco-tourists. | Nature trails, Birdwatching, Biking paths, Local flora and fauna |
Understanding Airbnb License Requirements & STR Laws in Oliva (2026)
Yes, Oliva, Valencian Community, Spain enforces high STR regulations. Obtaining a license and ensuring compliance is almost certainly required according to current 2026 STR laws. Always verify the latest short term rental regulations and Airbnb license requirements directly with local government authorities for Oliva to ensure full compliance before hosting.
(Source: AirROI data, 2026, based on 63% licensed listings)
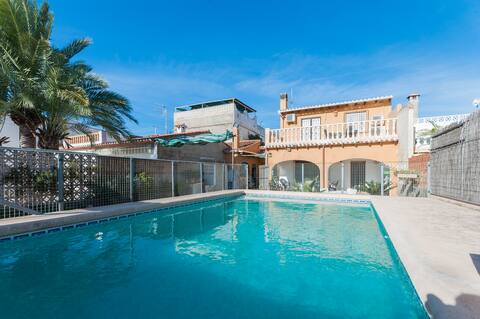
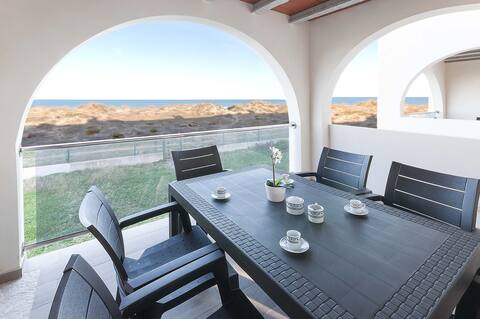
Top Performing Airbnb Properties in Oliva (2026)
Benchmark your potential! Explore examples of top-performing Airbnb properties in Olivabased on Trailing Twelve Month (TTM) revenue. Analyze their characteristics, revenue, occupancy rate, and ADR to understand what drives success in this market.
Amatista
Entire Place • 4 bedrooms

Villa Beachside Retreat by On Travel
Entire Place • 4 bedrooms
La Mar De Olas
Entire Place • 2 bedrooms
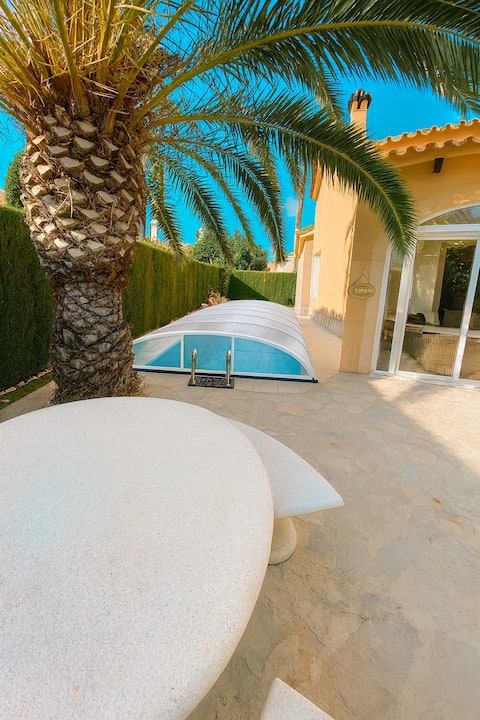
Impressive villa with heated pool
Entire Place • 2 bedrooms
The Rooftop Los Lagos by On Travel
Entire Place • 3 bedrooms

First line with ocean views
Entire Place • 2 bedrooms
Note: Performance varies based on location, size, amenities, seasonality, and management quality. Data reflects the past 12 months.
Top Performing Airbnb Hosts in Oliva (2026)
Learn from the best! This table showcases top-performing Airbnb hosts in Oliva based on the number of properties managed and estimated total revenue over the past year. Analyze their scale and performance metrics.
| Host Name | Properties | Grossing Revenue | Stay Reviews | Avg Rating |
|---|---|---|---|---|
| Oliva Nova Turismo | 92 | $1,628,017 | 249 | 4.67/5.0 |
| Homerti | 8 | $305,947 | 42 | 4.09/5.0 |
| Anacasa | 23 | $251,295 | 65 | 4.34/5.0 |
| Oliva | 16 | $228,539 | 193 | 4.79/5.0 |
| Ximo | 6 | $215,290 | 186 | 4.97/5.0 |
| Isidro | 13 | $200,366 | 333 | 4.59/5.0 |
| Victor | 7 | $172,368 | 39 | 4.65/5.0 |
| Alex - Interhome | 8 | $123,794 | 26 | 4.16/5.0 |
| Salvador | 2 | $96,869 | 64 | 4.92/5.0 |
| Ana | 3 | $81,295 | 119 | 4.89/5.0 |
Analyzing the strategies of top hosts, such as their property selection, pricing, and guest communication, can offer valuable lessons for optimizing your own Airbnb operations in Oliva.
Dive Deeper: Advanced Oliva STR Market Data (2026)
Ready to unlock more insights? AirROI provides access to advanced metrics and comprehensive Airbnb data for Oliva. Explore detailed analytics beyond this report to refine your investment strategy, optimize pricing, and maximize your vacation rental profits.
Explore Advanced MetricsOliva Short-Term Rental Market Composition (2026): Property & Room Types
Room Type Distribution
Property Type Distribution
Market Composition Insights for Oliva
- The Oliva Airbnb market composition is heavily skewed towards Entire Home/Apt listings, which make up 99% of the 593 active rentals. This indicates strong guest preference for privacy and space.
- Looking at the property type distribution in Oliva, Apartment/Condo properties are the most common (64.6%), reflecting the local real estate landscape.
- Houses represent a significant 33.9% portion, catering likely to families or larger groups.
- Smaller segments like hotel/boutique, others, outdoor/unique (combined 1.4%) offer potential for unique stay experiences.
Oliva Airbnb Room Capacity Analysis (2026): Bedroom Distribution
Distribution of Listings by Number of Bedrooms
Room Capacity Insights for Oliva
- The dominant room capacity in Oliva is 2 bedrooms listings, making up 45.4% of the market. This suggests a strong demand for properties suitable for couples or solo travelers.
- Together, 2 bedrooms and 3 bedrooms properties represent 77.4% of the active Airbnb listings in Oliva, indicating a high concentration in these sizes.
- A significant 40.1% of listings offer 3+ bedrooms, catering to larger groups and families seeking more space in Oliva.
Oliva Vacation Rental Guest Capacity Trends (2026)
Distribution of Listings by Guest Capacity
Guest Capacity Insights for Oliva
- The most common guest capacity trend in Oliva vacation rentals is listings accommodating 4 guests (36.8%). This suggests the primary traveler segment is likely small families or groups.
- Properties designed for 4 guests and 6 guests dominate the Oliva STR market, accounting for 64.6% of listings.
- 40.9% of properties accommodate 6+ guests, serving the market segment for larger families or group travel in Oliva.
- On average, properties in Oliva are equipped to host 5.0 guests.
Oliva Airbnb Booking Patterns (2026): Available vs. Booked Days
Available Days Distribution
Booked Days Distribution
Booking Pattern Insights for Oliva
- The most common availability pattern in Oliva falls within the 271-366 days range, representing 66.1% of listings. This suggests many properties have significant open periods on their calendars.
- Approximately 92.1% of listings show high availability (181+ days open annually), indicating potential for increased bookings or specific owner usage patterns.
- For booked days, the 31-90 days range is most frequent in Oliva (37.9%), reflecting common guest stay durations or potential owner blocking patterns.
- A notable 8.1% of properties secure long booking periods (181+ days booked per year), highlighting successful long-term rental strategies or significant owner usage.
Oliva Airbnb Minimum Stay Requirements Analysis
Distribution of Listings by Minimum Night Requirement
1 Night
16 listings
2.7% of total
2 Nights
30 listings
5.1% of total
3 Nights
31 listings
5.2% of total
4-6 Nights
163 listings
27.5% of total
7-29 Nights
78 listings
13.2% of total
30+ Nights
275 listings
46.4% of total
Key Insights
- The most prevalent minimum stay requirement in Oliva is 30+ Nights, adopted by 46.4% of listings. This highlights the market's preference for longer commitments.
- Very short stays (1-2 nights) are less common (7.8%), suggesting hosts prefer slightly longer bookings to optimize turnover.
- A significant segment (46.4%) caters to monthly stays (30+ nights) in Oliva, pointing to opportunities in the extended-stay market.
Recommendations
- Align with the market by considering a 30+ Nights minimum stay, as 46.4% of Oliva hosts use this setting.
- If feasible, allowing 1-night stays, especially midweek or during low season, could capture last-minute bookings, as only 2.7% currently do.
- Explore offering discounts for stays of 30+ nights to attract the 46.4% of the market seeking extended stays.
- Adjust minimum nights based on seasonality – potentially shorter during low season and longer during peak demand periods in Oliva.
Oliva Airbnb Cancellation Policy Trends Analysis (2026)
Super Strict 30 Days
16 listings
2.7% of total
Super Strict 60 Days
21 listings
3.6% of total
Flexible
58 listings
9.9% of total
Moderate
186 listings
31.8% of total
Firm
213 listings
36.5% of total
Strict
90 listings
15.4% of total
Cancellation Policy Insights for Oliva
- The prevailing Airbnb cancellation policy trend in Oliva is Firm, used by 36.5% of listings.
- A majority (51.9%) of hosts in Oliva utilize Firm or Strict policies, indicating a market where hosts prioritize booking security.
Recommendations for Hosts
- Consider adopting a Firm policy to align with the 36.5% market standard in Oliva.
- Regularly review your cancellation policy against competitors and market demand shifts in Oliva.
Oliva STR Booking Lead Time Analysis (2026)
Average Booking Lead Time by Month
Booking Lead Time Insights for Oliva
- The overall average booking lead time for vacation rentals in Oliva is 62 days.
- Guests book furthest in advance for stays during August (average 111 days), likely coinciding with peak travel demand or local events.
- The shortest booking windows occur for stays in March (average 34 days), indicating more last-minute travel plans during this time.
- Seasonally, Summer (83 days avg.) sees the longest lead times, while Winter (44 days avg.) has the shortest, reflecting typical travel planning cycles.
Recommendations for Hosts
- Use the overall average lead time (62 days) as a baseline for your pricing and availability strategy in Oliva.
- For August stays, consider implementing length-of-stay discounts or slightly higher rates for bookings made less than 111 days out to capitalize on advance planning.
- Target marketing efforts for the Summer season well in advance (at least 83 days) to capture early planners.
- Monitor your own booking lead times against these Oliva averages to identify opportunities for dynamic pricing adjustments.
Popular & Essential Airbnb Amenities in Oliva (2026)
Amenity Prevalence
Amenity Insights for Oliva
- Essential amenities in Oliva that guests expect include: TV, Washer, Kitchen. Lacking these (any) could significantly impact bookings.
- Popular amenities like Air conditioning, Dishes and silverware, Refrigerator are common but not universal. Offering these can provide a competitive edge.
- Warning: Wifi is not universally provided but is considered essential globally. Ensure reliable Wifi is offered.
Recommendations for Hosts
- Ensure your listing includes all essential amenities for Oliva: TV, Washer, Kitchen.
- Prioritize adding missing essentials: TV, Washer, Kitchen.
- Consider adding popular differentiators like Air conditioning or Dishes and silverware to increase appeal.
- Highlight unique or less common amenities you offer (e.g., hot tub, dedicated workspace, EV charger) in your listing description and photos.
- Regularly check competitor amenities in Oliva to stay competitive.
Oliva Airbnb Guest Demographics & Profile Analysis (2026)
Guest Profile Summary for Oliva
- The typical guest profile for Airbnb in Oliva consists of a mix of domestic (58%) and international guests, often arriving from nearby Madrid, typically belonging to the Post-2000s (Gen Z/Alpha) group (50%), primarily speaking English or Spanish.
- Domestic travelers account for 57.5% of guests.
- Key international markets include Spain (57.5%) and France (9.1%).
- Top languages spoken are English (35.3%) followed by Spanish (29.7%).
- A significant demographic segment is the Post-2000s (Gen Z/Alpha) group, representing 50% of guests.
Recommendations for Hosts
- Balance marketing efforts between domestic and international channels based on the guest mix.
- Tailor amenities and listing descriptions to appeal to the dominant Post-2000s (Gen Z/Alpha) demographic (e.g., highlight fast WiFi, smart home features, local guides).
- Highlight unique local experiences or amenities relevant to the primary guest profile.
- Consider seasonal promotions aligned with peak travel times for key origin markets.
Nearby Short-Term Rental Market Comparison
How does the Oliva Airbnb market stack up against its neighbors? Compare key performance metrics like average monthly revenue, ADR, and occupancy rates in surrounding areas to understand the broader regional STR landscape.
| Market | Active Properties | Monthly Revenue | Daily Rate | Avg. Occupancy |
|---|---|---|---|---|
| Olocau | 10 | $3,229 | $460.93 | 36% |
| Corbera | 16 | $2,781 | $231.25 | 45% |
| Picassent | 16 | $2,618 | $274.61 | 43% |
| Macastre | 15 | $2,518 | $312.89 | 34% |
| Manises | 27 | $2,511 | $201.27 | 43% |
| l'Eliana | 32 | $2,454 | $314.51 | 40% |
| Alboraia / Alboraya | 244 | $2,297 | $201.35 | 47% |
| Catral | 14 | $2,222 | $220.78 | 40% |
| Benissa | 523 | $2,182 | $303.68 | 39% |
| Bétera | 25 | $2,155 | $264.29 | 42% |