Gandia Airbnb Market Analysis 2026: Short Term Rental Data & Vacation Rental Statistics in Valencian Community, Spain
Is Airbnb profitable in Gandia in 2026? Explore comprehensive Airbnb analytics for Gandia, Valencian Community, Spain to uncover income potential. This 2026 STR market report for Gandia, based on AirROI data from February 2025 to January 2026, reveals key trends in the market of 763 active listings.
Whether you're considering an Airbnb investment in Gandia, optimizing your existing vacation rental, or exploring rental arbitrage opportunities, understanding the Gandia Airbnb data is crucial. Navigating the high regulation landscape is key to maximizing your short term rental income potential. Let's dive into the specifics.
Key Gandia Airbnb Performance Metrics Overview
Monthly Airbnb Revenue Variations & Income Potential in Gandia (2026)
Understanding the monthly revenue variations for Airbnb listings in Gandia is key to maximizing your short term rental income potential. Seasonality significantly impacts earnings. Our analysis, based on data from the past 12 months, shows that the peak revenue month for STRs in Gandia is typically August, while January often presents the lowest earnings, highlighting opportunities for strategic pricing adjustments during shoulder and low seasons. Explore the typical Airbnb income in Gandia across different performance tiers:
- Best-in-class properties (Top 10%) achieve $3,481+ monthly, often utilizing dynamic pricing and superior guest experiences.
- Strong performing properties (Top 25%) earn $2,277 or more, indicating effective management and desirable locations/amenities.
- Typical properties (Median) generate around $1,402 per month, representing the average market performance.
- Entry-level properties (Bottom 25%) see earnings around $686, often with potential for optimization.
Average Monthly Airbnb Earnings Trend in Gandia
Gandia Airbnb Occupancy Rate Trends (2026)
Maximize your bookings by understanding the Gandia STR occupancy trends. Seasonal demand shifts significantly influence how often properties are booked. Typically, Augustsees the highest demand (peak season occupancy), while January experiences the lowest (low season). Effective strategies, like adjusting minimum stays or offering promotions, can boost occupancy during slower periods. Here's how different property tiers perform in Gandia:
- Best-in-class properties (Top 10%) achieve 75%+ occupancy, indicating high desirability and potentially optimized availability.
- Strong performing properties (Top 25%) maintain 56% or higher occupancy, suggesting good market fit and guest satisfaction.
- Typical properties (Median) have an occupancy rate around 34%.
- Entry-level properties (Bottom 25%) average 17% occupancy, potentially facing higher vacancy.
Average Monthly Occupancy Rate Trend in Gandia
Average Daily Rate (ADR) Airbnb Trends in Gandia (2026)
Effective short term rental pricing strategy in Gandia involves understanding monthly ADR fluctuations. The Average Daily Rate (ADR) for Airbnb in Gandia typically peaks in August and dips lowest during February. Leveraging Airbnb dynamic pricing tools or strategies based on this seasonality can significantly boost revenue. Here's a look at the typical nightly rates achieved:
- Best-in-class properties (Top 10%) command rates of $254+ per night, often due to premium features or locations.
- Strong performing properties (Top 25%) achieve nightly rates of $182 or more.
- Typical properties (Median) charge around $135 per night.
- Entry-level properties (Bottom 25%) earn around $100 per night.
Average Daily Rate (ADR) Trend by Month in Gandia
Get Live Gandia Market Intelligence 👇

Explore Real-time Analytics
Airbnb Seasonality Analysis & Trends in Gandia (2026)
Peak Season (August, July, June)
- Revenue averages $3,490 per month
- Occupancy rates average 53.8%
- Daily rates average $191
Shoulder Season
- Revenue averages $1,398 per month
- Occupancy maintains around 34.7%
- Daily rates hold near $155
Low Season (January, February, December)
- Revenue drops to average $950 per month
- Occupancy decreases to average 27.5%
- Daily rates adjust to average $153
Seasonality Insights for Gandia
- The Airbnb seasonality in Gandia shows highly seasonal trends requiring careful strategy. While the sections above show seasonal averages, it's also insightful to look at the extremes:
- During the high season, the absolute peak month showcases Gandia's highest earning potential, with monthly revenues capable of climbing to $4,154, occupancy reaching a high of 60.2%, and ADRs peaking at $201.
- Conversely, the slowest single month of the year, typically falling within the low season, marks the market's lowest point. In this month, revenue might dip to $873, occupancy could drop to 23.0%, and ADRs may adjust down to $143.
- Understanding both the seasonal averages and these monthly peaks and troughs in revenue, occupancy, and ADR is crucial for maximizing your Airbnb profit potential in Gandia.
Seasonal Strategies for Maximizing Profit
- Peak Season: Maximize revenue through premium pricing and potentially longer minimum stays. Ensure high availability.
- Low Season: Offer competitive pricing, special promotions (e.g., extended stay discounts), and flexible cancellation policies. Target off-season travelers like remote workers or budget-conscious guests.
- Shoulder Seasons: Implement dynamic pricing that balances peak and low rates. Target weekend travelers or specific events. Offer slightly more flexible terms than peak season.
- Regularly analyze your own performance against these Gandia seasonality benchmarks and adjust your pricing and availability strategy accordingly.
Best Areas for Airbnb Investment in Gandia (2026)
Exploring the top neighborhoods for short-term rentals in Gandia? This section highlights key areas, outlining why they are attractive for hosts and guests, along with notable local attractions. Consider these locations based on your target guest profile and investment strategy.
| Neighborhood / Area | Why Host Here? (Target Guests & Appeal) | Key Attractions & Landmarks |
|---|---|---|
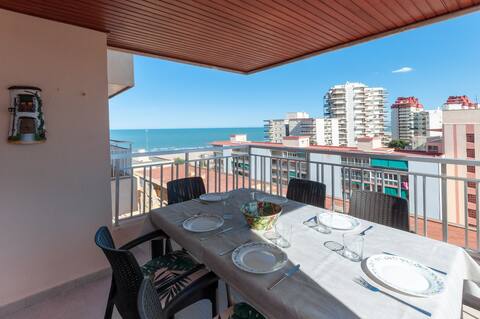
| Playa de Gandía | The most popular beach area in Gandía, known for its long stretches of sandy beaches and vibrant atmosphere. Ideal for tourists seeking sun, sea, and nightlife. | Playa de Gandía, Promenade, Water sports rentals, Beach bars, Gandía Marina |
| Gandía Historic Center | Rich in history and culture, the historic center is perfect for those interested in architecture, local cuisine, and heritage sites. Offers a more authentic Spanish experience. | Gandía Ducal Palace, Collegiate Basilica of Santa Maria, Local markets, Museo Fallero, Plaza Major |
| Gemelos | A quieter area near the beach that appeals to families and couples looking for a peaceful retreat. Often less crowded than the main tourist zones. | Gemelos beaches, Local parks, Family-friendly restaurants |
| Palau de les Arts | A cultural hotspot with theaters and art venues, attracting those interested in arts, performances, and cultural events. | Teatre Serrano, Cultural festivals, Art galleries |
| Marina de Gandía | An upscale area known for its luxury yachts and dining options, appealing to affluent tourists and offering a lifestyle experience by the water. | Gandía Yacht Club, Upscale restaurants, Maritime events |
| Cruz Roja | A residential area that offers a more local experience with proximity to the beach, ideal for longer stays and those who want to immerse themselves in everyday life. | Local grocery stores, Neighborhood cafes |
| Beniopa | A quaint suburb of Gandía that offers a more rural experience while being close to the beach, great for those seeking tranquility away from the hustle. | Local hiking trails, Nature walks |
| Los Girasoles | A family-friendly area with ample amenities and recreational options, ideal for families and large groups looking for comfort and convenience. | Playgrounds, Community centers, Local restaurants |
Understanding Airbnb License Requirements & STR Laws in Gandia (2026)
Yes, Gandia, Valencian Community, Spain enforces high STR regulations. Obtaining a license and ensuring compliance is almost certainly required according to current 2026 STR laws. Always verify the latest short term rental regulations and Airbnb license requirements directly with local government authorities for Gandia to ensure full compliance before hosting.
(Source: AirROI data, 2026, based on 61% licensed listings)
Top Performing Airbnb Properties in Gandia (2026)
Benchmark your potential! Explore examples of top-performing Airbnb properties in Gandiabased on Trailing Twelve Month (TTM) revenue. Analyze their characteristics, revenue, occupancy rate, and ADR to understand what drives success in this market.
Torres Del Mar
Entire Place • 3 bedrooms
Golden
Entire Place • 3 bedrooms
Chalet Centro I B
Entire Place • 4 bedrooms
Coll Groc
Entire Place • 4 bedrooms
Piropo
Entire Place • 4 bedrooms
Navegante
Entire Place • 3 bedrooms
Note: Performance varies based on location, size, amenities, seasonality, and management quality. Data reflects the past 12 months.
Top Performing Airbnb Hosts in Gandia (2026)
Learn from the best! This table showcases top-performing Airbnb hosts in Gandia based on the number of properties managed and estimated total revenue over the past year. Analyze their scale and performance metrics.
| Host Name | Properties | Grossing Revenue | Stay Reviews | Avg Rating |
|---|---|---|---|---|
| Gregorio Y Pablo | 92 | $1,501,350 | 1323 | 4.84/5.0 |
| Homerti | 16 | $1,036,369 | 73 | 3.77/5.0 |
| Maria Jose | 6 | $302,680 | 32 | 3.66/5.0 |
| Aina | 13 | $184,593 | 595 | 4.75/5.0 |
| Pablo | 5 | $136,398 | 115 | 4.93/5.0 |
| Monica | 8 | $105,633 | 237 | 4.34/5.0 |
| Ona Vacaciones | 5 | $103,623 | 188 | 4.80/5.0 |
| Gonzalo | 1 | $94,181 | 68 | 4.51/5.0 |
| Maite | 3 | $86,960 | 233 | 4.95/5.0 |
| Sara | 2 | $80,778 | 150 | 4.90/5.0 |
Analyzing the strategies of top hosts, such as their property selection, pricing, and guest communication, can offer valuable lessons for optimizing your own Airbnb operations in Gandia.
Dive Deeper: Advanced Gandia STR Market Data (2026)
Ready to unlock more insights? AirROI provides access to advanced metrics and comprehensive Airbnb data for Gandia. Explore detailed analytics beyond this report to refine your investment strategy, optimize pricing, and maximize your vacation rental profits.
Explore Advanced MetricsGandia Short-Term Rental Market Composition (2026): Property & Room Types
Room Type Distribution
Property Type Distribution
Market Composition Insights for Gandia
- The Gandia Airbnb market composition is heavily skewed towards Entire Home/Apt listings, which make up 92.8% of the 763 active rentals. This indicates strong guest preference for privacy and space.
- Looking at the property type distribution in Gandia, Apartment/Condo properties are the most common (84.7%), reflecting the local real estate landscape.
- Smaller segments like hotel/boutique, others, outdoor/unique (combined 3.4%) offer potential for unique stay experiences.
Gandia Airbnb Room Capacity Analysis (2026): Bedroom Distribution
Distribution of Listings by Number of Bedrooms
Room Capacity Insights for Gandia
- The dominant room capacity in Gandia is 3 bedrooms listings, making up 33.7% of the market. This suggests a strong demand for properties suitable for families or small groups.
- Together, 3 bedrooms and 2 bedrooms properties represent 66.1% of the active Airbnb listings in Gandia, indicating a high concentration in these sizes.
- A significant 44.3% of listings offer 3+ bedrooms, catering to larger groups and families seeking more space in Gandia.
Gandia Vacation Rental Guest Capacity Trends (2026)
Distribution of Listings by Guest Capacity
Guest Capacity Insights for Gandia
- The most common guest capacity trend in Gandia vacation rentals is listings accommodating 4 guests (29.9%). This suggests the primary traveler segment is likely small families or groups.
- Properties designed for 4 guests and 6 guests dominate the Gandia STR market, accounting for 55.5% of listings.
- 43.9% of properties accommodate 6+ guests, serving the market segment for larger families or group travel in Gandia.
- On average, properties in Gandia are equipped to host 4.9 guests.
Gandia Airbnb Booking Patterns (2026): Available vs. Booked Days
Available Days Distribution
Booked Days Distribution
Booking Pattern Insights for Gandia
- The most common availability pattern in Gandia falls within the 271-366 days range, representing 63.3% of listings. This suggests many properties have significant open periods on their calendars.
- Approximately 91.6% of listings show high availability (181+ days open annually), indicating potential for increased bookings or specific owner usage patterns.
- For booked days, the 31-90 days range is most frequent in Gandia (35.5%), reflecting common guest stay durations or potential owner blocking patterns.
- A notable 9.0% of properties secure long booking periods (181+ days booked per year), highlighting successful long-term rental strategies or significant owner usage.
Gandia Airbnb Minimum Stay Requirements Analysis
Distribution of Listings by Minimum Night Requirement
1 Night
65 listings
8.5% of total
2 Nights
65 listings
8.5% of total
3 Nights
42 listings
5.5% of total
4-6 Nights
191 listings
25.1% of total
7-29 Nights
61 listings
8% of total
30+ Nights
338 listings
44.4% of total
Key Insights
- The most prevalent minimum stay requirement in Gandia is 30+ Nights, adopted by 44.4% of listings. This highlights the market's preference for longer commitments.
- Very short stays (1-2 nights) are less common (17.0%), suggesting hosts prefer slightly longer bookings to optimize turnover.
- A significant segment (44.4%) caters to monthly stays (30+ nights) in Gandia, pointing to opportunities in the extended-stay market.
Recommendations
- Align with the market by considering a 30+ Nights minimum stay, as 44.4% of Gandia hosts use this setting.
- If feasible, allowing 1-night stays, especially midweek or during low season, could capture last-minute bookings, as only 8.5% currently do.
- Explore offering discounts for stays of 30+ nights to attract the 44.4% of the market seeking extended stays.
- Adjust minimum nights based on seasonality – potentially shorter during low season and longer during peak demand periods in Gandia.
Gandia Airbnb Cancellation Policy Trends Analysis (2026)
Super Strict 30 Days
15 listings
2% of total
Super Strict 60 Days
6 listings
0.8% of total
Limited
8 listings
1.1% of total
Flexible
108 listings
14.2% of total
Moderate
135 listings
17.8% of total
Firm
367 listings
48.4% of total
Strict
119 listings
15.7% of total
Cancellation Policy Insights for Gandia
- The prevailing Airbnb cancellation policy trend in Gandia is Firm, used by 48.4% of listings.
- A majority (64.1%) of hosts in Gandia utilize Firm or Strict policies, indicating a market where hosts prioritize booking security.
Recommendations for Hosts
- Consider adopting a Firm policy to align with the 48.4% market standard in Gandia.
- Regularly review your cancellation policy against competitors and market demand shifts in Gandia.
Gandia STR Booking Lead Time Analysis (2026)
Average Booking Lead Time by Month
Booking Lead Time Insights for Gandia
- The overall average booking lead time for vacation rentals in Gandia is 62 days.
- Guests book furthest in advance for stays during August (average 95 days), likely coinciding with peak travel demand or local events.
- The shortest booking windows occur for stays in February (average 30 days), indicating more last-minute travel plans during this time.
- Seasonally, Summer (82 days avg.) sees the longest lead times, while Winter (33 days avg.) has the shortest, reflecting typical travel planning cycles.
Recommendations for Hosts
- Use the overall average lead time (62 days) as a baseline for your pricing and availability strategy in Gandia.
- For August stays, consider implementing length-of-stay discounts or slightly higher rates for bookings made less than 95 days out to capitalize on advance planning.
- Target marketing efforts for the Summer season well in advance (at least 82 days) to capture early planners.
- Monitor your own booking lead times against these Gandia averages to identify opportunities for dynamic pricing adjustments.
Popular & Essential Airbnb Amenities in Gandia (2026)
Amenity Prevalence
Amenity Insights for Gandia
- Essential amenities in Gandia that guests expect include: Kitchen, TV. Lacking these (any) could significantly impact bookings.
- Popular amenities like Washer, Hot water, Dishes and silverware are common but not universal. Offering these can provide a competitive edge.
- Warning: Wifi is not universally provided but is considered essential globally. Ensure reliable Wifi is offered.
Recommendations for Hosts
- Ensure your listing includes all essential amenities for Gandia: Kitchen, TV.
- Prioritize adding missing essentials: Kitchen, TV.
- Consider adding popular differentiators like Washer or Hot water to increase appeal.
- Highlight unique or less common amenities you offer (e.g., hot tub, dedicated workspace, EV charger) in your listing description and photos.
- Regularly check competitor amenities in Gandia to stay competitive.
Gandia Airbnb Guest Demographics & Profile Analysis (2026)
Guest Profile Summary for Gandia
- The typical guest profile for Airbnb in Gandia consists of a mix of domestic (60%) and international guests, often arriving from nearby Madrid, typically belonging to the Post-2000s (Gen Z/Alpha) group (50%), primarily speaking English or Spanish.
- Domestic travelers account for 60.0% of guests.
- Key international markets include Spain (60%) and France (7.1%).
- Top languages spoken are English (33.6%) followed by Spanish (32.3%).
- A significant demographic segment is the Post-2000s (Gen Z/Alpha) group, representing 50% of guests.
Recommendations for Hosts
- Balance marketing efforts between domestic and international channels based on the guest mix.
- Tailor amenities and listing descriptions to appeal to the dominant Post-2000s (Gen Z/Alpha) demographic (e.g., highlight fast WiFi, smart home features, local guides).
- Highlight unique local experiences or amenities relevant to the primary guest profile.
- Consider seasonal promotions aligned with peak travel times for key origin markets.
Nearby Short-Term Rental Market Comparison
How does the Gandia Airbnb market stack up against its neighbors? Compare key performance metrics like average monthly revenue, ADR, and occupancy rates in surrounding areas to understand the broader regional STR landscape.
| Market | Active Properties | Monthly Revenue | Daily Rate | Avg. Occupancy |
|---|---|---|---|---|
| Olocau | 10 | $3,229 | $460.93 | 36% |
| Corbera | 16 | $2,781 | $231.25 | 45% |
| Picassent | 16 | $2,618 | $274.61 | 43% |
| Macastre | 15 | $2,518 | $312.89 | 34% |
| Manises | 27 | $2,511 | $201.27 | 43% |
| l'Eliana | 32 | $2,454 | $314.51 | 40% |
| Alboraia / Alboraya | 244 | $2,297 | $201.35 | 47% |
| Catral | 14 | $2,222 | $220.78 | 40% |
| Benissa | 523 | $2,182 | $303.68 | 39% |
| Bétera | 25 | $2,155 | $264.29 | 42% |