Finestrat Airbnb Market Analysis 2026: Short Term Rental Data & Vacation Rental Statistics in Valencian Community, Spain
Is Airbnb profitable in Finestrat in 2026? Explore comprehensive Airbnb analytics for Finestrat, Valencian Community, Spain to uncover income potential. This 2026 STR market report for Finestrat, based on AirROI data from February 2025 to January 2026, reveals key trends in the market of 317 active listings.
Whether you're considering an Airbnb investment in Finestrat, optimizing your existing vacation rental, or exploring rental arbitrage opportunities, understanding the Finestrat Airbnb data is crucial. Navigating the high regulation landscape is key to maximizing your short term rental income potential. Let's dive into the specifics.
Key Finestrat Airbnb Performance Metrics Overview
Monthly Airbnb Revenue Variations & Income Potential in Finestrat (2026)
Understanding the monthly revenue variations for Airbnb listings in Finestrat is key to maximizing your short term rental income potential. Seasonality significantly impacts earnings. Our analysis, based on data from the past 12 months, shows that the peak revenue month for STRs in Finestrat is typically August, while January often presents the lowest earnings, highlighting opportunities for strategic pricing adjustments during shoulder and low seasons. Explore the typical Airbnb income in Finestrat across different performance tiers:
- Best-in-class properties (Top 10%) achieve $6,099+ monthly, often utilizing dynamic pricing and superior guest experiences.
- Strong performing properties (Top 25%) earn $3,351 or more, indicating effective management and desirable locations/amenities.
- Typical properties (Median) generate around $1,925 per month, representing the average market performance.
- Entry-level properties (Bottom 25%) see earnings around $983, often with potential for optimization.
Average Monthly Airbnb Earnings Trend in Finestrat
Finestrat Airbnb Occupancy Rate Trends (2026)
Maximize your bookings by understanding the Finestrat STR occupancy trends. Seasonal demand shifts significantly influence how often properties are booked. Typically, Augustsees the highest demand (peak season occupancy), while January experiences the lowest (low season). Effective strategies, like adjusting minimum stays or offering promotions, can boost occupancy during slower periods. Here's how different property tiers perform in Finestrat:
- Best-in-class properties (Top 10%) achieve 81%+ occupancy, indicating high desirability and potentially optimized availability.
- Strong performing properties (Top 25%) maintain 65% or higher occupancy, suggesting good market fit and guest satisfaction.
- Typical properties (Median) have an occupancy rate around 41%.
- Entry-level properties (Bottom 25%) average 18% occupancy, potentially facing higher vacancy.
Average Monthly Occupancy Rate Trend in Finestrat
Average Daily Rate (ADR) Airbnb Trends in Finestrat (2026)
Effective short term rental pricing strategy in Finestrat involves understanding monthly ADR fluctuations. The Average Daily Rate (ADR) for Airbnb in Finestrat typically peaks in August and dips lowest during February. Leveraging Airbnb dynamic pricing tools or strategies based on this seasonality can significantly boost revenue. Here's a look at the typical nightly rates achieved:
- Best-in-class properties (Top 10%) command rates of $404+ per night, often due to premium features or locations.
- Strong performing properties (Top 25%) achieve nightly rates of $251 or more.
- Typical properties (Median) charge around $164 per night.
- Entry-level properties (Bottom 25%) earn around $112 per night.
Average Daily Rate (ADR) Trend by Month in Finestrat
Get Live Finestrat Market Intelligence 👇

Explore Real-time Analytics
Airbnb Seasonality Analysis & Trends in Finestrat (2026)
Peak Season (August, July, September)
- Revenue averages $4,603 per month
- Occupancy rates average 56.2%
- Daily rates average $246
Shoulder Season
- Revenue averages $2,389 per month
- Occupancy maintains around 44.1%
- Daily rates hold near $204
Low Season (January, November, December)
- Revenue drops to average $1,458 per month
- Occupancy decreases to average 28.2%
- Daily rates adjust to average $210
Seasonality Insights for Finestrat
- The Airbnb seasonality in Finestrat shows highly seasonal trends requiring careful strategy. While the sections above show seasonal averages, it's also insightful to look at the extremes:
- During the high season, the absolute peak month showcases Finestrat's highest earning potential, with monthly revenues capable of climbing to $5,659, occupancy reaching a high of 63.7%, and ADRs peaking at $257.
- Conversely, the slowest single month of the year, typically falling within the low season, marks the market's lowest point. In this month, revenue might dip to $1,132, occupancy could drop to 21.0%, and ADRs may adjust down to $188.
- Understanding both the seasonal averages and these monthly peaks and troughs in revenue, occupancy, and ADR is crucial for maximizing your Airbnb profit potential in Finestrat.
Seasonal Strategies for Maximizing Profit
- Peak Season: Maximize revenue through premium pricing and potentially longer minimum stays. Ensure high availability.
- Low Season: Offer competitive pricing, special promotions (e.g., extended stay discounts), and flexible cancellation policies. Target off-season travelers like remote workers or budget-conscious guests.
- Shoulder Seasons: Implement dynamic pricing that balances peak and low rates. Target weekend travelers or specific events. Offer slightly more flexible terms than peak season.
- Regularly analyze your own performance against these Finestrat seasonality benchmarks and adjust your pricing and availability strategy accordingly.
Best Areas for Airbnb Investment in Finestrat (2026)
Exploring the top neighborhoods for short-term rentals in Finestrat? This section highlights key areas, outlining why they are attractive for hosts and guests, along with notable local attractions. Consider these locations based on your target guest profile and investment strategy.
| Neighborhood / Area | Why Host Here? (Target Guests & Appeal) | Key Attractions & Landmarks |
|---|---|---|
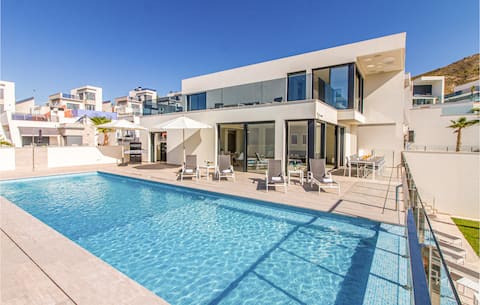
| Cala Finestrat | A stunning beach area known for its golden sands and family-friendly atmosphere. Ideal for beach lovers and tourists seeking relaxation, water sports, and sunshine. | Cala Finestrat Beach, La Cala, Restaurants and bars along the beach, Water sports activities, Coastal promenades |
| Finestrat Old Town | A picturesque traditional Spanish village with charming narrow streets and stunning views. It attracts visitors wanting to experience authentic local culture and history. | Historic Old Town, Church of San Bartolomé, Local markets, Breathtaking mountain views, Cultural festivals |
| Terra Mítica | A renowned theme park that draws families and thrill-seekers. Ideal for tourists looking for entertaining and adventurous activities close to their stay. | Terra Mítica amusement park, Themed areas and attractions, Culinary options within the park, Shopping in nearby areas, Seasonal events and shows |
| Aqualandia | One of the largest water parks in Europe, drawing in families and thrill-seekers during the summer. A fantastic location for hosts targeting family vacations. | Aqualandia water park, Water slides and attractions, Nearby accommodations, Dining facilities, Evening entertainment |
| La Marina de Finestrat | A beautiful marina area known for its luxury yachts and waterfront dining. Attracts visitors looking for upscale amenities and a vibrant atmosphere. | Marina with luxury yachts, Waterfront restaurants and bars, Shopping facilities, Sailing and boating activities, Scenic views |
| Golf Courses | Finestrat is home to several golf courses, attracting golf enthusiasts. A great option for promoting stays focused on golf vacations. | Golf course access, Tennis facilities nearby, Clubhouses and dining, Golf-centric events, Scenic landscapes |
| Outdoor Activities | The surrounding nature offers hiking, cycling, and adventure sports. Ideal for active travelers looking for more than just beach relaxation. | Hiking trails in the hills, Cycling routes, Adventure sports companies, Nature parks, Scenic picnic areas |
| Benidorm Vista Point | The view point offers spectacular views of the coastline and nearby city. A popular spot for tourists wanting breathtaking sights for their photographs. | Scenic viewpoints, Photography opportunities, Nature walking trails, Nearby restaurants, Cultural landmarks in Benidorm |
Understanding Airbnb License Requirements & STR Laws in Finestrat (2026)
Yes, Finestrat, Valencian Community, Spain enforces high STR regulations. Obtaining a license and ensuring compliance is almost certainly required according to current 2026 STR laws. Always verify the latest short term rental regulations and Airbnb license requirements directly with local government authorities for Finestrat to ensure full compliance before hosting.
(Source: AirROI data, 2026, based on 68% licensed listings)
Top Performing Airbnb Properties in Finestrat (2026)
Benchmark your potential! Explore examples of top-performing Airbnb properties in Finestratbased on Trailing Twelve Month (TTM) revenue. Analyze their characteristics, revenue, occupancy rate, and ADR to understand what drives success in this market.
Lovely home in Finestrat with WiFi
Entire Place • 5 bedrooms

villa high standing Benidorm/ sea view
Entire Place • 6 bedrooms

New luxury villa in Benidorm/ sea view
Entire Place • 6 bedrooms

Big groups up to25pax Only 10min to the PARTY area
Entire Place • N/A
Luxury villa with sea views & Benidorm
Entire Place • 4 bedrooms
Luxury villa Benidorm, sea view
Entire Place • 6 bedrooms
Note: Performance varies based on location, size, amenities, seasonality, and management quality. Data reflects the past 12 months.
Top Performing Airbnb Hosts in Finestrat (2026)
Learn from the best! This table showcases top-performing Airbnb hosts in Finestrat based on the number of properties managed and estimated total revenue over the past year. Analyze their scale and performance metrics.
| Host Name | Properties | Grossing Revenue | Stay Reviews | Avg Rating |
|---|---|---|---|---|
| Rental Benidorm | 19 | $725,216 | 408 | 4.65/5.0 |
| Kevin David | 3 | $355,407 | 293 | 4.94/5.0 |
| Nino - Interhome | 9 | $207,594 | 48 | 4.50/5.0 |
| Christelle | 2 | $184,569 | 38 | 4.96/5.0 |
| Javier | 2 | $160,360 | 68 | 4.72/5.0 |
| Novasol | 1 | $152,102 | 7 | 4.86/5.0 |
| Inmobiliaria 2004 Finestrat | 15 | $136,978 | 49 | 4.72/5.0 |
| Book A Paradise | 4 | $113,972 | 33 | 4.64/5.0 |
| John And Tatiana Lovely Oasis | 2 | $109,702 | 142 | 4.88/5.0 |
| Ger | 2 | $104,006 | 70 | 4.95/5.0 |
Analyzing the strategies of top hosts, such as their property selection, pricing, and guest communication, can offer valuable lessons for optimizing your own Airbnb operations in Finestrat.
Dive Deeper: Advanced Finestrat STR Market Data (2026)
Ready to unlock more insights? AirROI provides access to advanced metrics and comprehensive Airbnb data for Finestrat. Explore detailed analytics beyond this report to refine your investment strategy, optimize pricing, and maximize your vacation rental profits.
Explore Advanced MetricsFinestrat Short-Term Rental Market Composition (2026): Property & Room Types
Room Type Distribution
Property Type Distribution
Market Composition Insights for Finestrat
- The Finestrat Airbnb market composition is heavily skewed towards Entire Home/Apt listings, which make up 98.7% of the 317 active rentals. This indicates strong guest preference for privacy and space.
- Looking at the property type distribution in Finestrat, Apartment/Condo properties are the most common (64.7%), reflecting the local real estate landscape.
- Houses represent a significant 34.1% portion, catering likely to families or larger groups.
- Smaller segments like outdoor/unique, hotel/boutique (combined 1.2%) offer potential for unique stay experiences.
Finestrat Airbnb Room Capacity Analysis (2026): Bedroom Distribution
Distribution of Listings by Number of Bedrooms
Room Capacity Insights for Finestrat
- The dominant room capacity in Finestrat is 2 bedrooms listings, making up 42.6% of the market. This suggests a strong demand for properties suitable for couples or solo travelers.
- Together, 2 bedrooms and 3 bedrooms properties represent 67.2% of the active Airbnb listings in Finestrat, indicating a high concentration in these sizes.
- A significant 32.5% of listings offer 3+ bedrooms, catering to larger groups and families seeking more space in Finestrat.
Finestrat Vacation Rental Guest Capacity Trends (2026)
Distribution of Listings by Guest Capacity
Guest Capacity Insights for Finestrat
- The most common guest capacity trend in Finestrat vacation rentals is listings accommodating 4 guests (39.7%). This suggests the primary traveler segment is likely small families or groups.
- Properties designed for 4 guests and 6 guests dominate the Finestrat STR market, accounting for 70.6% of listings.
- 42.5% of properties accommodate 6+ guests, serving the market segment for larger families or group travel in Finestrat.
- On average, properties in Finestrat are equipped to host 5.1 guests.
Finestrat Airbnb Booking Patterns (2026): Available vs. Booked Days
Available Days Distribution
Booked Days Distribution
Booking Pattern Insights for Finestrat
- The most common availability pattern in Finestrat falls within the 271-366 days range, representing 53.3% of listings. This suggests many properties have significant open periods on their calendars.
- Approximately 79.8% of listings show high availability (181+ days open annually), indicating potential for increased bookings or specific owner usage patterns.
- For booked days, the 31-90 days range is most frequent in Finestrat (27.1%), reflecting common guest stay durations or potential owner blocking patterns.
- A notable 21.8% of properties secure long booking periods (181+ days booked per year), highlighting successful long-term rental strategies or significant owner usage.
Finestrat Airbnb Minimum Stay Requirements Analysis
Distribution of Listings by Minimum Night Requirement
1 Night
21 listings
6.6% of total
2 Nights
26 listings
8.2% of total
3 Nights
20 listings
6.3% of total
4-6 Nights
77 listings
24.3% of total
7-29 Nights
30 listings
9.5% of total
30+ Nights
143 listings
45.1% of total
Key Insights
- The most prevalent minimum stay requirement in Finestrat is 30+ Nights, adopted by 45.1% of listings. This highlights the market's preference for longer commitments.
- Very short stays (1-2 nights) are less common (14.8%), suggesting hosts prefer slightly longer bookings to optimize turnover.
- A significant segment (45.1%) caters to monthly stays (30+ nights) in Finestrat, pointing to opportunities in the extended-stay market.
Recommendations
- Align with the market by considering a 30+ Nights minimum stay, as 45.1% of Finestrat hosts use this setting.
- If feasible, allowing 1-night stays, especially midweek or during low season, could capture last-minute bookings, as only 6.6% currently do.
- Explore offering discounts for stays of 30+ nights to attract the 45.1% of the market seeking extended stays.
- Adjust minimum nights based on seasonality – potentially shorter during low season and longer during peak demand periods in Finestrat.
Finestrat Airbnb Cancellation Policy Trends Analysis (2026)
Super Strict 30 Days
9 listings
2.9% of total
Super Strict 60 Days
6 listings
1.9% of total
Limited
1 listings
0.3% of total
Flexible
52 listings
16.6% of total
Moderate
91 listings
29% of total
Firm
114 listings
36.3% of total
Strict
41 listings
13.1% of total
Cancellation Policy Insights for Finestrat
- The prevailing Airbnb cancellation policy trend in Finestrat is Firm, used by 36.3% of listings.
- There's a relatively balanced mix between guest-friendly (45.6%) and stricter (49.4%) policies, offering choices for different guest needs.
Recommendations for Hosts
- Consider adopting a Firm policy to align with the 36.3% market standard in Finestrat.
- Using a Strict policy might deter some guests, as only 13.1% of listings use it. Evaluate if potential revenue protection outweighs possible lower booking rates.
- Regularly review your cancellation policy against competitors and market demand shifts in Finestrat.
Finestrat STR Booking Lead Time Analysis (2026)
Average Booking Lead Time by Month
Booking Lead Time Insights for Finestrat
- The overall average booking lead time for vacation rentals in Finestrat is 65 days.
- Guests book furthest in advance for stays during August (average 91 days), likely coinciding with peak travel demand or local events.
- The shortest booking windows occur for stays in February (average 39 days), indicating more last-minute travel plans during this time.
- Seasonally, Summer (74 days avg.) sees the longest lead times, while Spring (53 days avg.) has the shortest, reflecting typical travel planning cycles.
Recommendations for Hosts
- Use the overall average lead time (65 days) as a baseline for your pricing and availability strategy in Finestrat.
- For August stays, consider implementing length-of-stay discounts or slightly higher rates for bookings made less than 91 days out to capitalize on advance planning.
- Target marketing efforts for the Summer season well in advance (at least 74 days) to capture early planners.
- Monitor your own booking lead times against these Finestrat averages to identify opportunities for dynamic pricing adjustments.
Popular & Essential Airbnb Amenities in Finestrat (2026)
Amenity Prevalence
Amenity Insights for Finestrat
- Essential amenities in Finestrat that guests expect include: Washer, Kitchen, TV. Lacking these (any) could significantly impact bookings.
- Popular amenities like Wifi, Air conditioning, Pool are common but not universal. Offering these can provide a competitive edge.
- A pool is a highly desired but not standard amenity, making it a key feature for attracting guests seeking leisure in Finestrat.
- Warning: Wifi is not universally provided but is considered essential globally. Ensure reliable Wifi is offered.
Recommendations for Hosts
- Ensure your listing includes all essential amenities for Finestrat: Washer, Kitchen, TV.
- Prioritize adding missing essentials: Washer, Kitchen, TV.
- Consider adding popular differentiators like Wifi or Air conditioning to increase appeal.
- Highlight unique or less common amenities you offer (e.g., hot tub, dedicated workspace, EV charger) in your listing description and photos.
- Regularly check competitor amenities in Finestrat to stay competitive.
Finestrat Airbnb Guest Demographics & Profile Analysis (2026)
Guest Profile Summary for Finestrat
- The typical guest profile for Airbnb in Finestrat consists of predominantly international visitors (70%), with top international origins including United Kingdom, typically belonging to the Post-2000s (Gen Z/Alpha) group (50%), primarily speaking English or Spanish.
- Domestic travelers account for 30.0% of guests.
- Key international markets include Spain (30%) and United Kingdom (24.8%).
- Top languages spoken are English (35.3%) followed by Spanish (21.1%).
- A significant demographic segment is the Post-2000s (Gen Z/Alpha) group, representing 50% of guests.
Recommendations for Hosts
- Focus marketing internationally, particularly towards travelers from United Kingdom.
- Tailor amenities and listing descriptions to appeal to the dominant Post-2000s (Gen Z/Alpha) demographic (e.g., highlight fast WiFi, smart home features, local guides).
- Highlight unique local experiences or amenities relevant to the primary guest profile.
- Consider seasonal promotions aligned with peak travel times for key origin markets.
Nearby Short-Term Rental Market Comparison
How does the Finestrat Airbnb market stack up against its neighbors? Compare key performance metrics like average monthly revenue, ADR, and occupancy rates in surrounding areas to understand the broader regional STR landscape.
| Market | Active Properties | Monthly Revenue | Daily Rate | Avg. Occupancy |
|---|---|---|---|---|
| Olocau | 10 | $3,229 | $460.93 | 36% |
| Corbera | 16 | $2,781 | $231.25 | 45% |
| Picassent | 16 | $2,618 | $274.61 | 43% |
| Macastre | 15 | $2,518 | $312.89 | 34% |
| Manises | 27 | $2,511 | $201.27 | 43% |
| l'Eliana | 32 | $2,454 | $314.51 | 40% |
| Alboraia / Alboraya | 244 | $2,297 | $201.35 | 47% |
| Catral | 14 | $2,222 | $220.78 | 40% |
| Benissa | 523 | $2,182 | $303.68 | 39% |
| Bétera | 25 | $2,155 | $264.29 | 42% |